The Kelvin UI for Dummies
This is the introduction to the Kelvin UI course.
By the end of this page, you will understand what the Kelvin UI is, who uses it, and how each user role interacts with it.
What is the Kelvin UI?
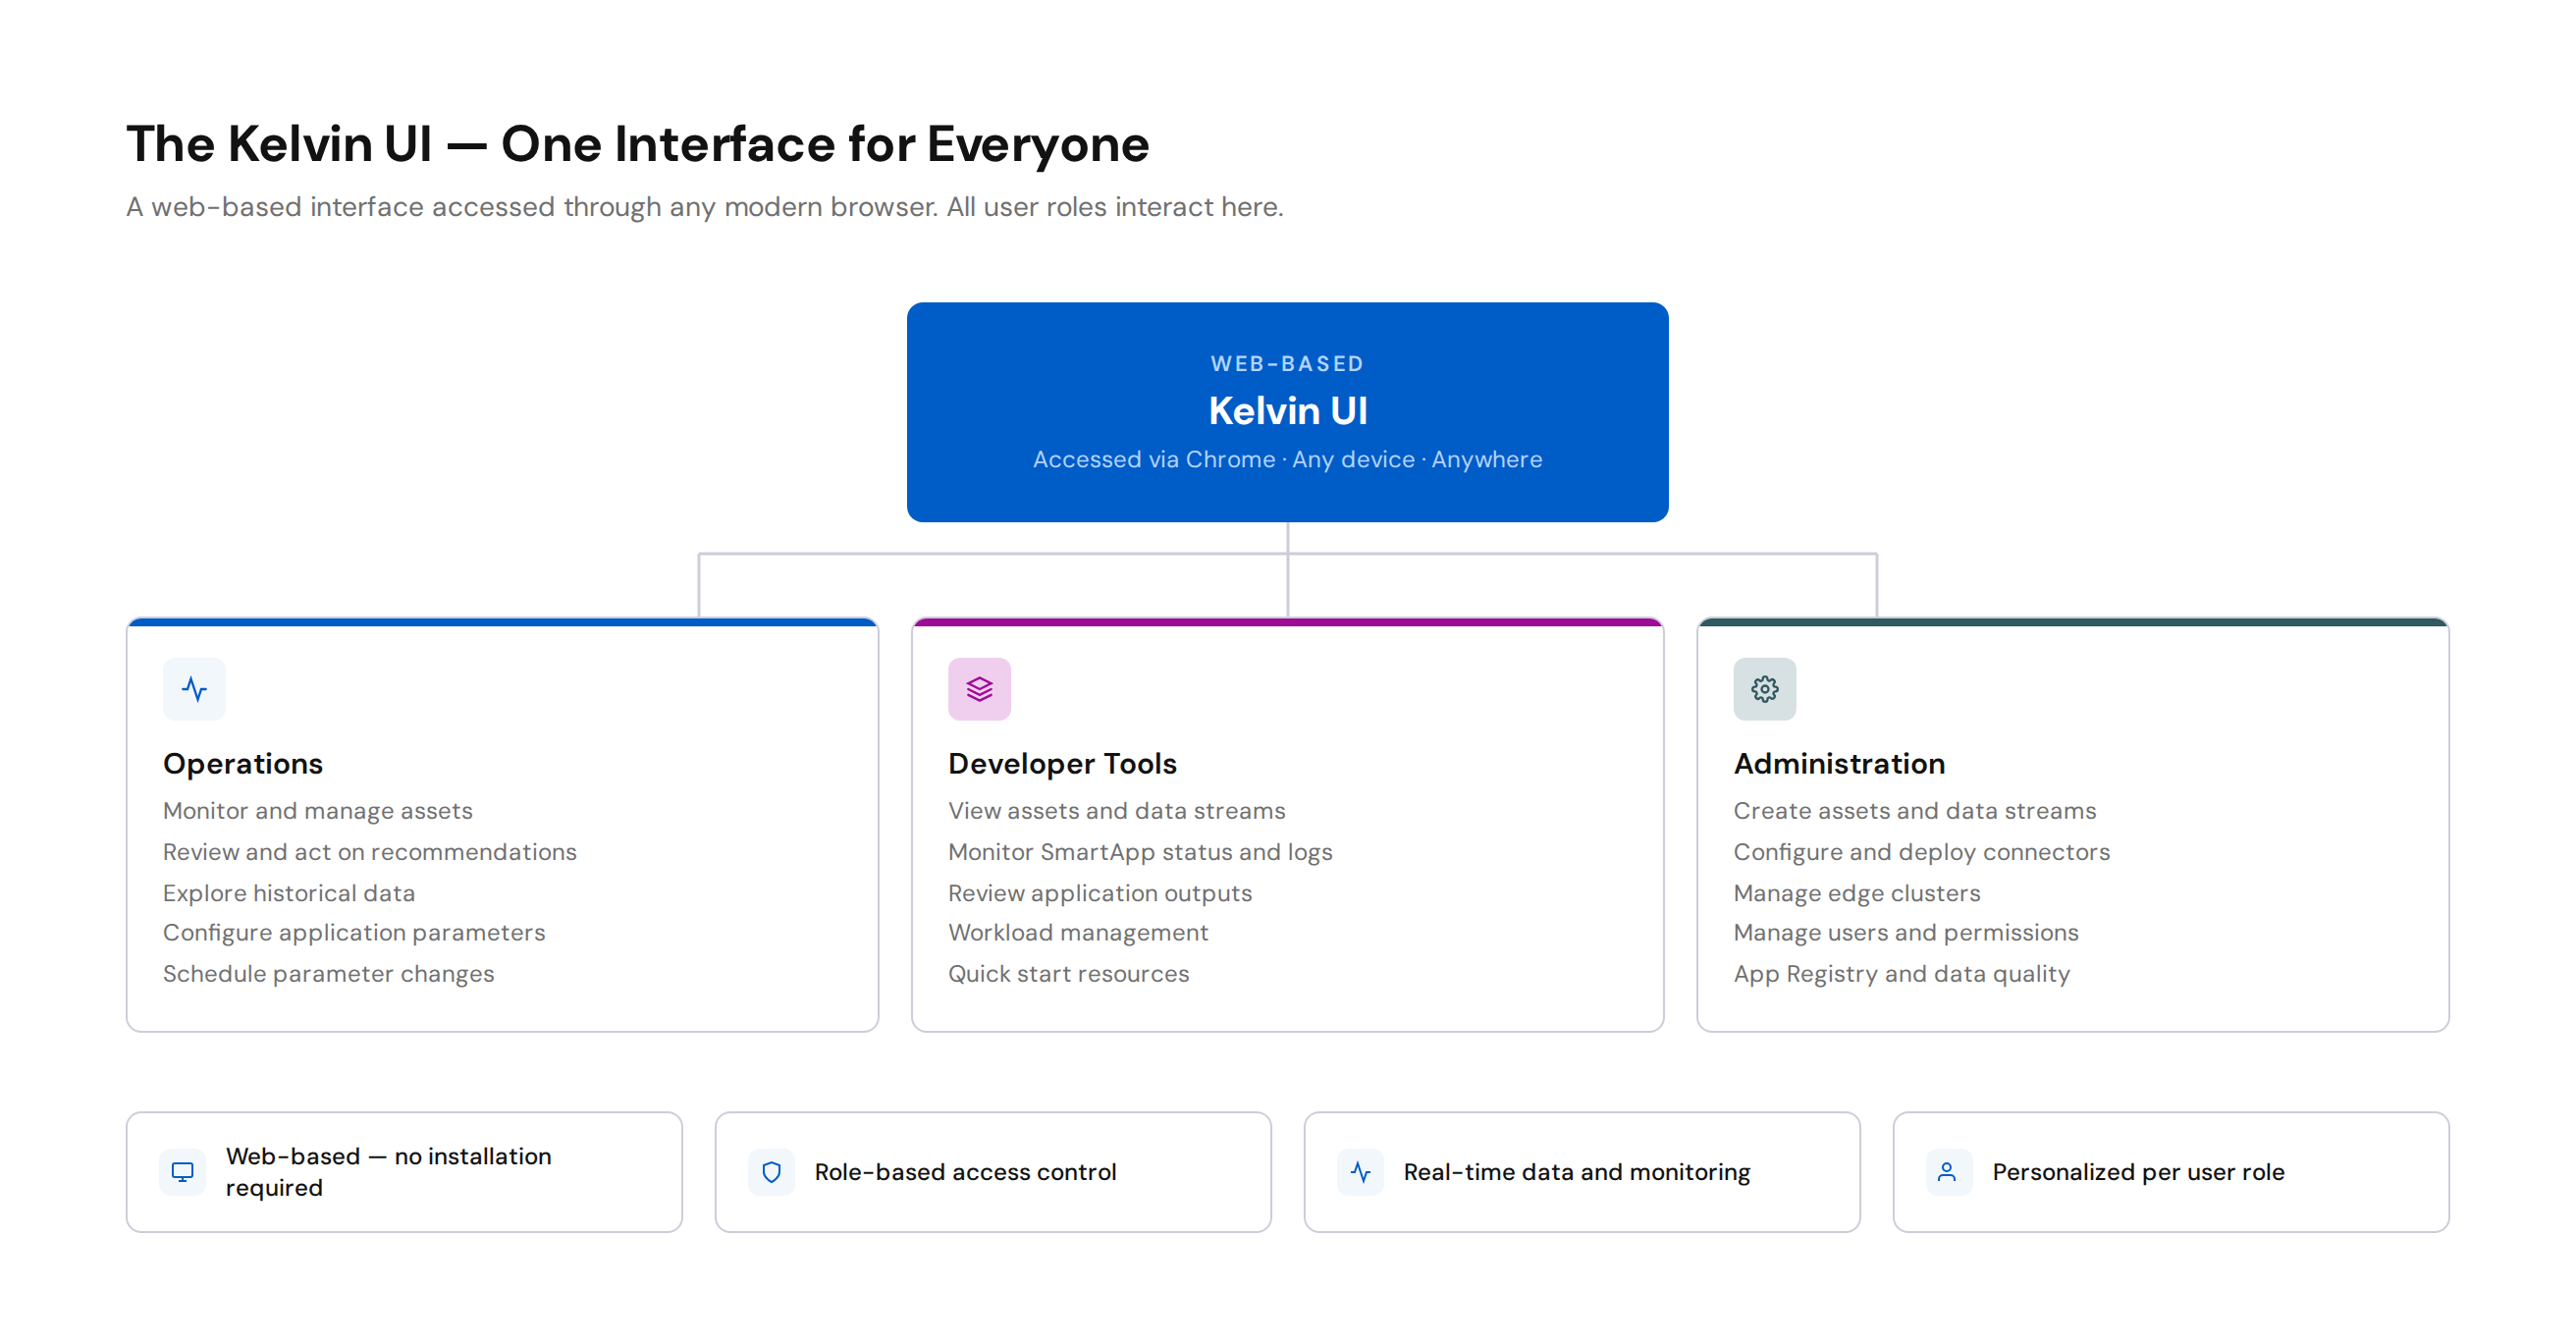
The Kelvin UI is a web-based interface accessed through any modern browser. It is the single place where all three types of Kelvin users can interact with the platform — managing assets, reviewing data, acting on recommendations, and administering the system.
Browser Support
The Kelvin UI is fully tested on the latest version of Google Chrome. For a seamless experience, always use the latest Chrome version.
Who Uses It?
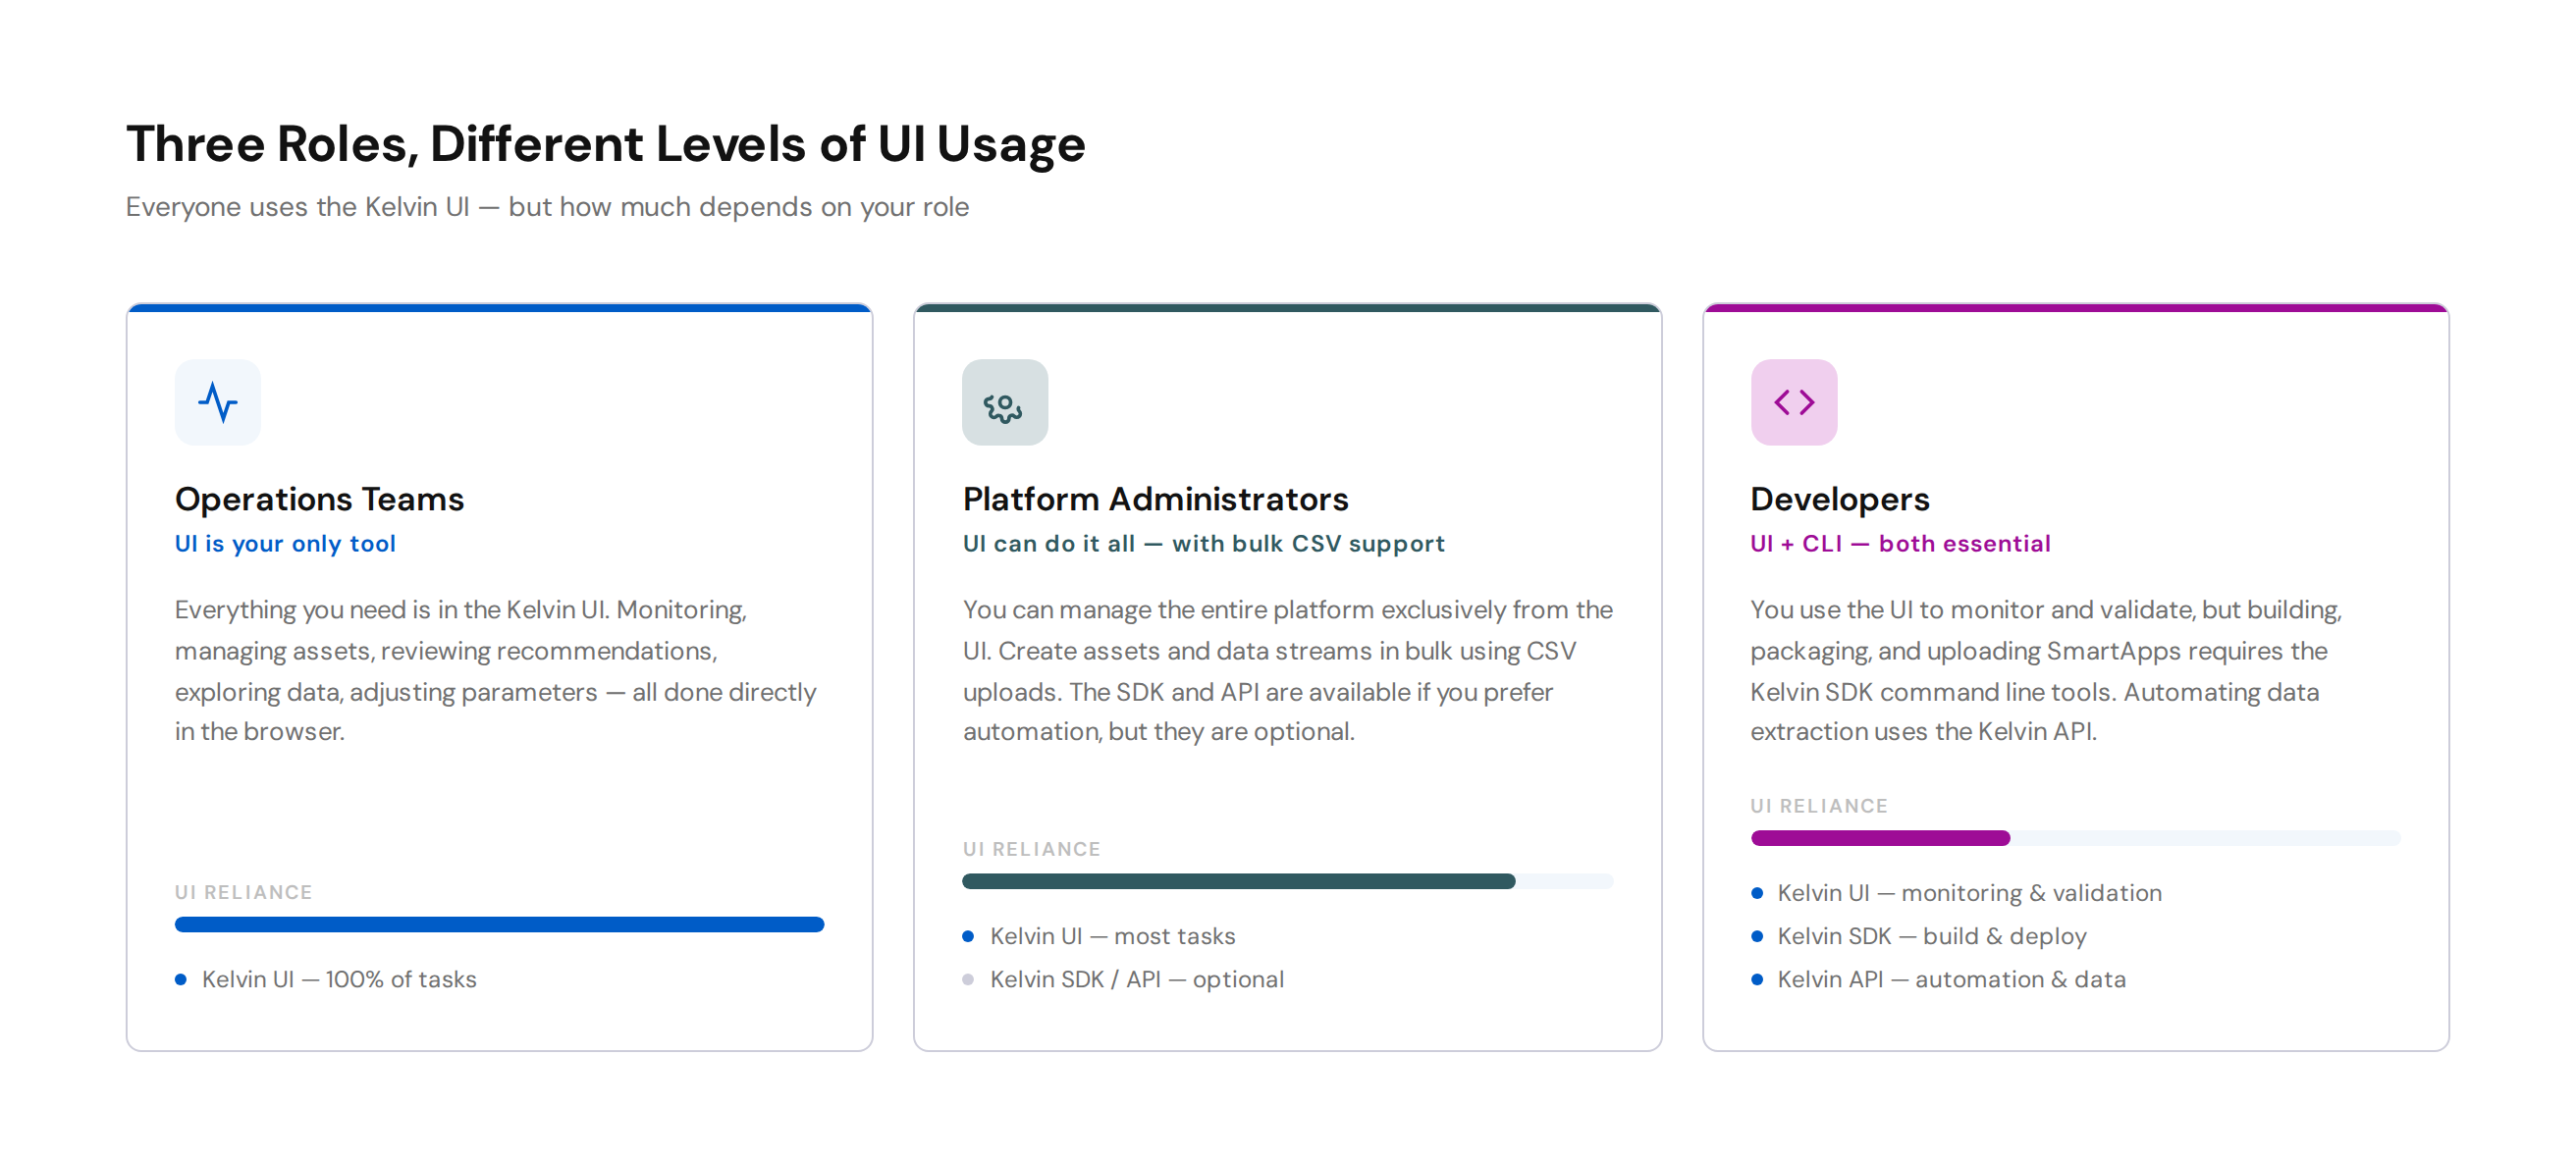
All three Kelvin user roles interact with the Kelvin UI, but the depth and frequency of their usage differs significantly.
Operations Teams — UI is Your Home
Operations Engineers live in the Kelvin UI. It is the only tool they need.
Everything an Operations Engineer does — monitoring assets, reviewing recommendations, approving or rejecting actions, exploring historical data, adjusting application parameters, and scheduling changes — happens directly in the Kelvin UI.
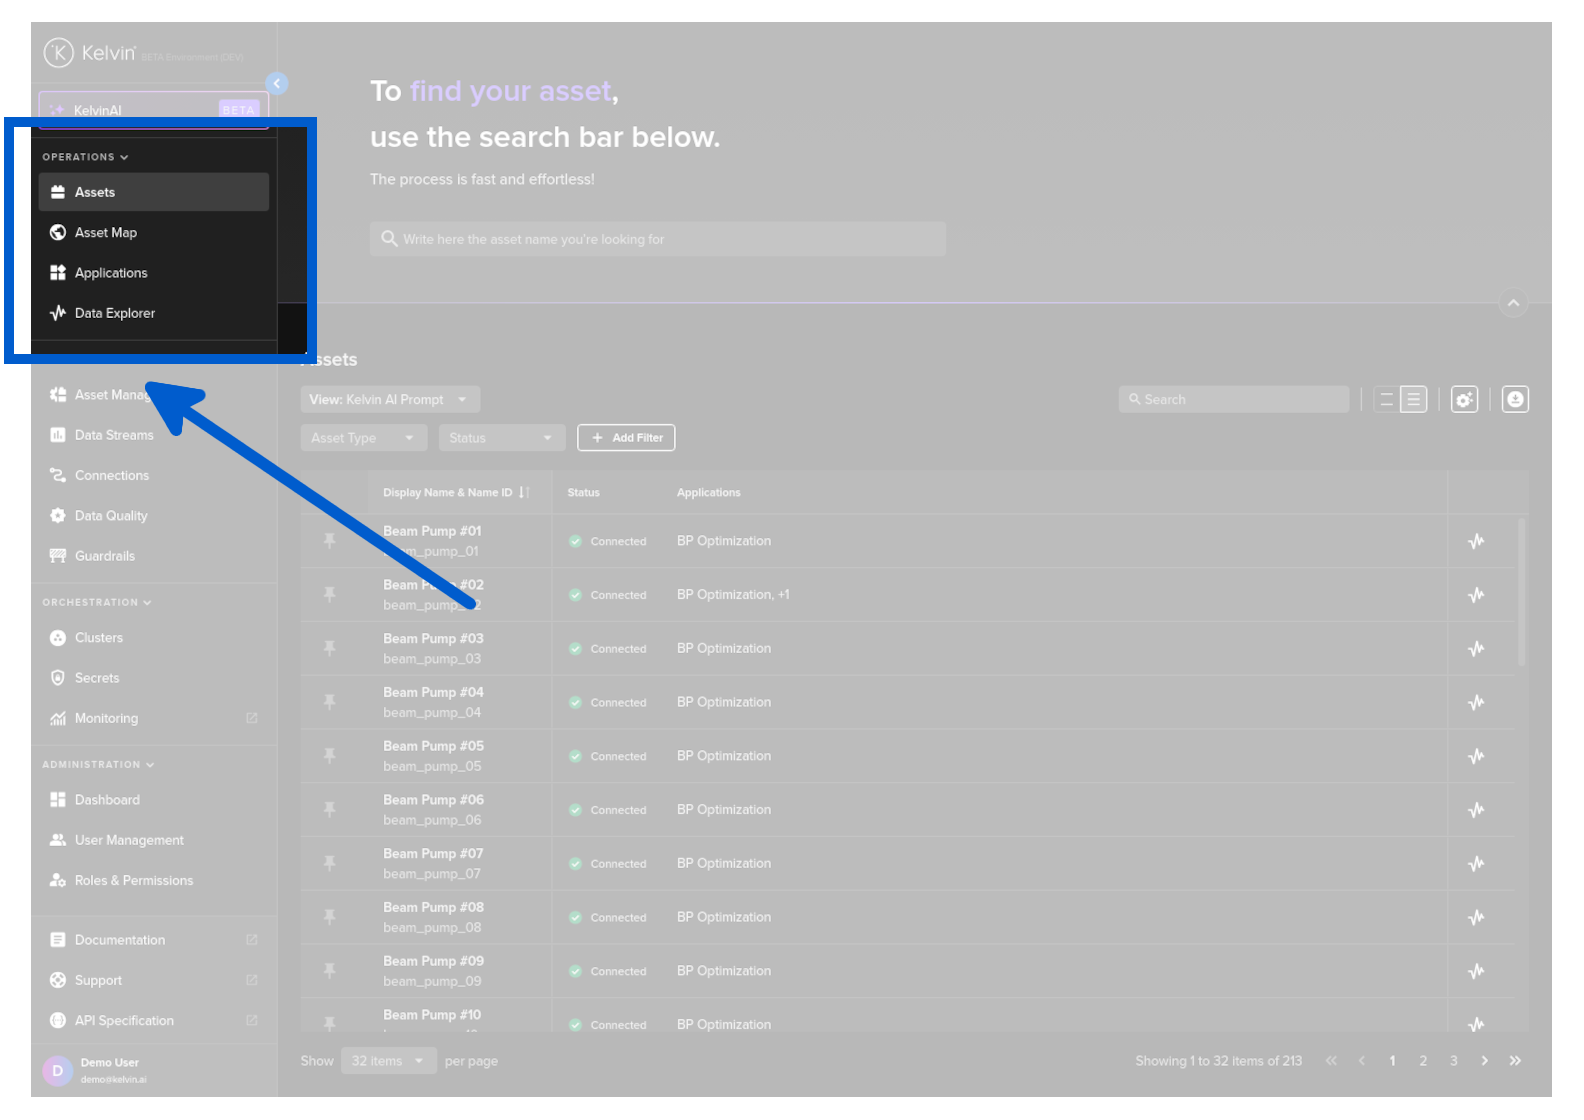
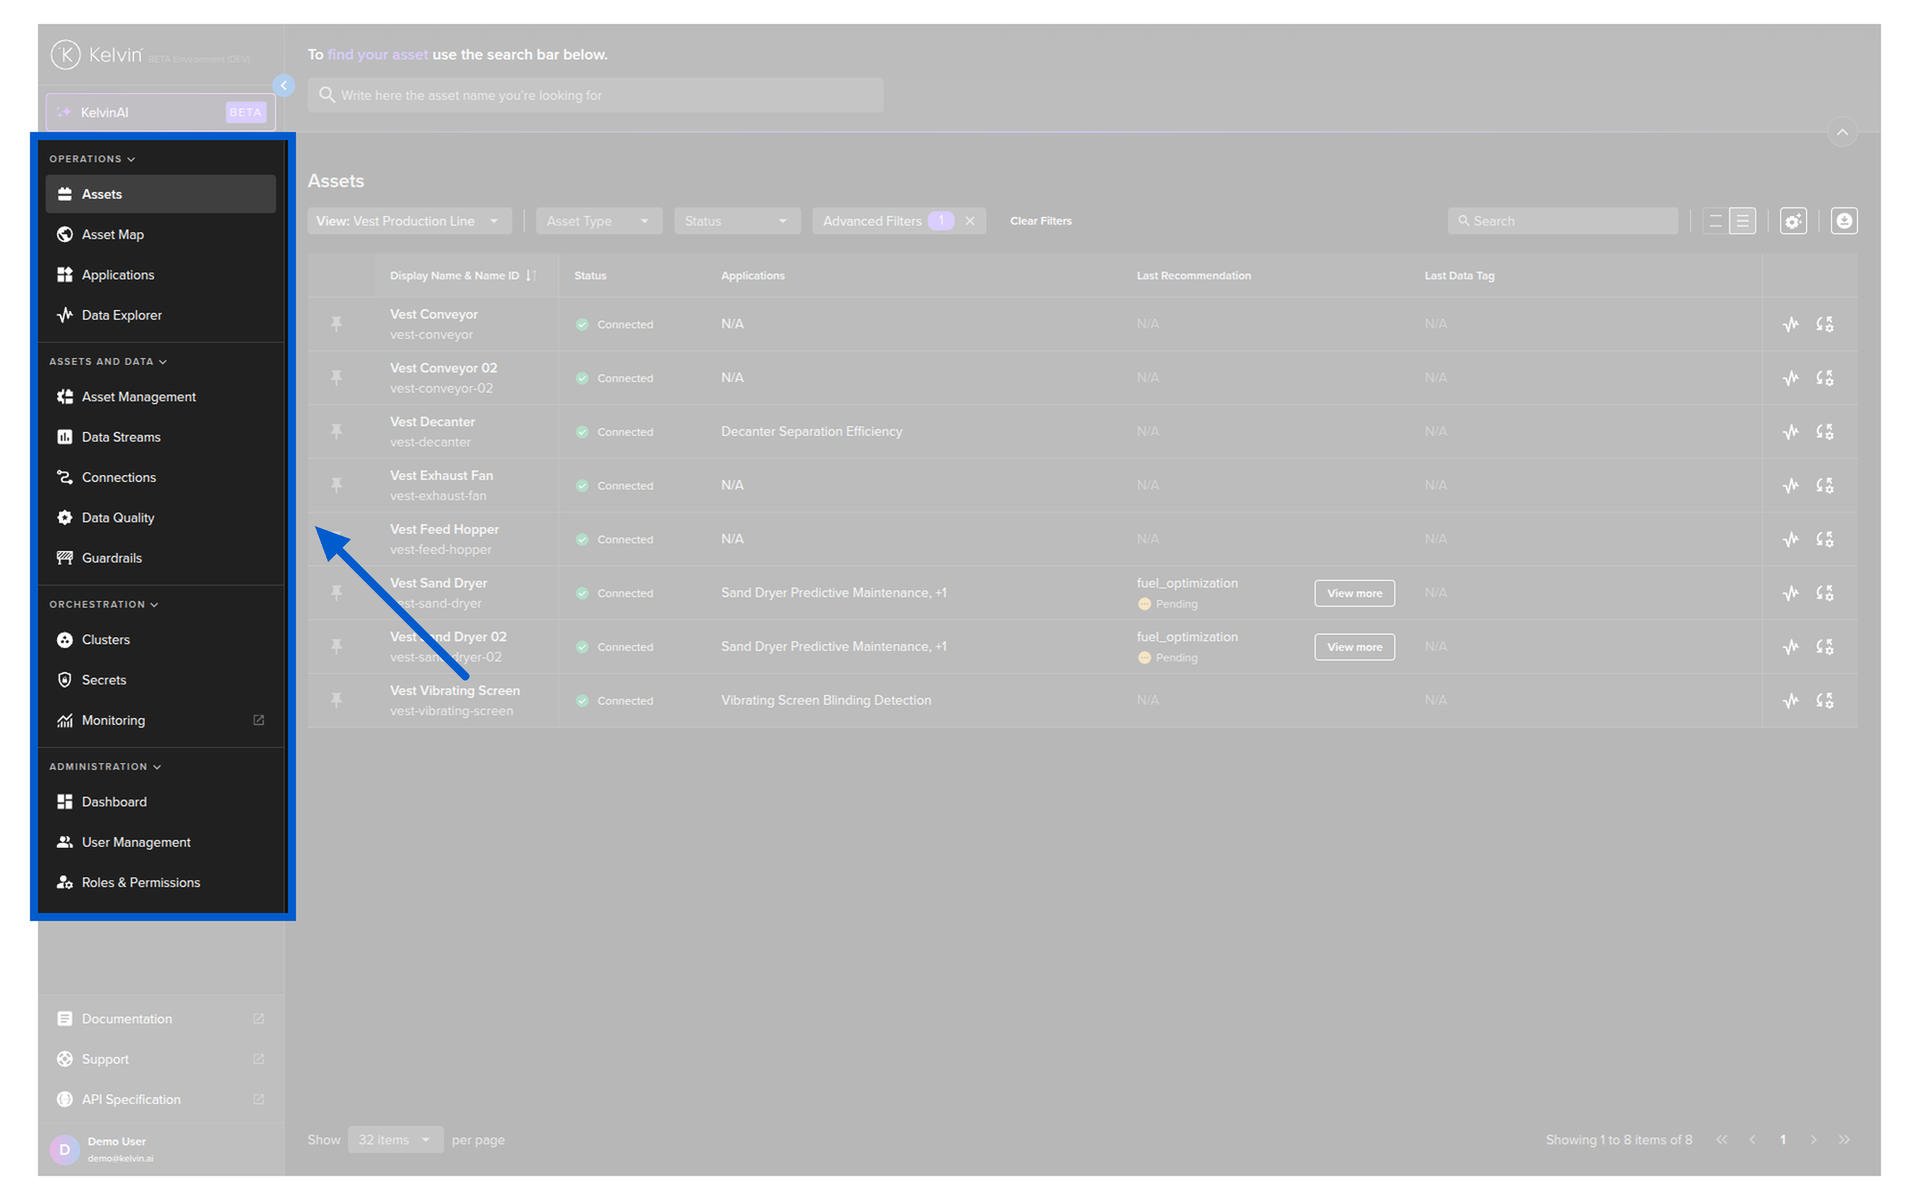
The left-hand sidebar provides the Operations section, which brings together all the tools needed to monitor, manage, configure, and control assets.
Key activities in the Kelvin UI for Operations:
- View and filter all assets and their data streams
- Review and act on recommendations from SmartApps
- Monitor real-time and historical data in the Data Explorer
- Change application configuration parameters per asset
- Deploy premade SmartApps and ML models to assets
- Schedule parameter changes
- Manually update data stream values when needed
Platform Administrators — UI is Your Primary Tool
Platform Administrators can manage the entire platform exclusively through the Kelvin UI if they choose to. The UI provides access to all the administration areas needed to set up and maintain the platform.
Key activities in the Kelvin UI for Administrators:
- Create and manage assets and data streams — individually or in bulk
- Configure and deploy connectors to data sources
- Set up and manage edge clusters
- Monitor infrastructure health
- Manage users, groups, and access permissions
- Configure data quality rules
- Manage the App Registry
Bulk Operations
Platform Administrators do not need to create assets or data streams one by one. You can prepare a CSV file with all the information needed and upload it directly in the Kelvin UI to create assets and data streams in bulk. This makes initial setup and large-scale changes fast and efficient.
Developers — UI is Part of Your Toolkit
Developers interact with the Kelvin UI for some tasks, but the UI alone is not enough. Many developer tasks — building SmartApps, packaging applications, uploading them to the App Registry — can only be done from the command line using the Kelvin SDK.
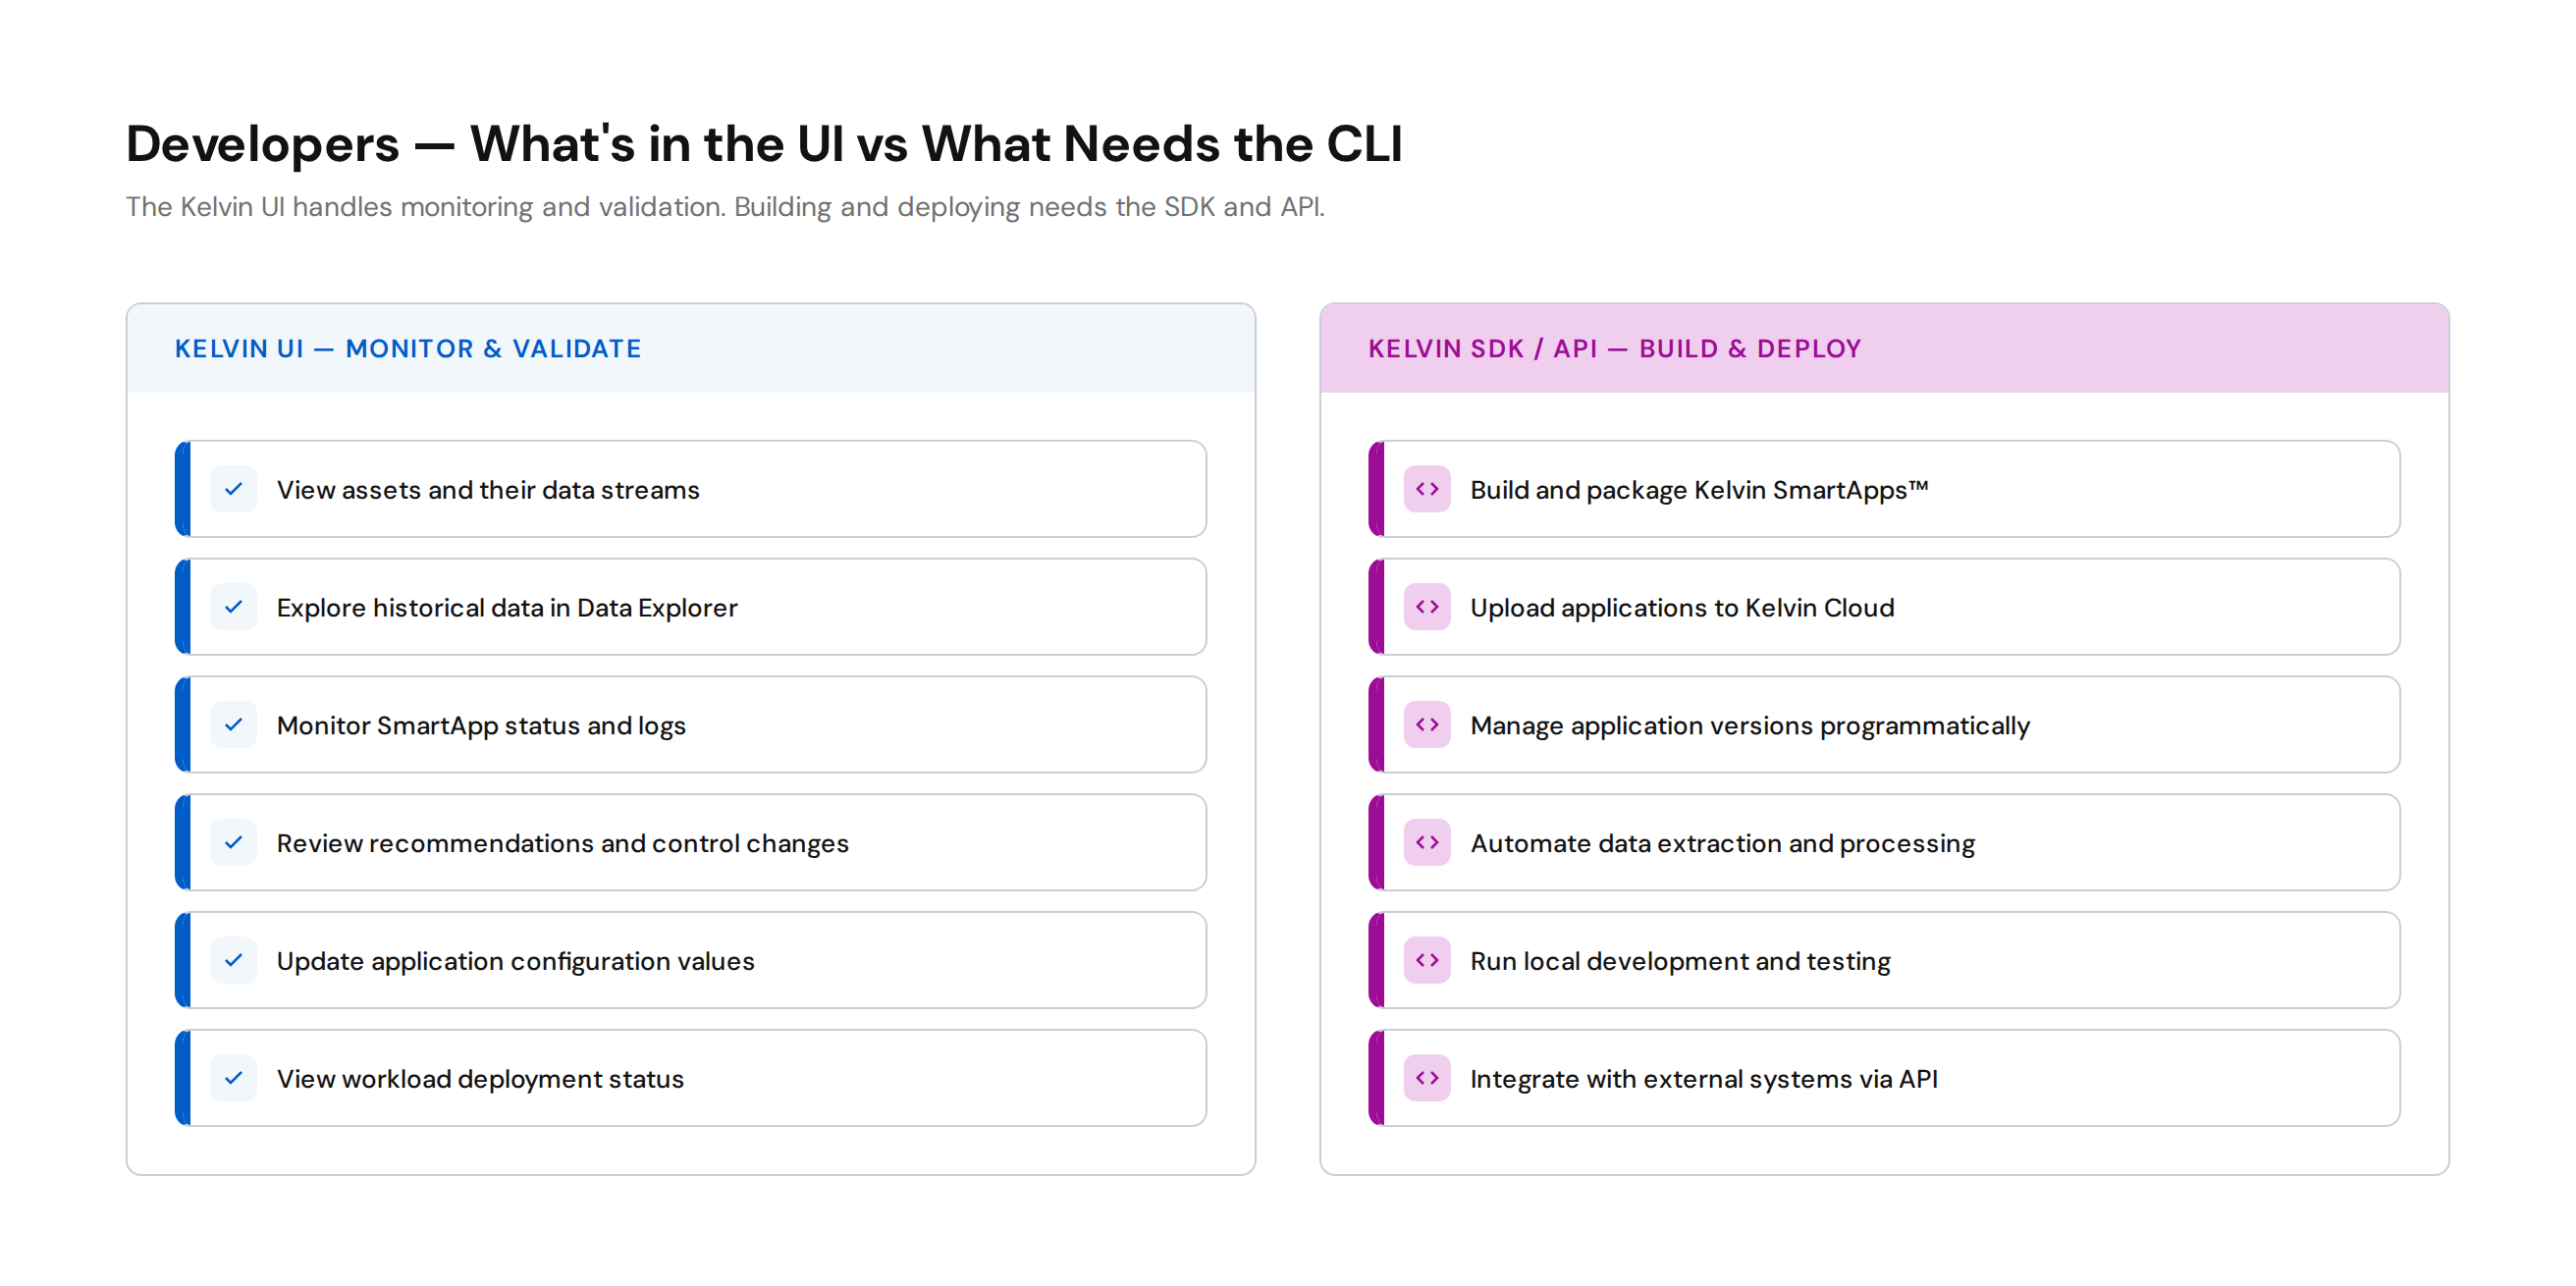
What developers can do in the Kelvin UI:
- View assets and their data streams
- Explore historical data in the Data Explorer
- Monitor application status and logs
- Review recommendations and control changes their SmartApps produce
- Update application configuration values
What developers need the CLI / SDK / API for:
- Build and package Kelvin SmartApps™
- Upload applications to the Kelvin Cloud
- Automate data extraction and processing
- Manage application versions programmatically
- Run local development and testing environments
For Developers
Think of the Kelvin UI as your monitoring and validation tool — you check that your SmartApps are producing the right results. The Kelvin SDK and Kelvin API are your build and deploy tools. For automating data extraction or integrating with external pipelines, the Kelvin API is the way to go.
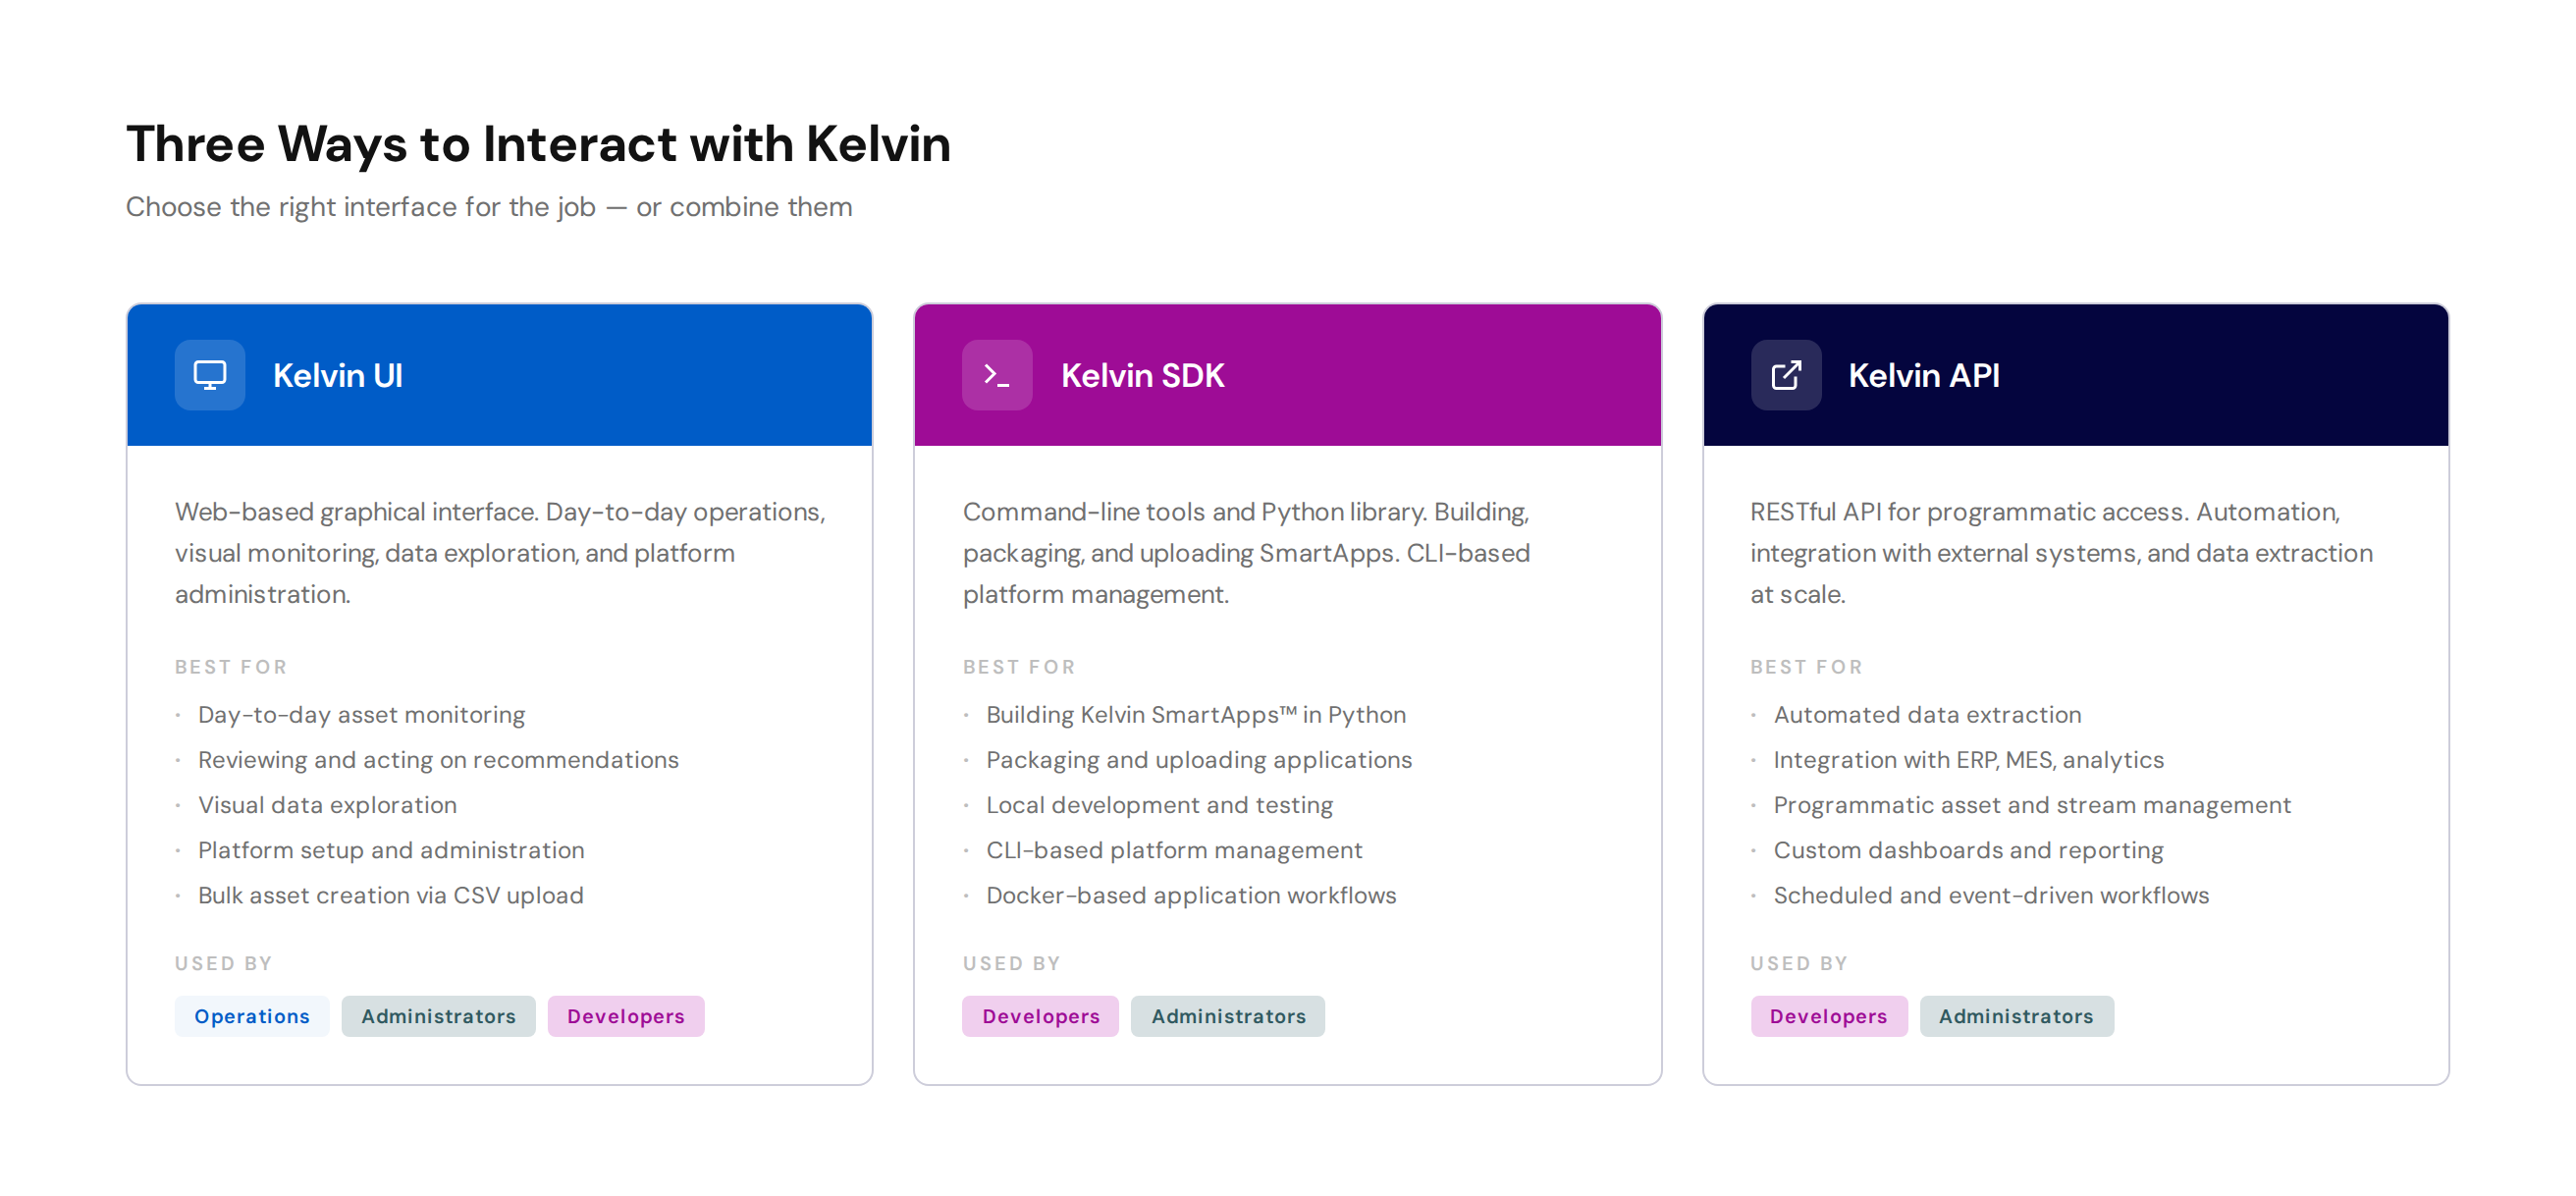
The Three Interfaces
Kelvin provides three ways to interact with the platform. Understanding when to use each one is key.
| Interface | Best For | Used By |
|---|---|---|
| Kelvin UI | Day-to-day operations, monitoring, administration, visual data exploration | Operations, Administrators, Developers |
| Kelvin SDK | Building SmartApps, packaging and uploading applications, CLI-based management | Developers, Administrators |
| Kelvin API | Automation, programmatic access, integration with external systems, data extraction at scale | Developers, Administrators |
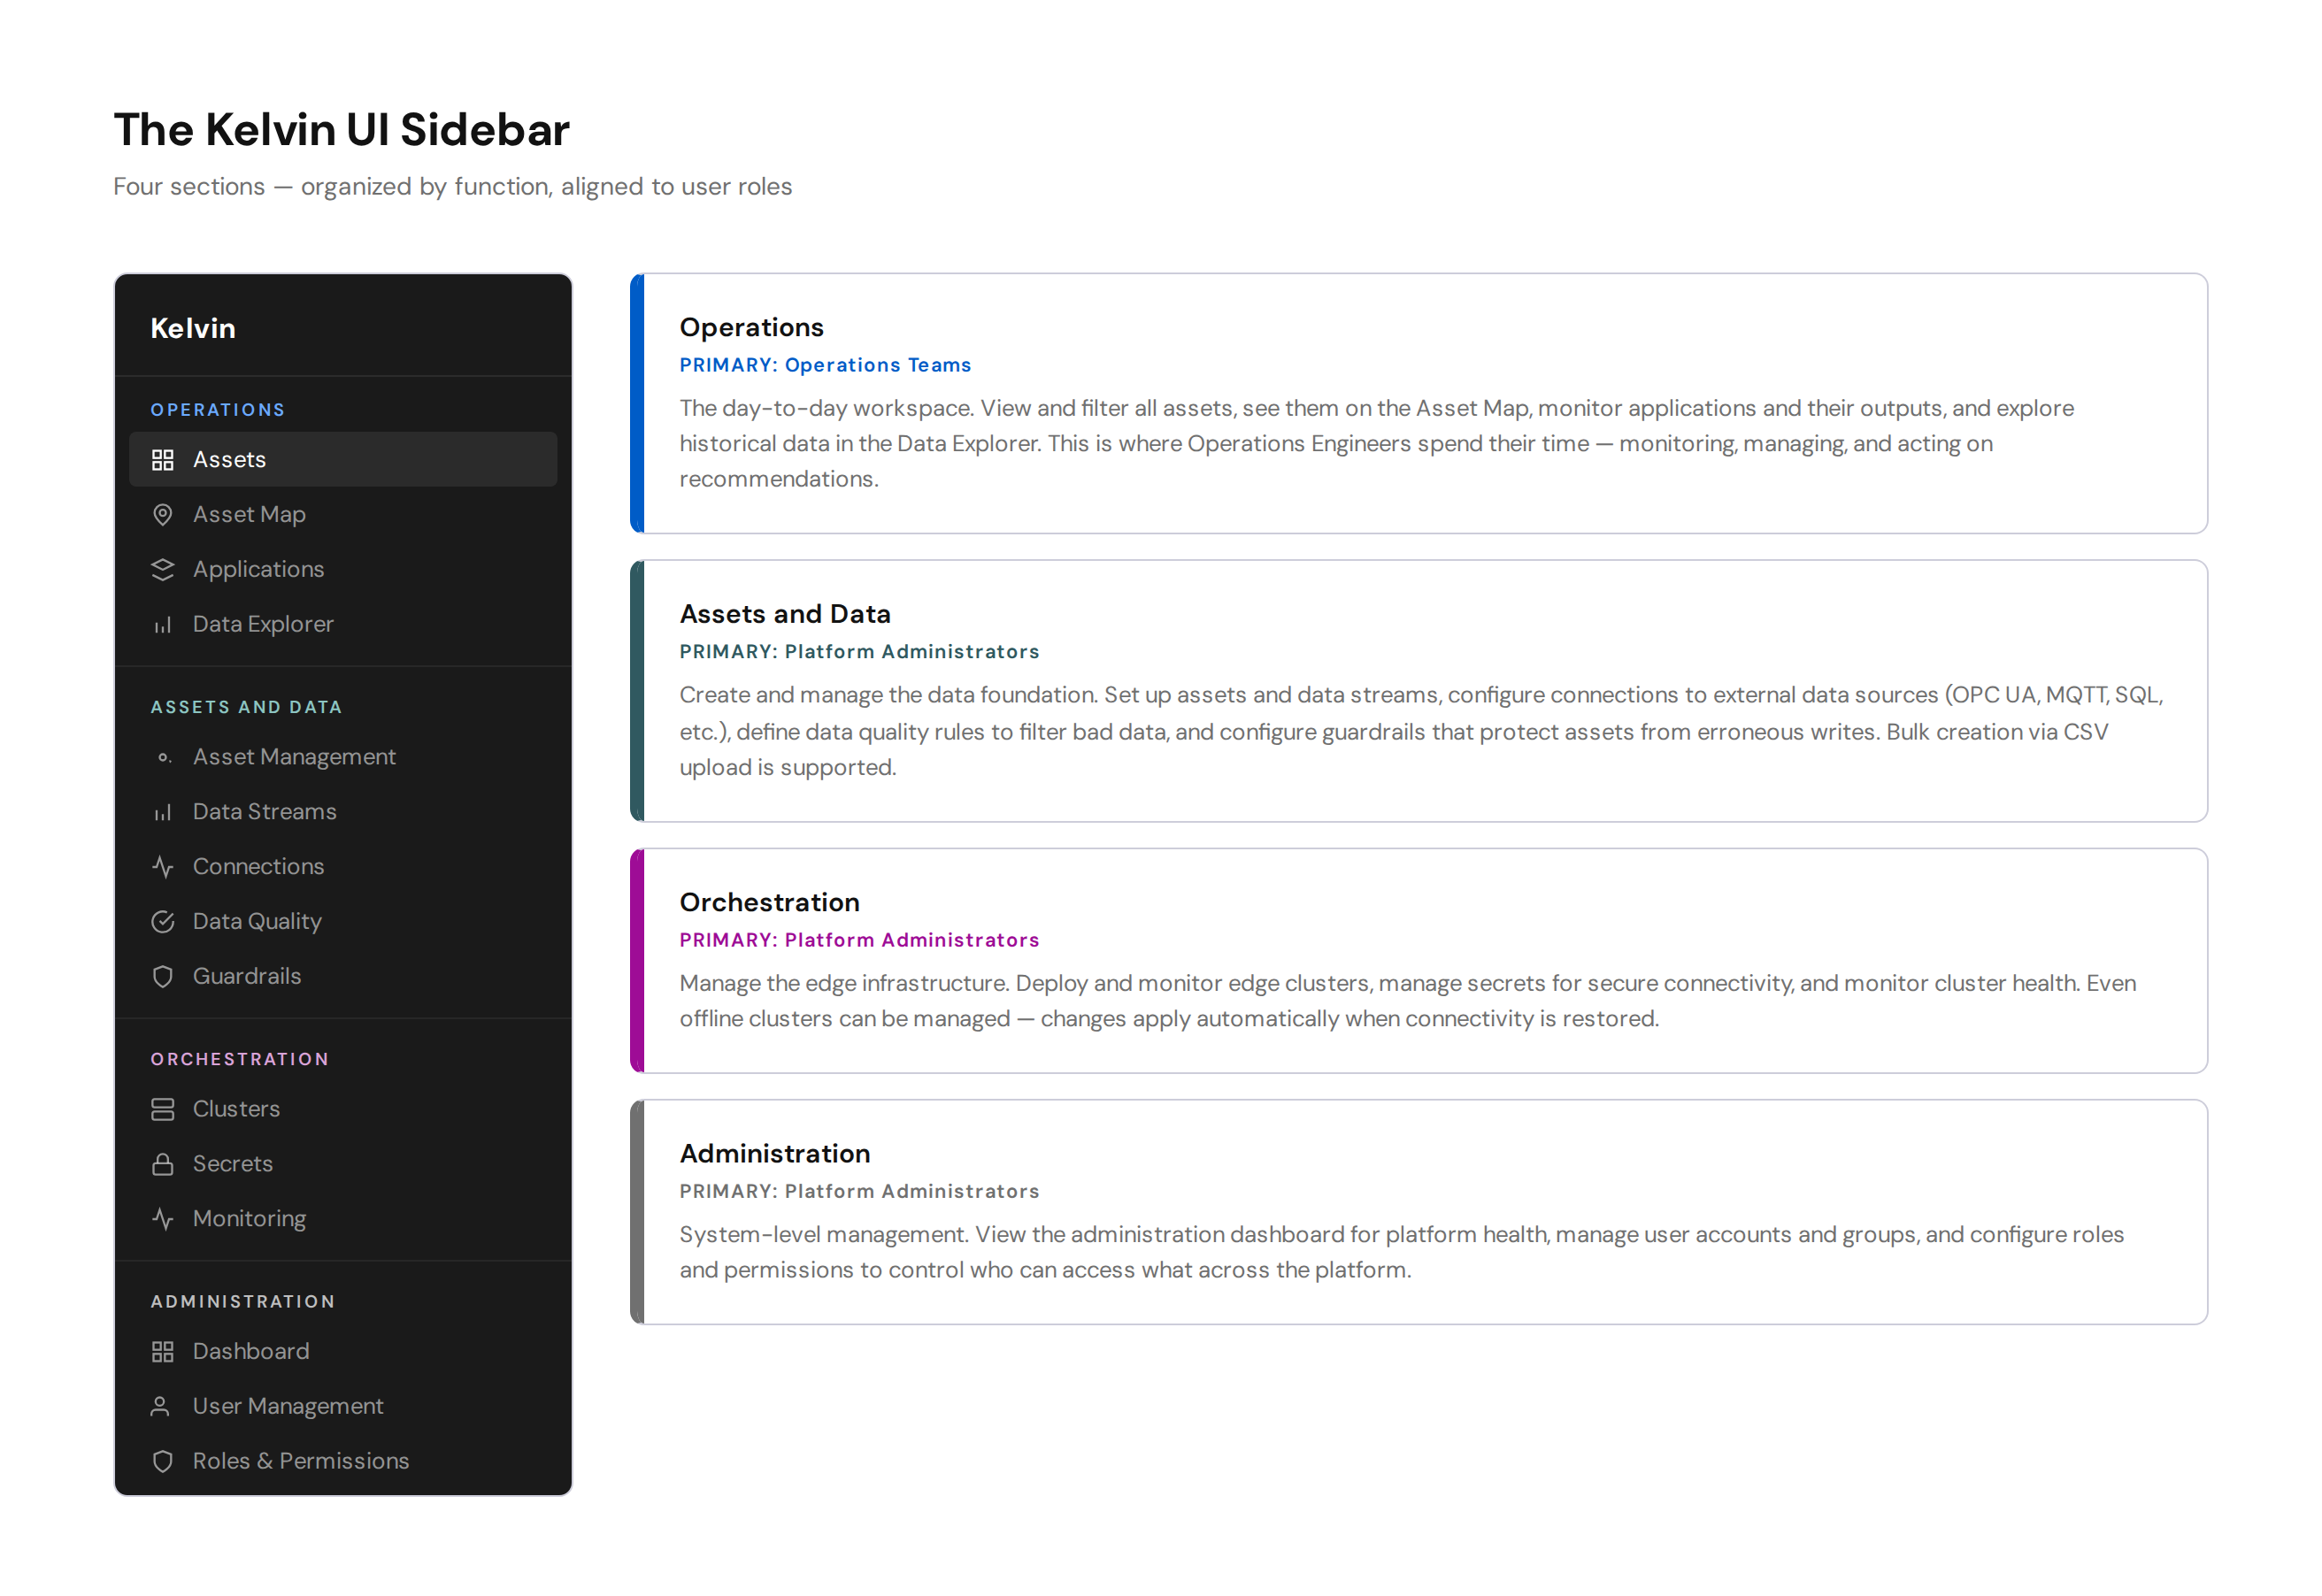
The Kelvin UI Sidebar
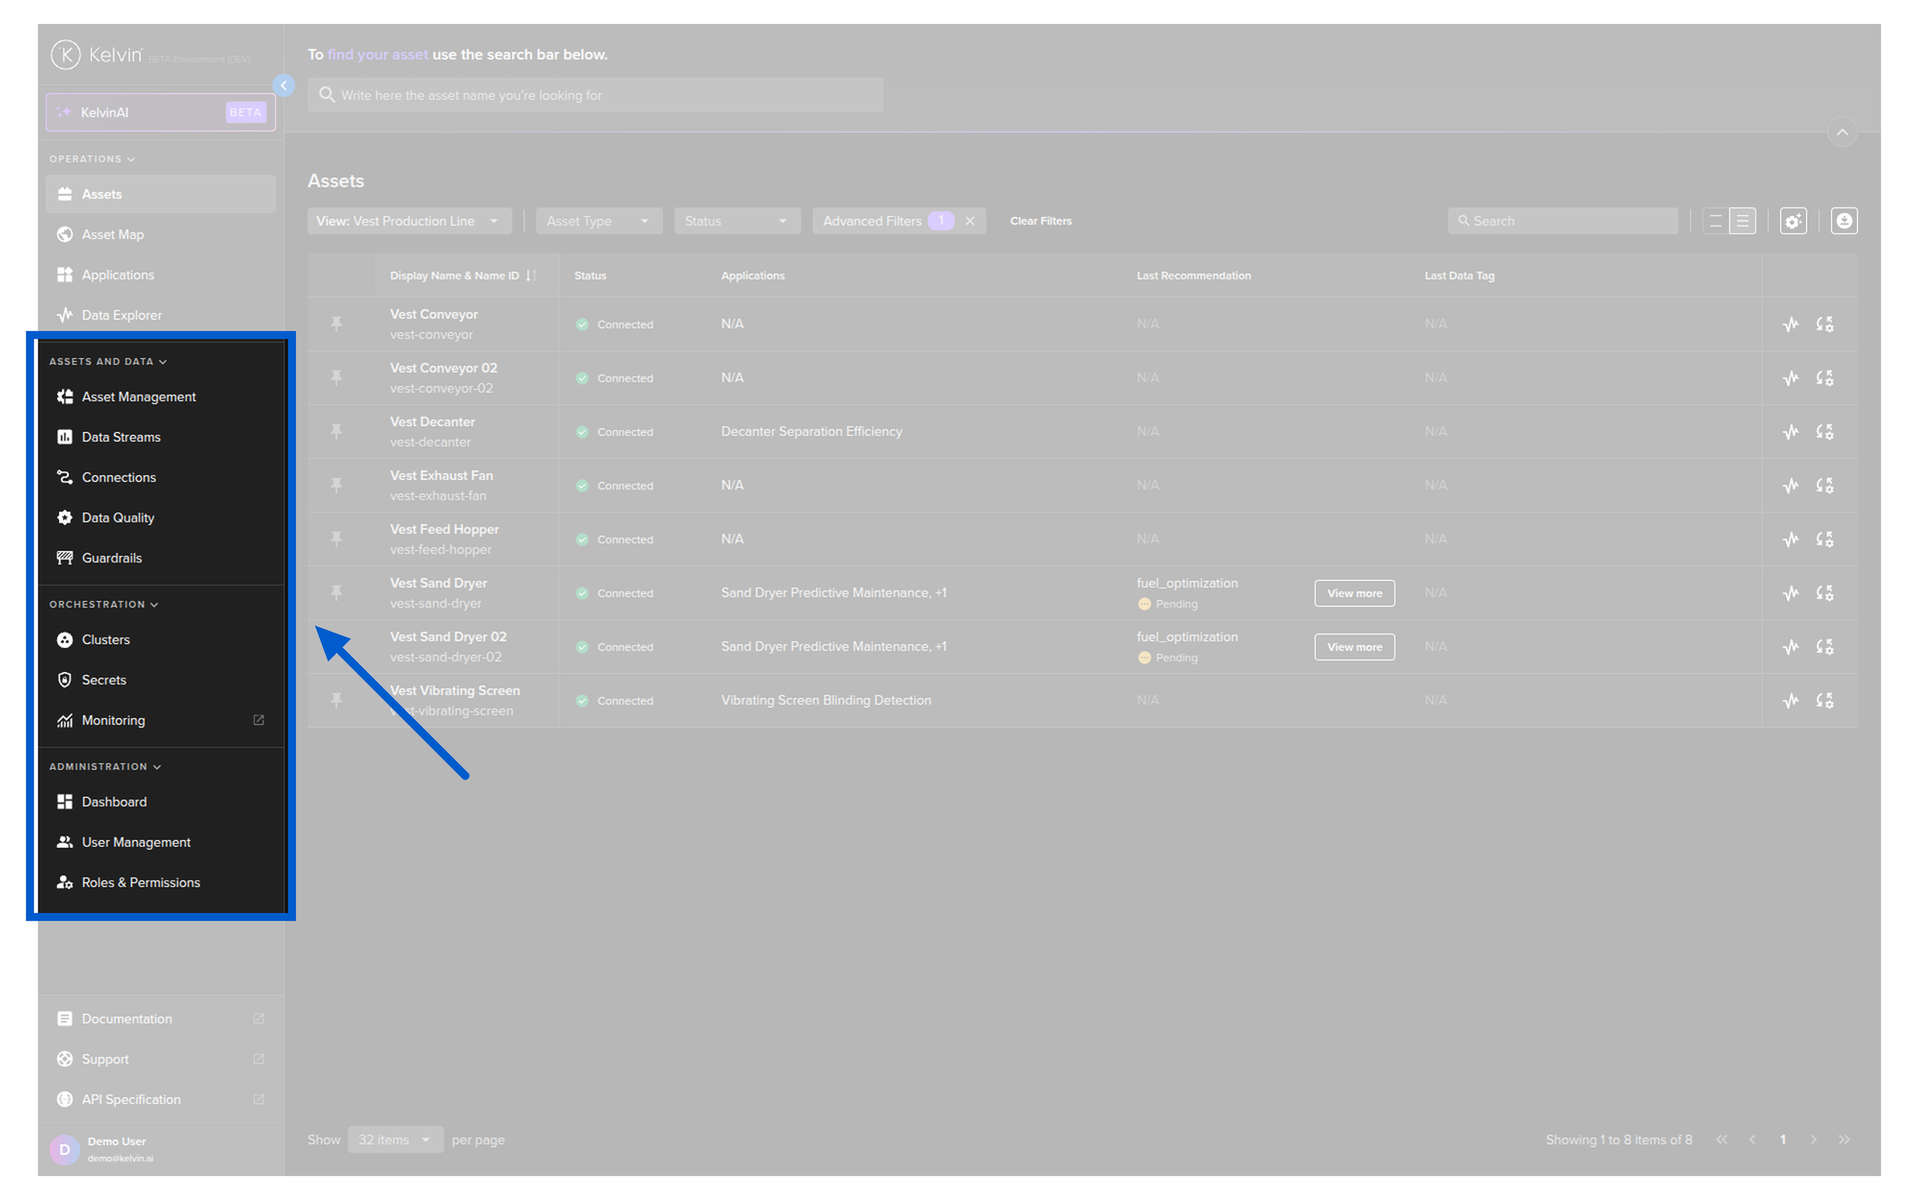
The Kelvin UI is organized through a left-hand sidebar menu. The sidebar is divided into four sections, each focused on a distinct area of the platform.
| Sidebar Section | Purpose | Primary Audience |
|---|---|---|
| Operations | Monitor and control assets. View applications and their outputs. Explore historical data. | Operations Teams |
| Assets and Data | Create and manage assets, data streams, connections, data quality rules, and guardrails | Platform Administrators |
| Orchestration | Manage edge clusters, secrets, and infrastructure monitoring | Platform Administrators |
| Administration | System dashboard, user management, and roles and permissions | Platform Administrators |
What's Next?
Now that you understand how the Kelvin UI fits into the picture for each user role, you can jump into the detailed course for your role in the Intermediate Courses.
Good luck and Happy Learning !