Download Timeseries
Available Guides
- Download Raw Timeseries Data
- Download Raw Timeseries Data to CSV file
- Download Aggregated Timeseries Data
Reference:
| Field | Description |
|---|---|
| resource | Asset / Data Stream pair in KRN format. The KRN format is krn:ad:<asset_name>/<data_stream_name> |
| payload | The data value |
| timestamp | Exact UTC time when the data value was recorded, formatted in ISO 8601. |
| data_type | Type of data stored, such as number, string, or boolean. |
| source | User, Workload or Application that created the data in the Cloud |
| fields | The field name keys for the data saved. By default this is just value |
| created | UTC time when the data was created, formatted in ISO 8601. |
| updated | UTC time when any of the data information was updated, formatted in ISO 8601. |
Download Raw Timeseries Data
You can only download the timeseries data in a CSV file. See the next section below on how to do that.
You will receive a response body with a status code of 200, indicating a successful operation.
For example, the response body might look like this:
We will convert the information into a Pandas DataFrame.
The response will look something like this;
Download Raw Timeseries Data to CSV file
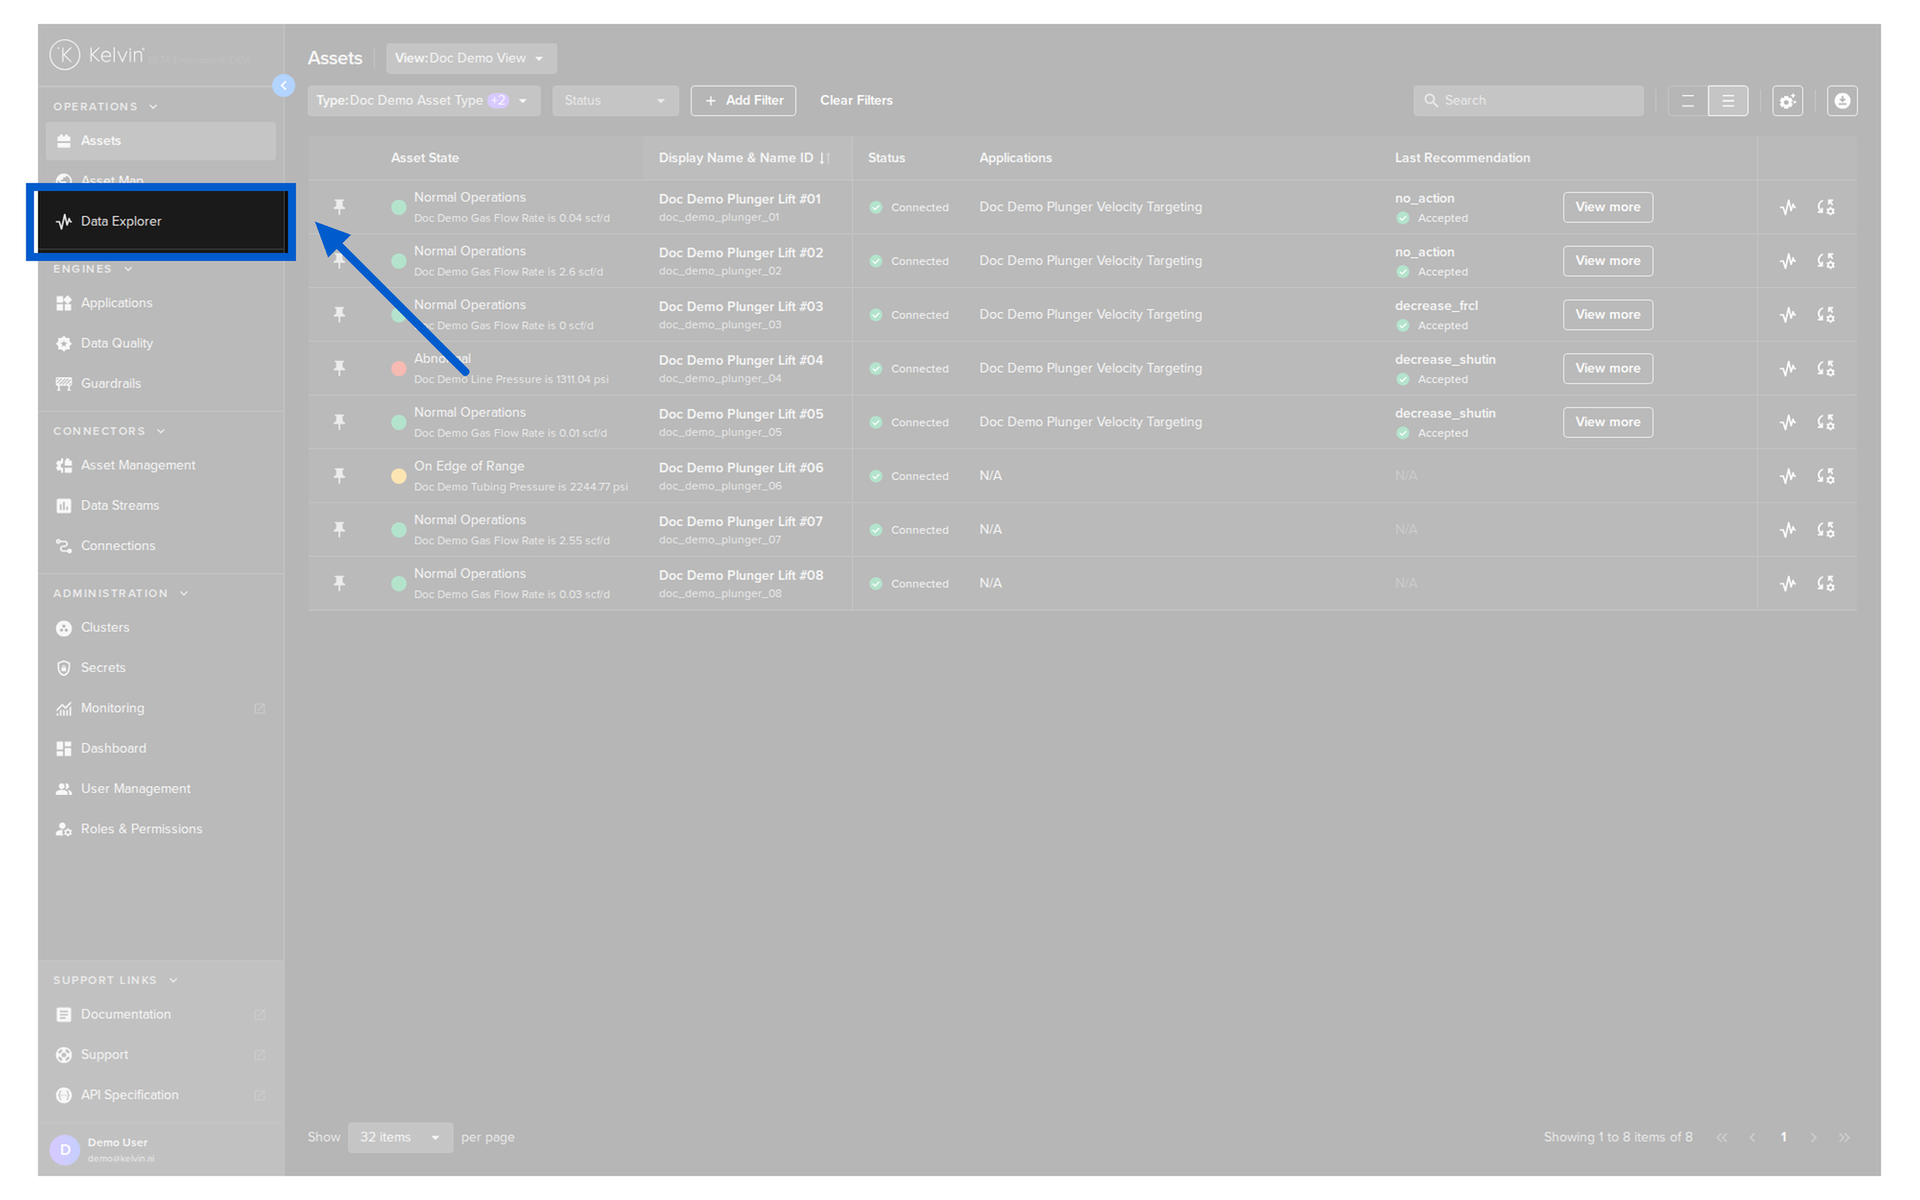
You can download a range of data from the Data Explorer page.
To do this go to the Data Explorer page.
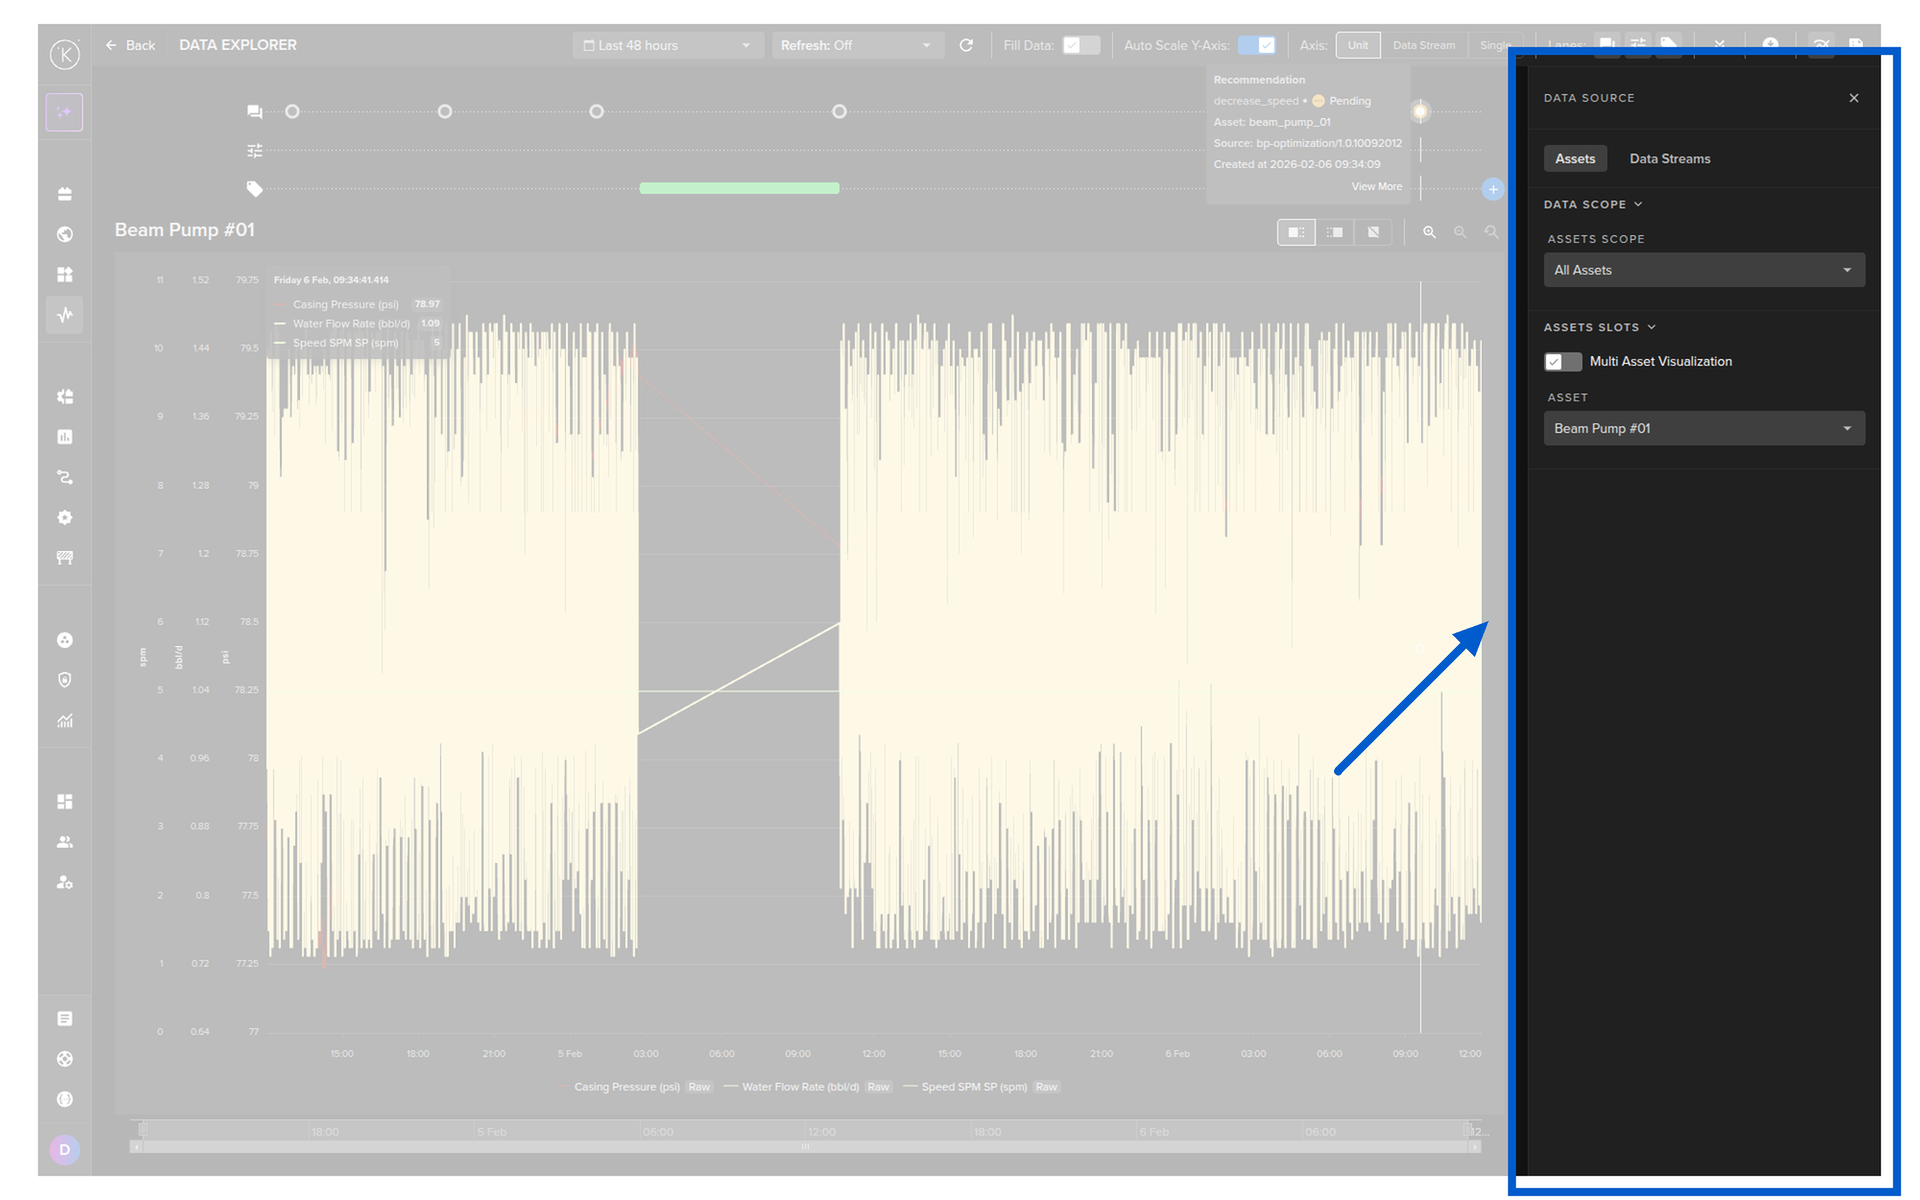
Select the Asset.
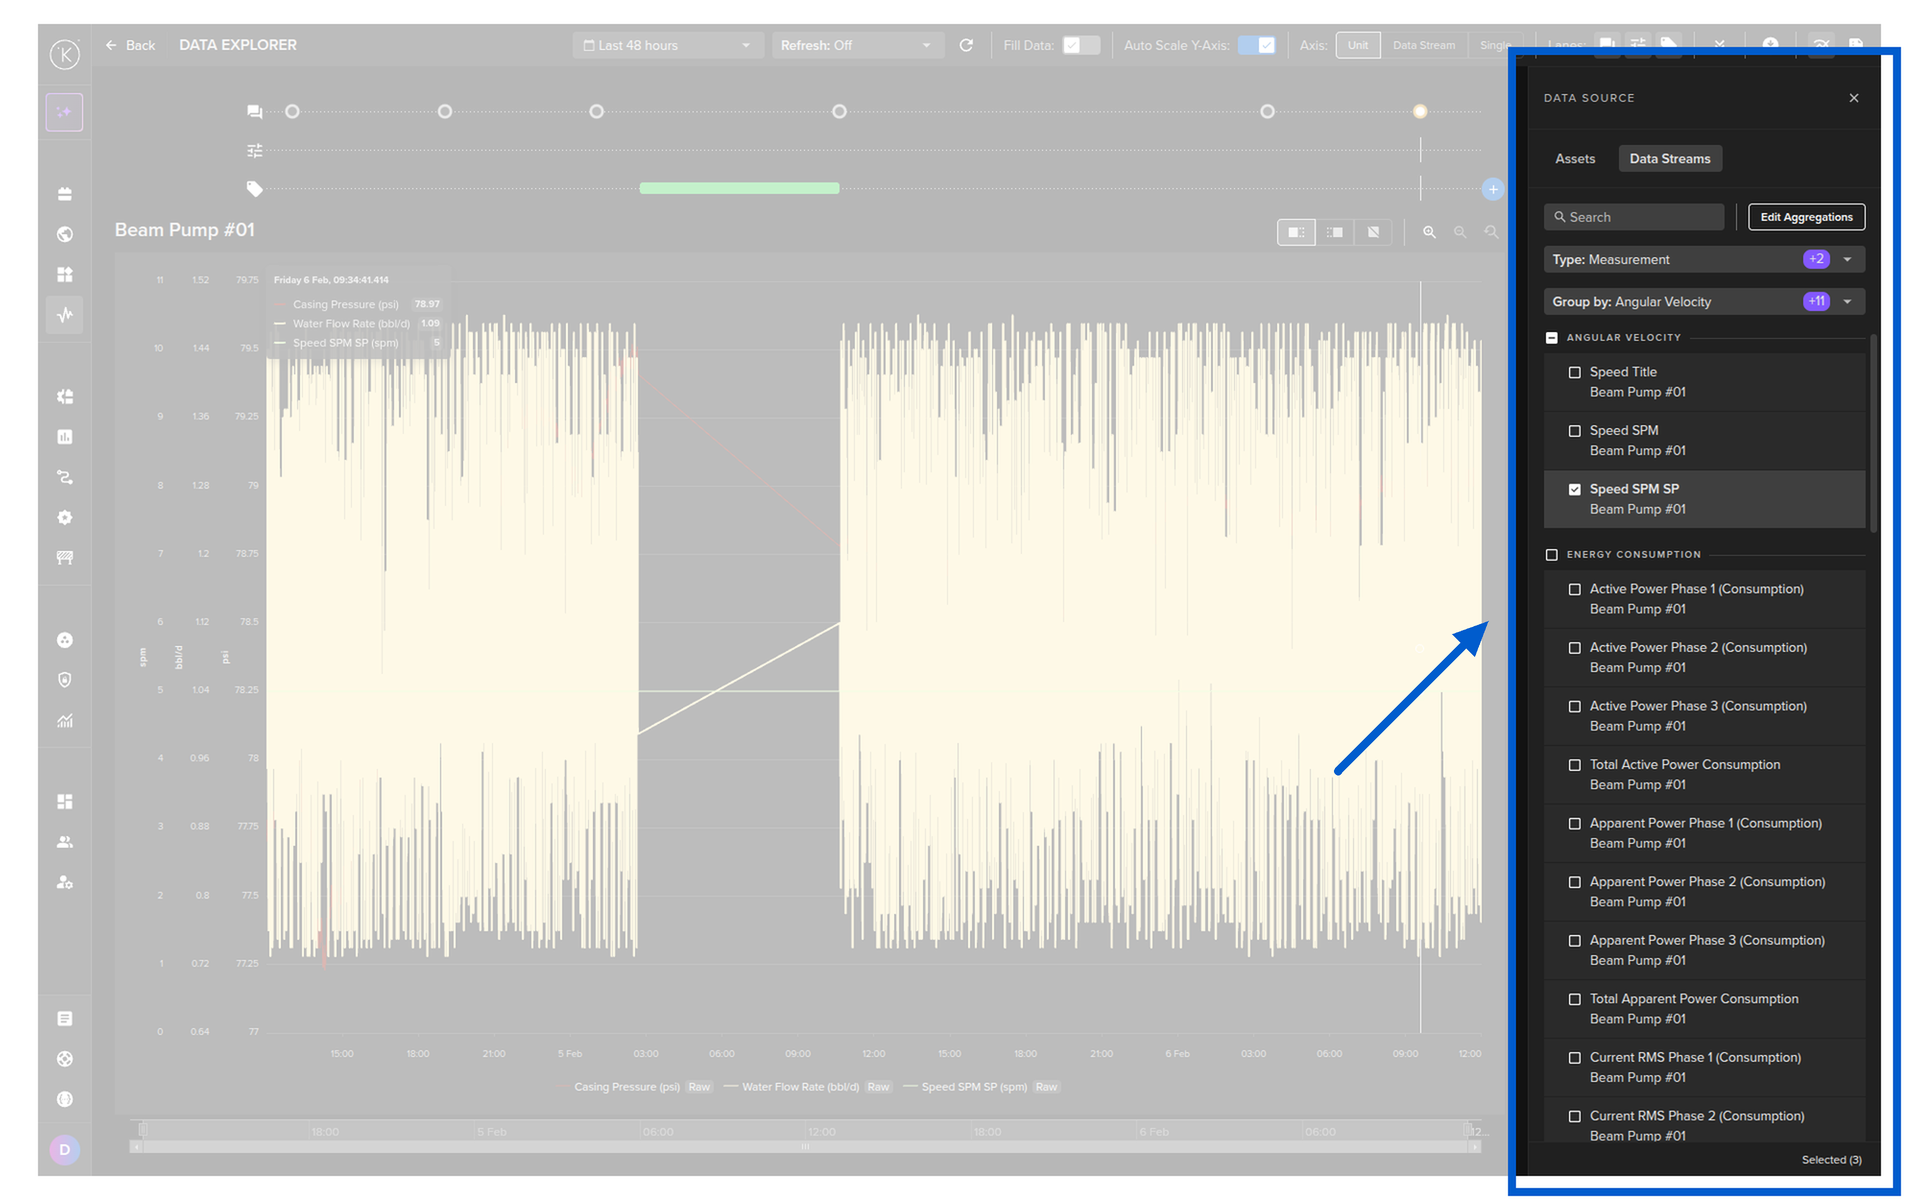
Select one or more Data Streams that you want to download.
Note
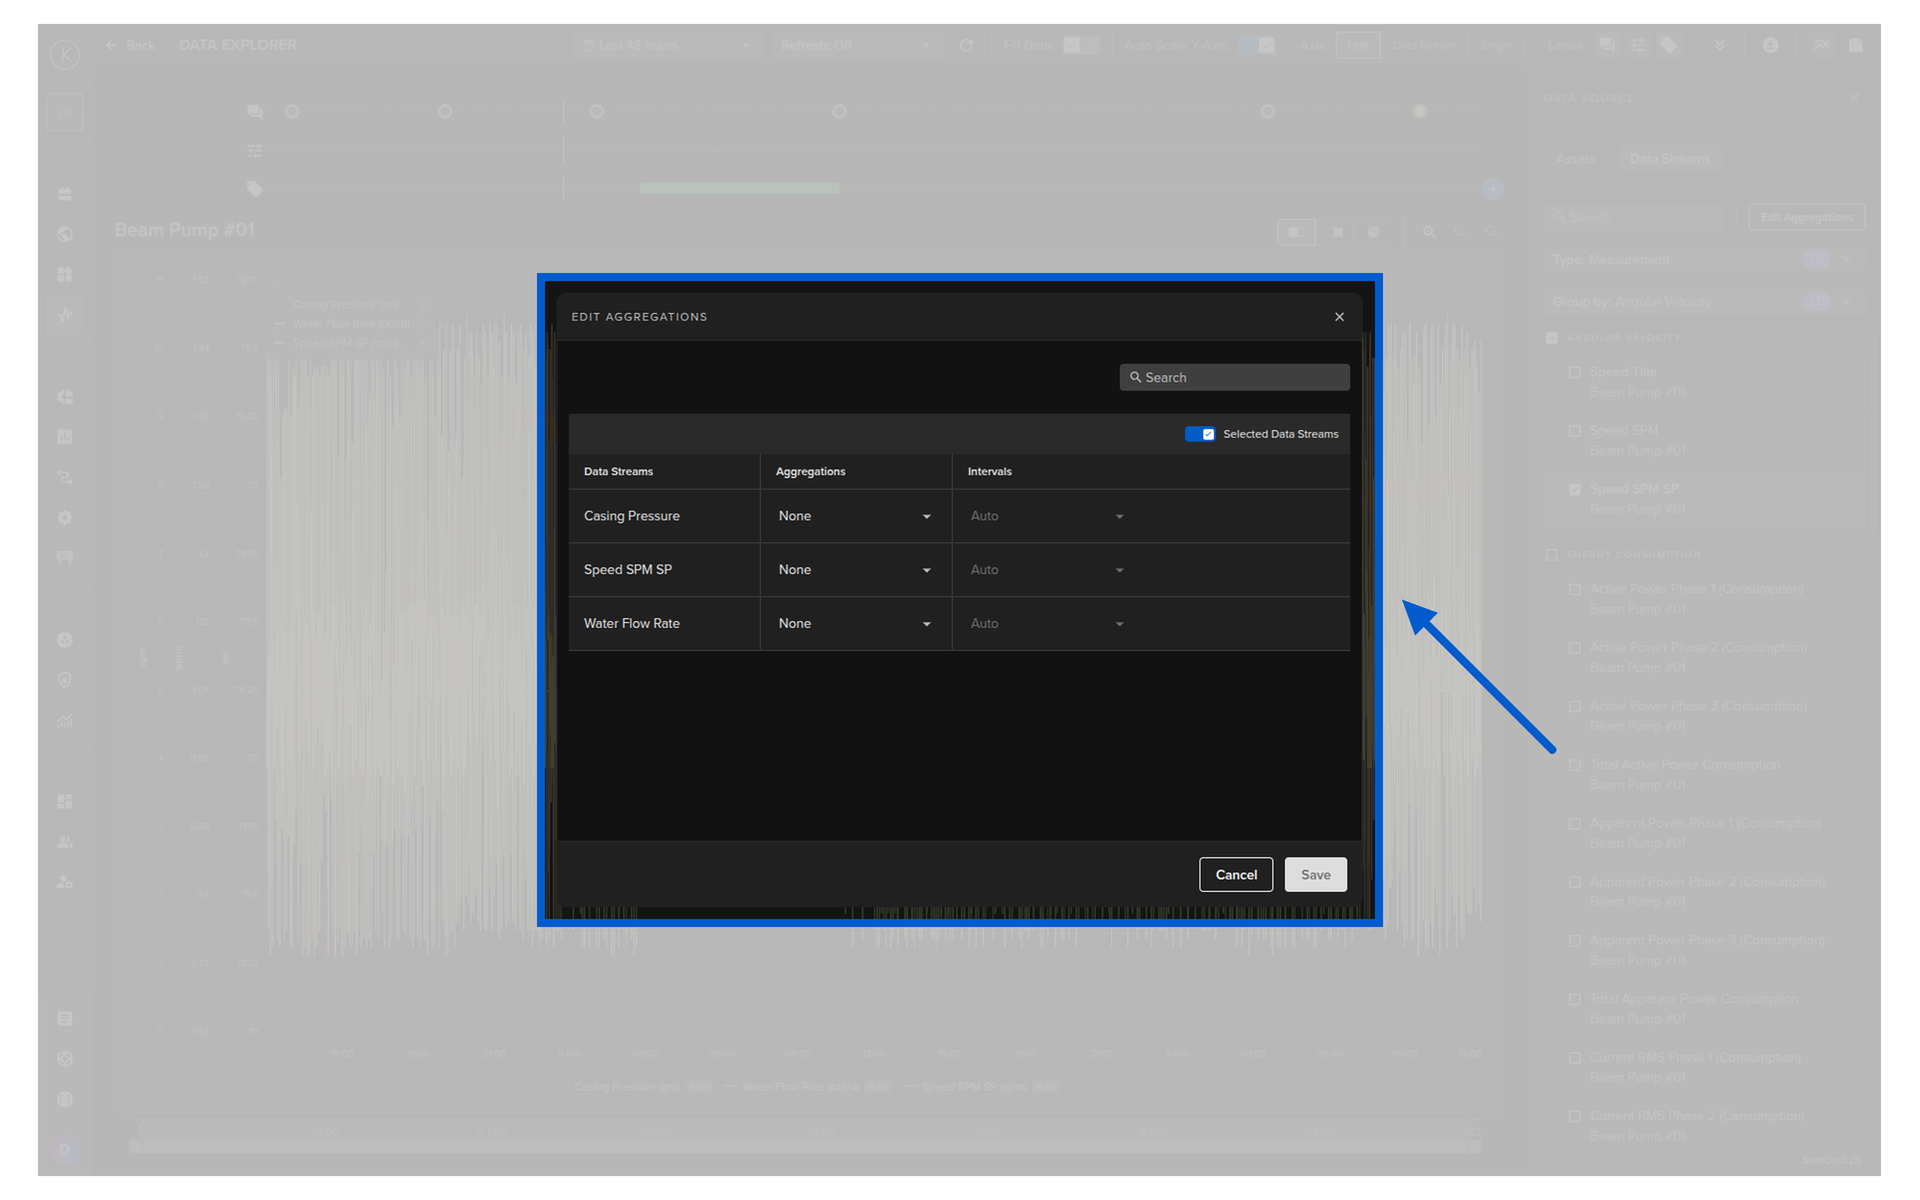
You have the ability to also aggregate data on the Data Explorer before downloading.
To aggregate, click on the Edit Aggregation button and select the aggregation for the target Data Stream.
Aggregations options; Average, Count, Maximum, Minimum, or Sum over a selected intervals.
Warning
The system will make every effort to follow the aggregations selected.
Only under extreme conditions, such as selecting minute intervals over a two-day range, the system may automatically adjust the interval to prevent large data updates that could freeze the browser.
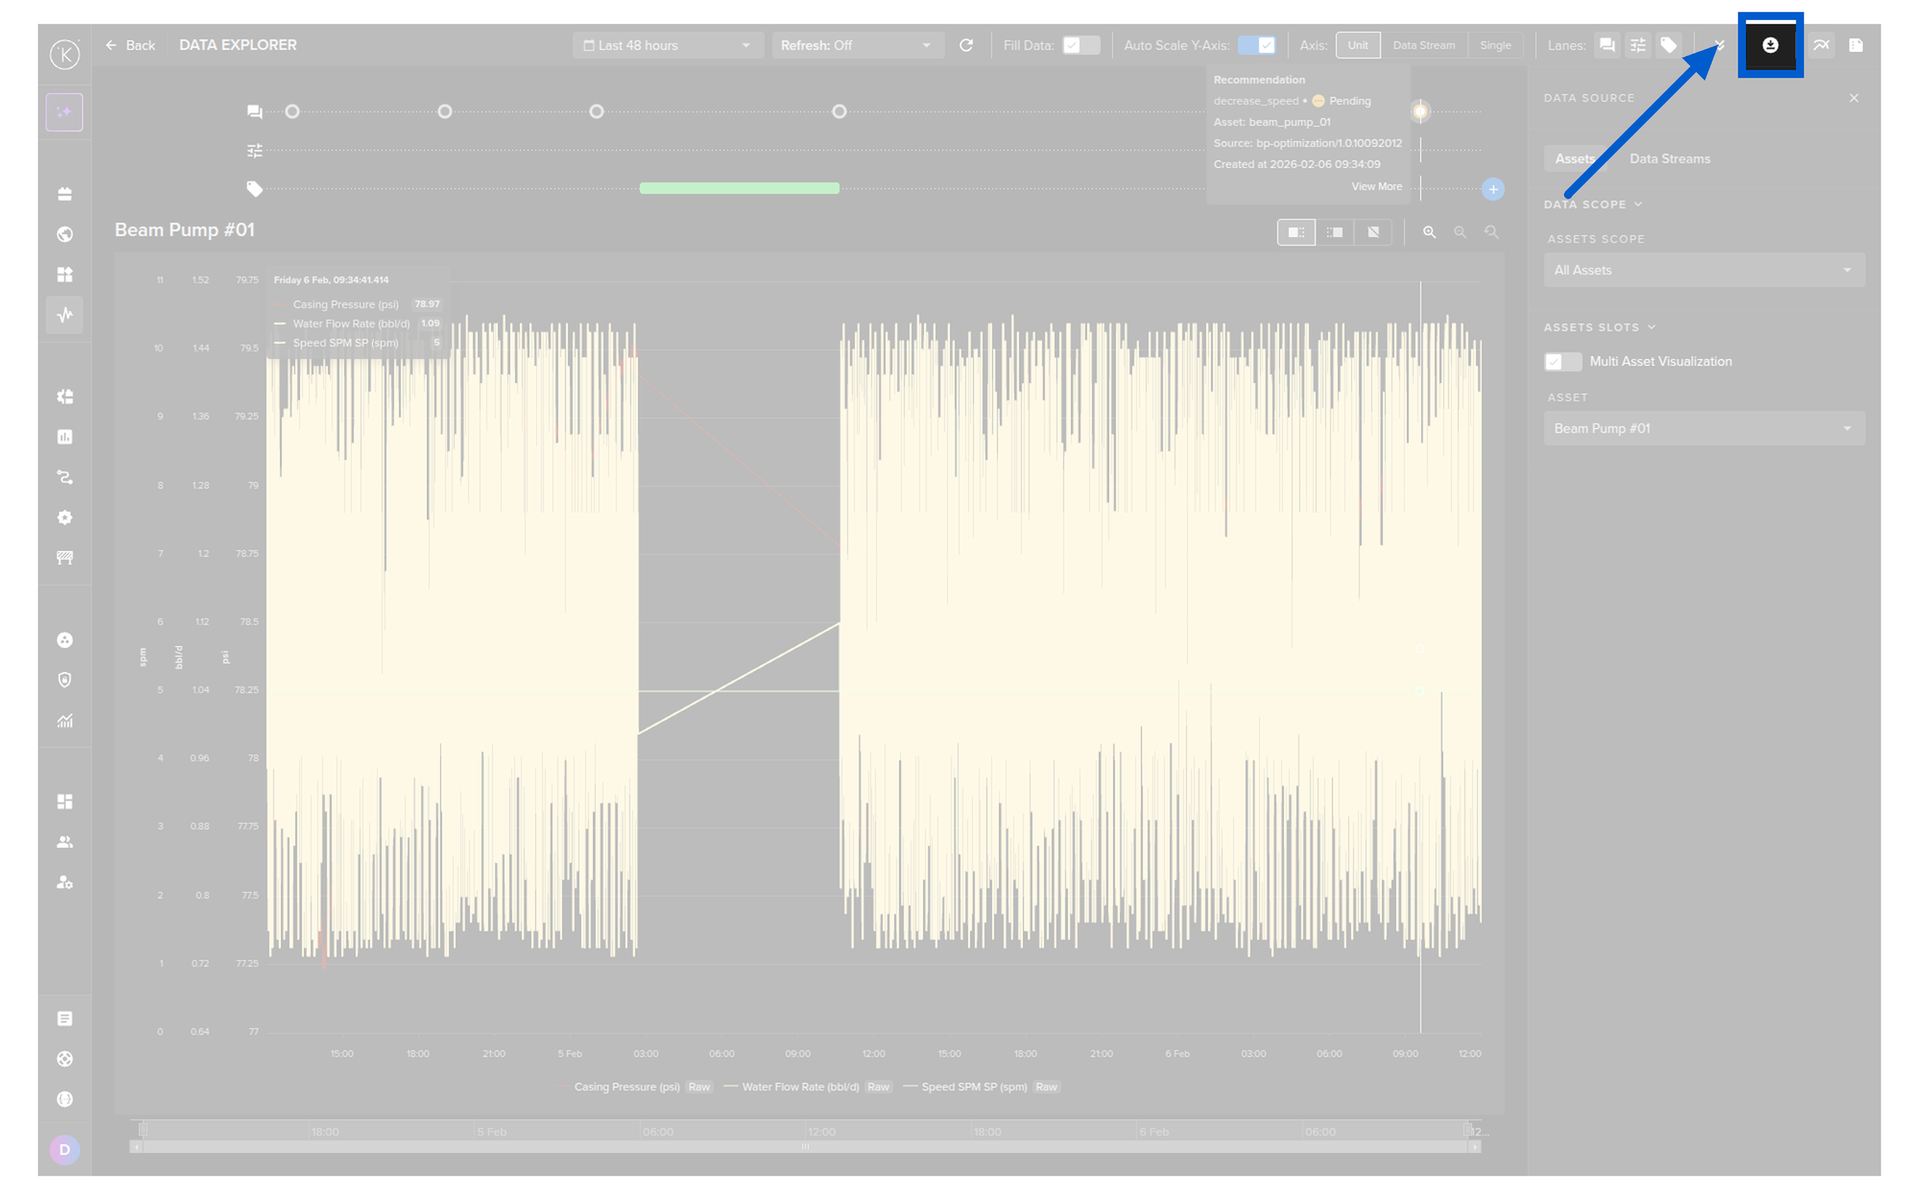
Choose a time period.
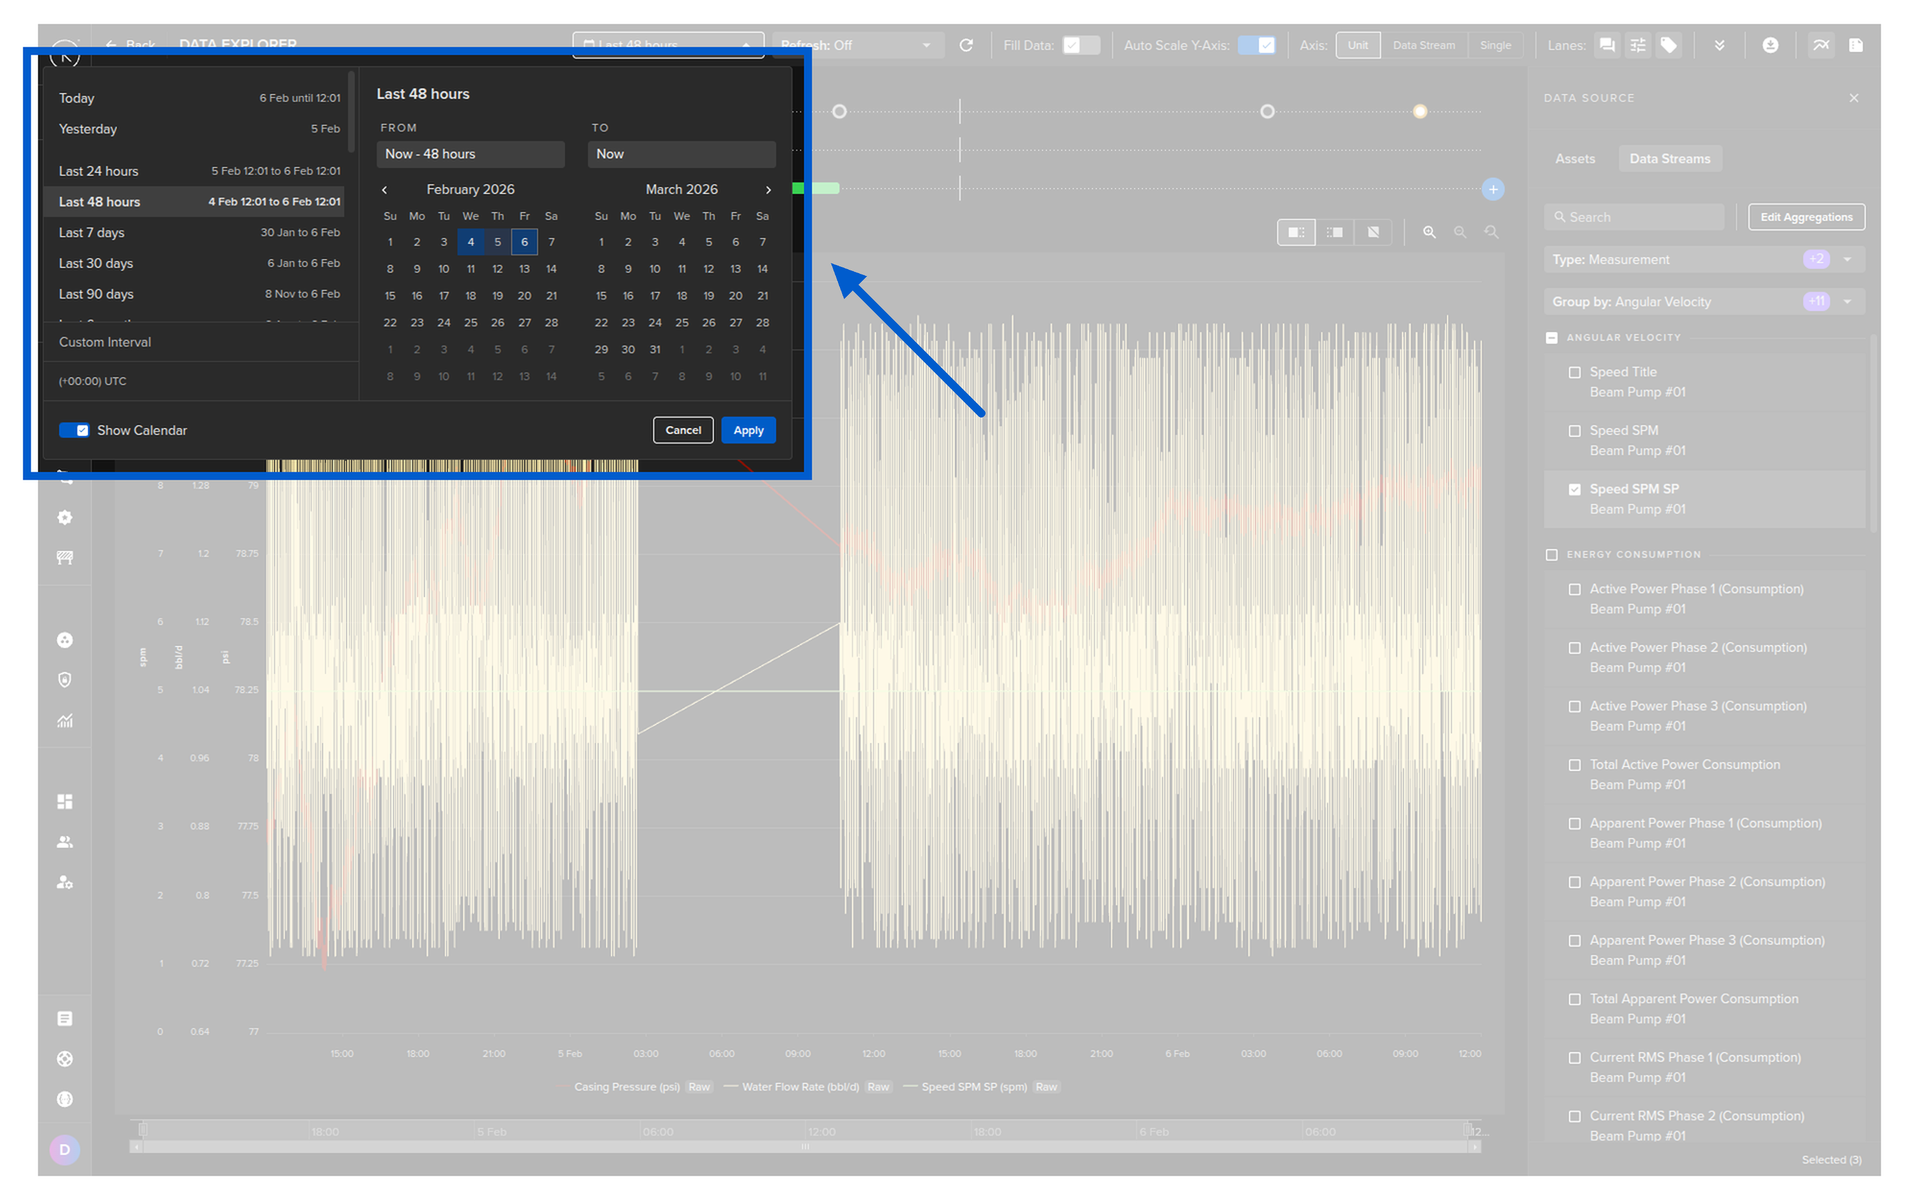
Then click on the download button.
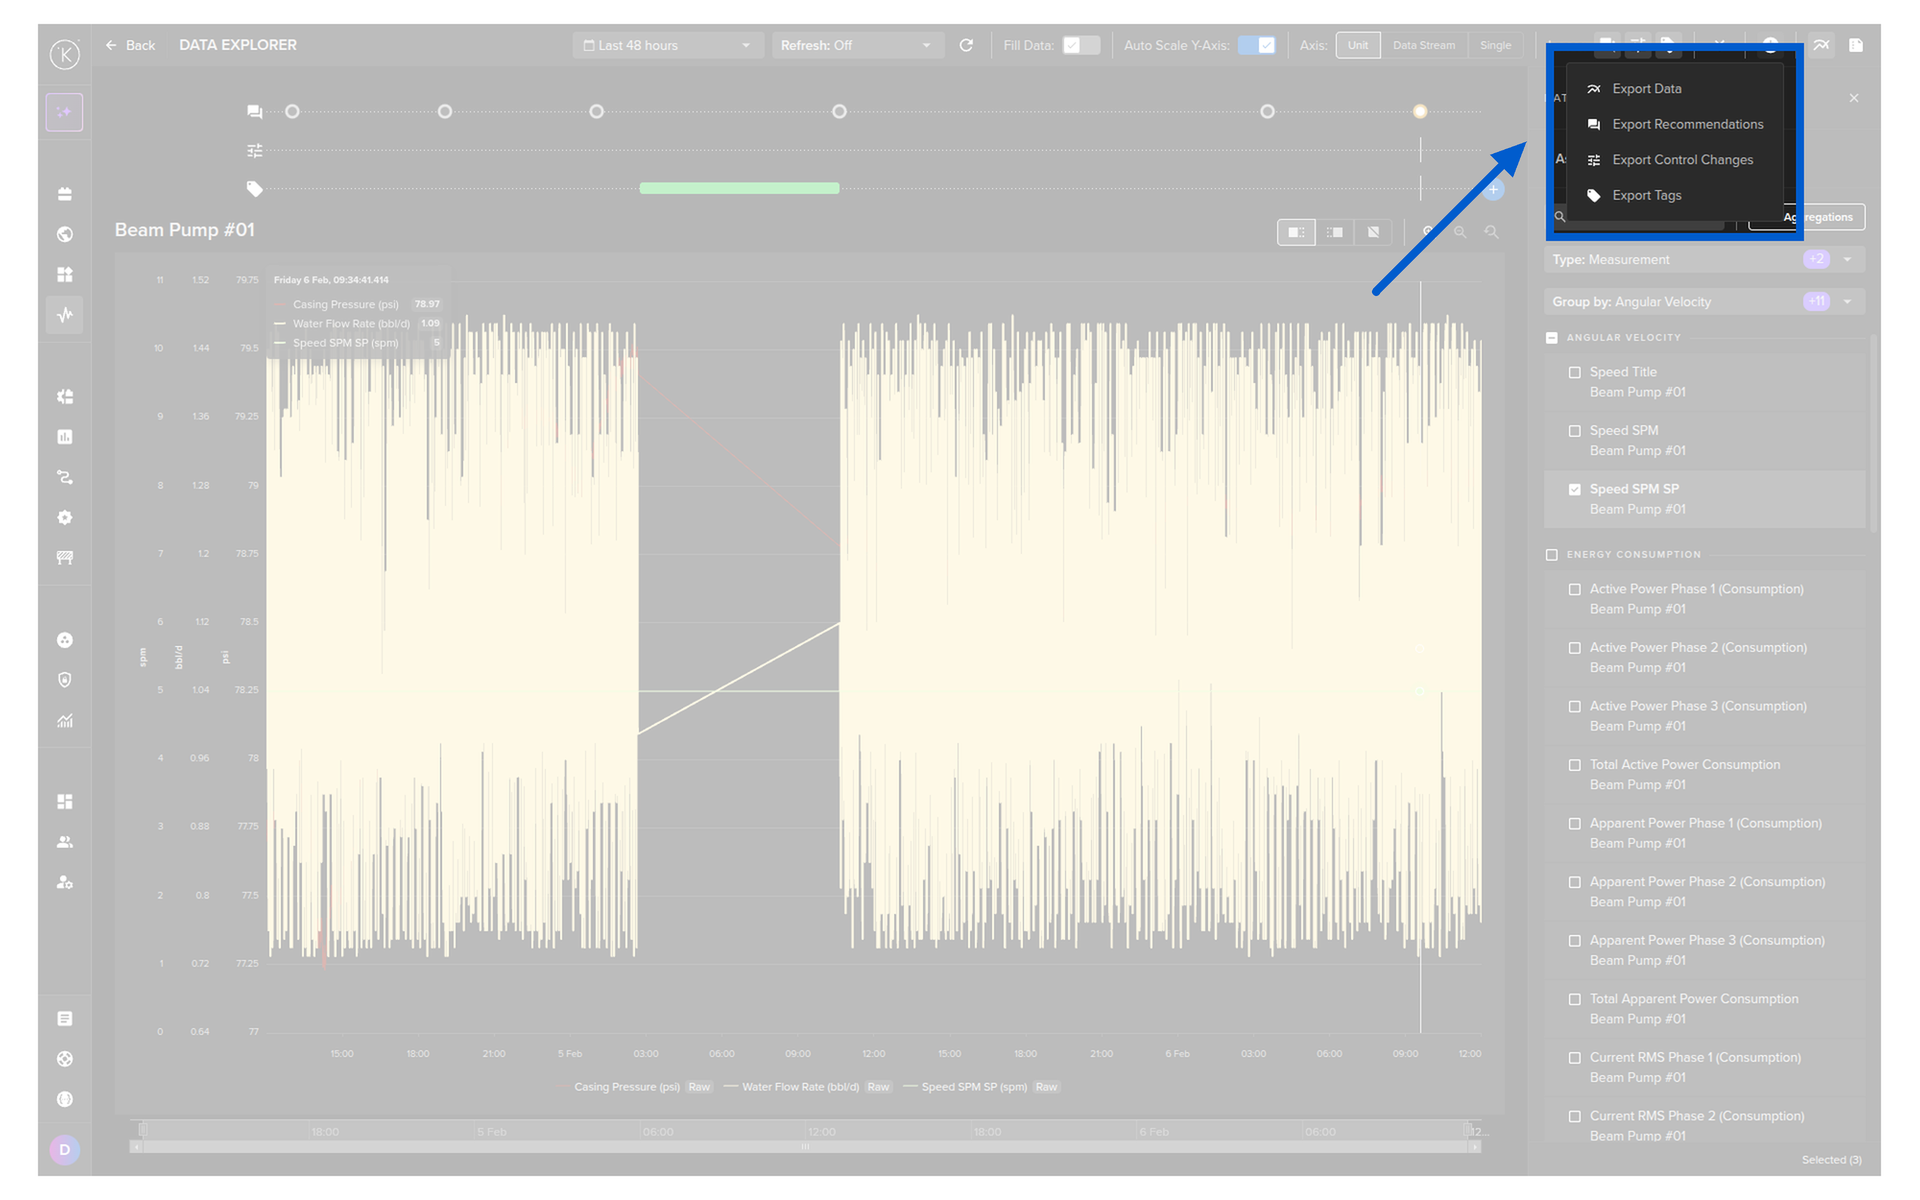
Select the Export Data option.
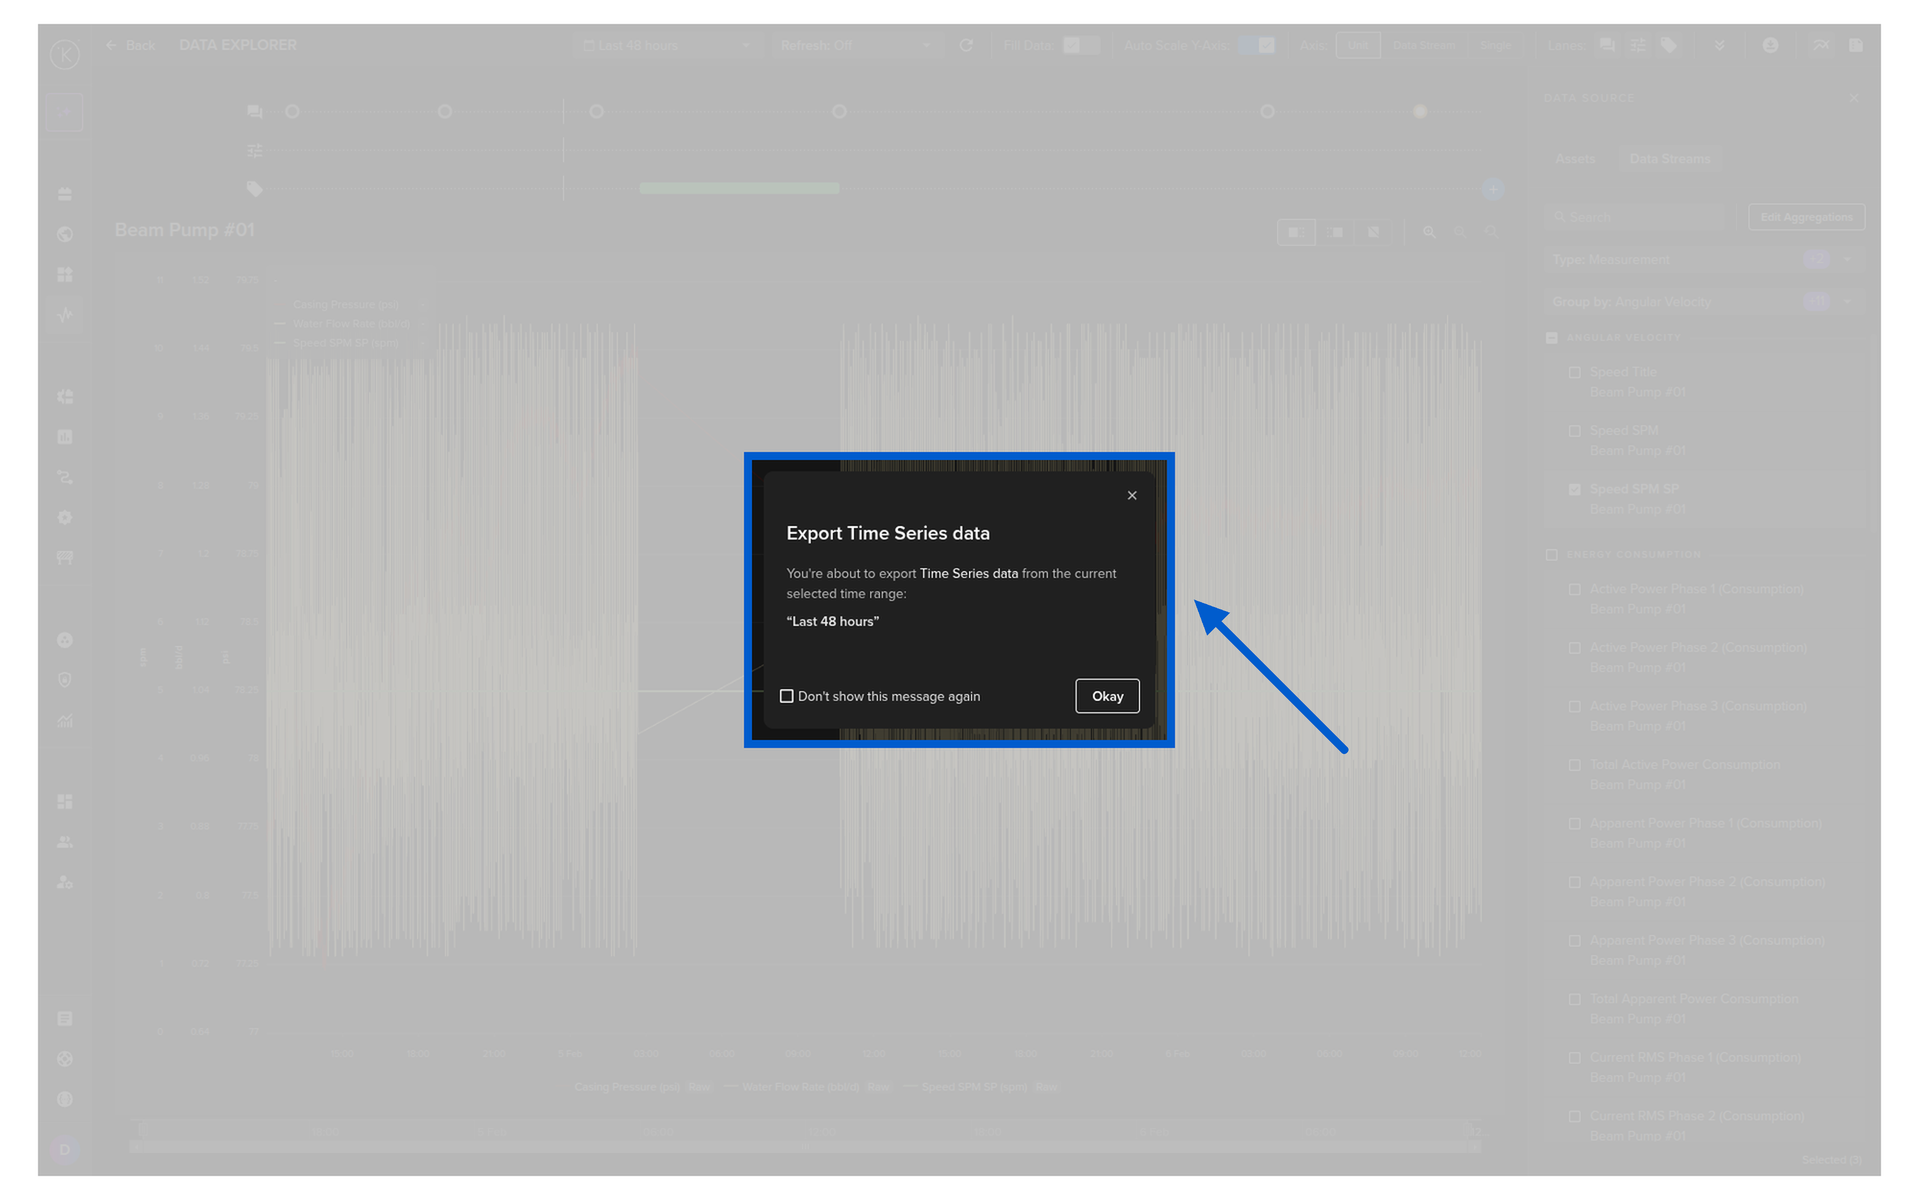
And finally confirm the download by clicking on the Okay button.
The data.csv file will look something like this;
We will save the information into a CSV file.
The data.csv file will look something like this;
Download Aggregated Timeseries Data
In Time Series API, you can download a range of data either in a raw format or aggregated format. The type of aggregation possible depends on the Data Type for the Asset / Data Stream pair.
Available Aggregations:
| Data Type | Aggregate Option | Description |
|---|---|---|
| number | none | Raw data is returned |
| count | Counts the number of values within each time bucket. | |
| distinct | Returns distinct values within each time_bucket bucket. |
|
| integral | Calculates the area under the curve for each time_bucket bucket. |
|
| mean | Calculates the average value within each time bucket. | |
| median | Finds the middle value in each time bucket. | |
| mode | Identifies the most frequently occurring value in each time time_bucket. |
|
| spread | Represents the difference between the max and min values within each time time_bucket. |
|
| stddev | Measures variation within each time time_bucket. |
|
| sum | Adds up all the values within each time time_bucket. |
|
| string | none | Raw data is returned |
| count | Counts the number of values within each time_bucket bucket. |
|
| distinct | Returns distinct values within each time time_bucket. |
|
| mode | Identifies the most frequently occurring value in each time time_bucket. |
There are also the options to;
time_bucket: The window of data to aggregate, e.g. 5m, 1h (see https://golang.org/pkg/time/#ParseDuration for the acceptable formats)time_shift: The offset for each window.fill: allows you to fill missing points from a time bucket. It might be one of: none (default); null; linear (performs a linear regression); previous (uses the previous non-empty value); or an int.
In this example we will get the mean value per hour over a 24 hour period for an Asset / Data Stream pair. The Asset name is pcp_01 and the Data Stream name is casing_pressure.
You can download a range of data from the Data Explorer page.
To do this go to the Data Explorer page.
Select the Asset.
Select one or more Data Streams that you want to download.
Click on the Edit Aggregate button.
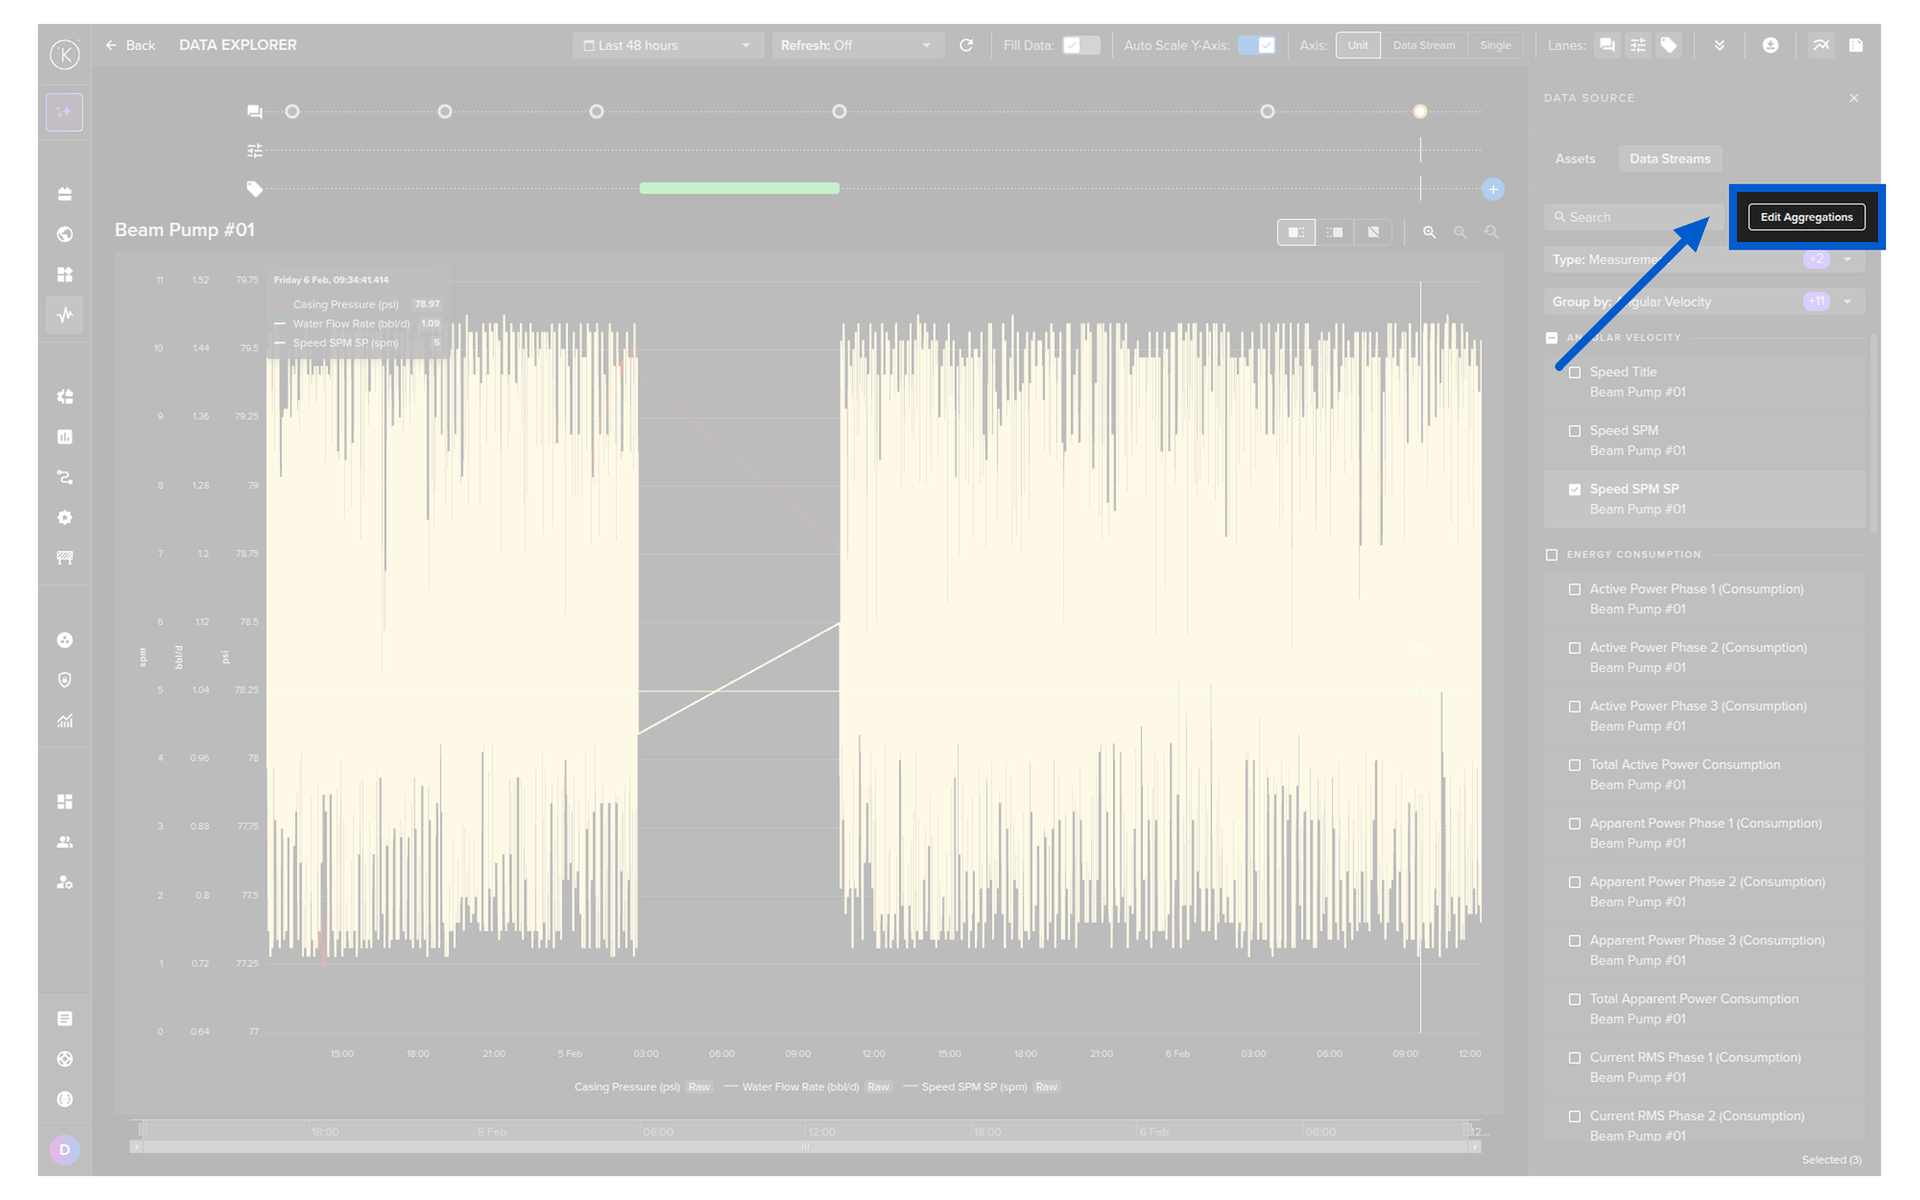
And then choose the type of aggregation you want for each Data Stream.
Warning
The system will make every effort to follow the aggregations selected.
Only under extreme conditions, such as selecting minute intervals over a two-day range, the system may automatically adjust the interval to prevent large data updates that could freeze the browser.
Note
If the aggregation option selected isNone, this means that the raw data will be used for the chart.
Check out the chapter on Raw Data View for more information about how raw data is displayed and when it is automatically aggregated.
This will affect the data exported to CSV.
Choose a time period.
Then click on the download button.
Select the Export Data option.
And finally confirm the download by clicking on the Okay button.
You will receive a response body with a status code of 200, indicating a successful operation.
For example, the response body might look like this:
We will convert the information into a Pandas DataFrame.
The response will look something like this;