Manual Controls Tab
On this page you will learn about monitoring live values and changing values of Data Streams related to the selected Asset in Manual Controls in Kelvin UI.
Manual Controls Tab
The Assets page is the first page you will see when you log into the Kelvin UI. You can also go there by clicking on the Asset option in the left sidebar.
Here you have a list of all Assets registered in Kelvin. From here you can see the Assets and associated information.
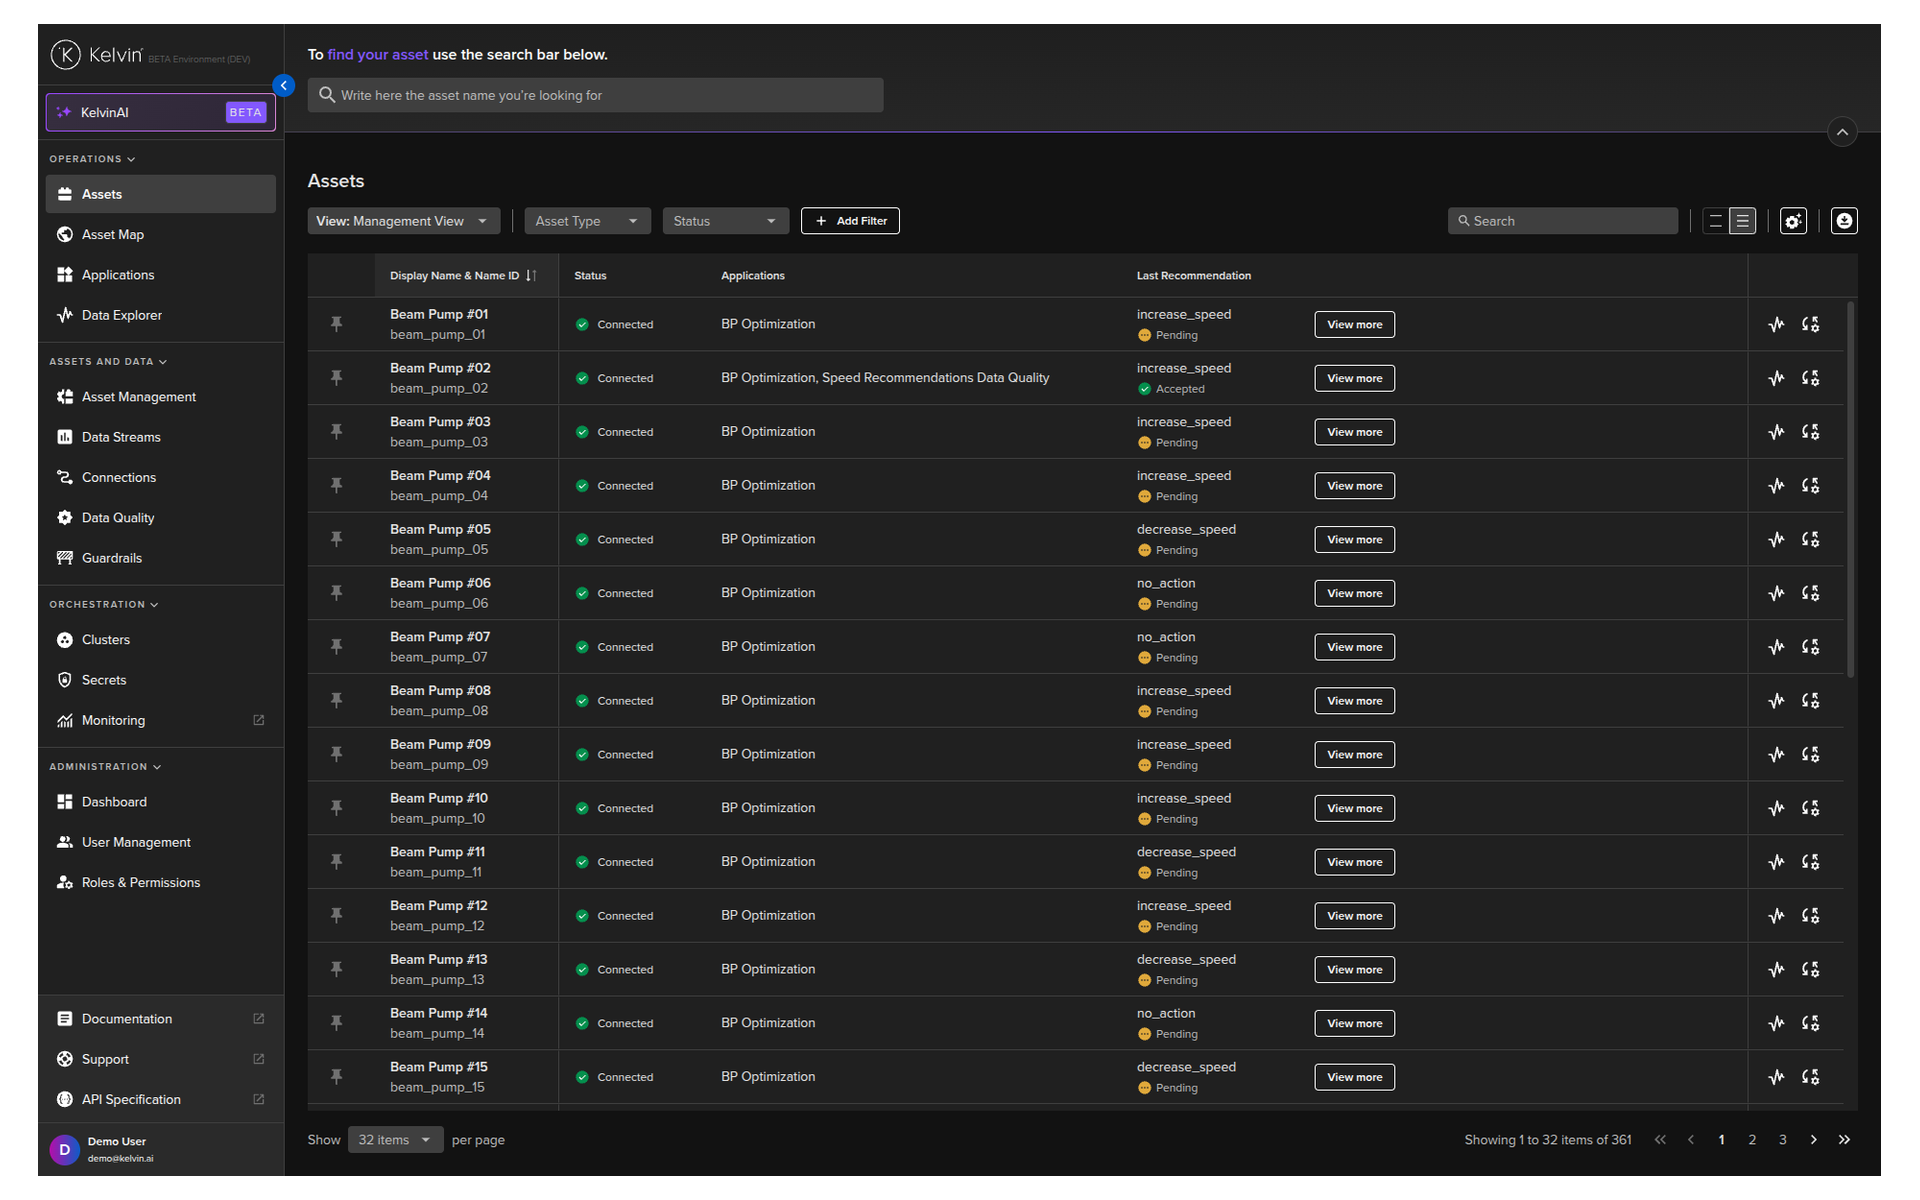
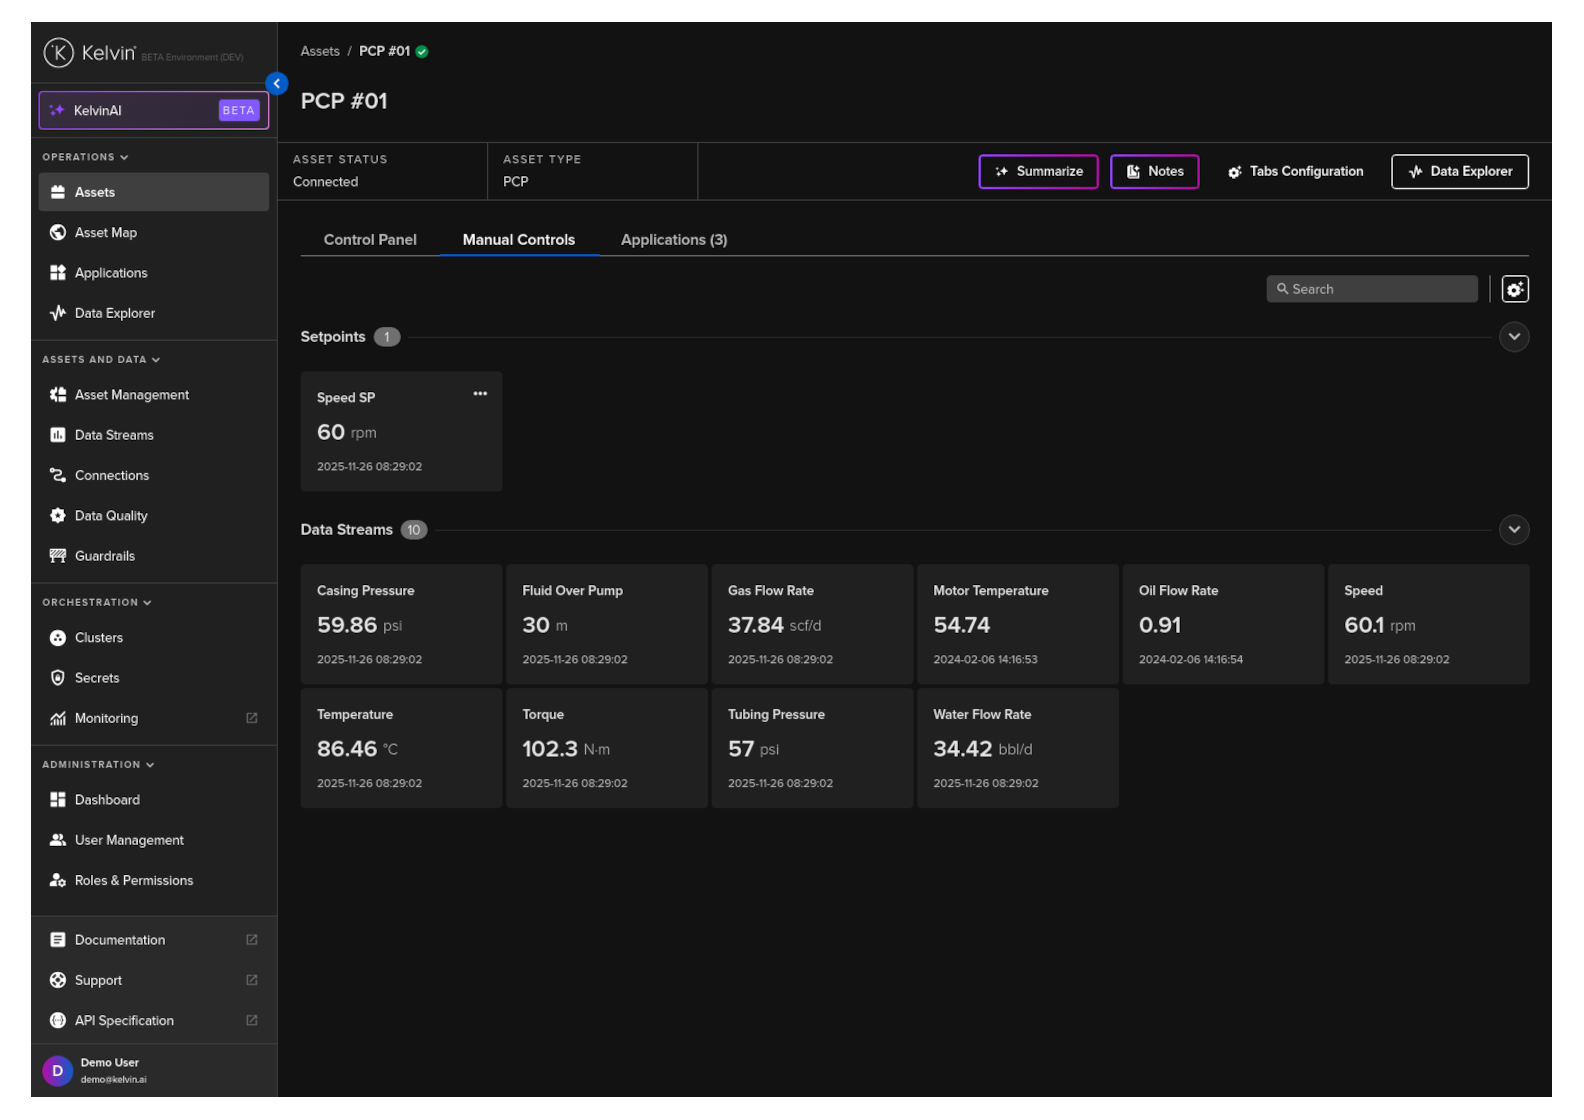
When you click on an Asset you will see a new page will all the details about the Asset.
Click on the Manual Controls tab.
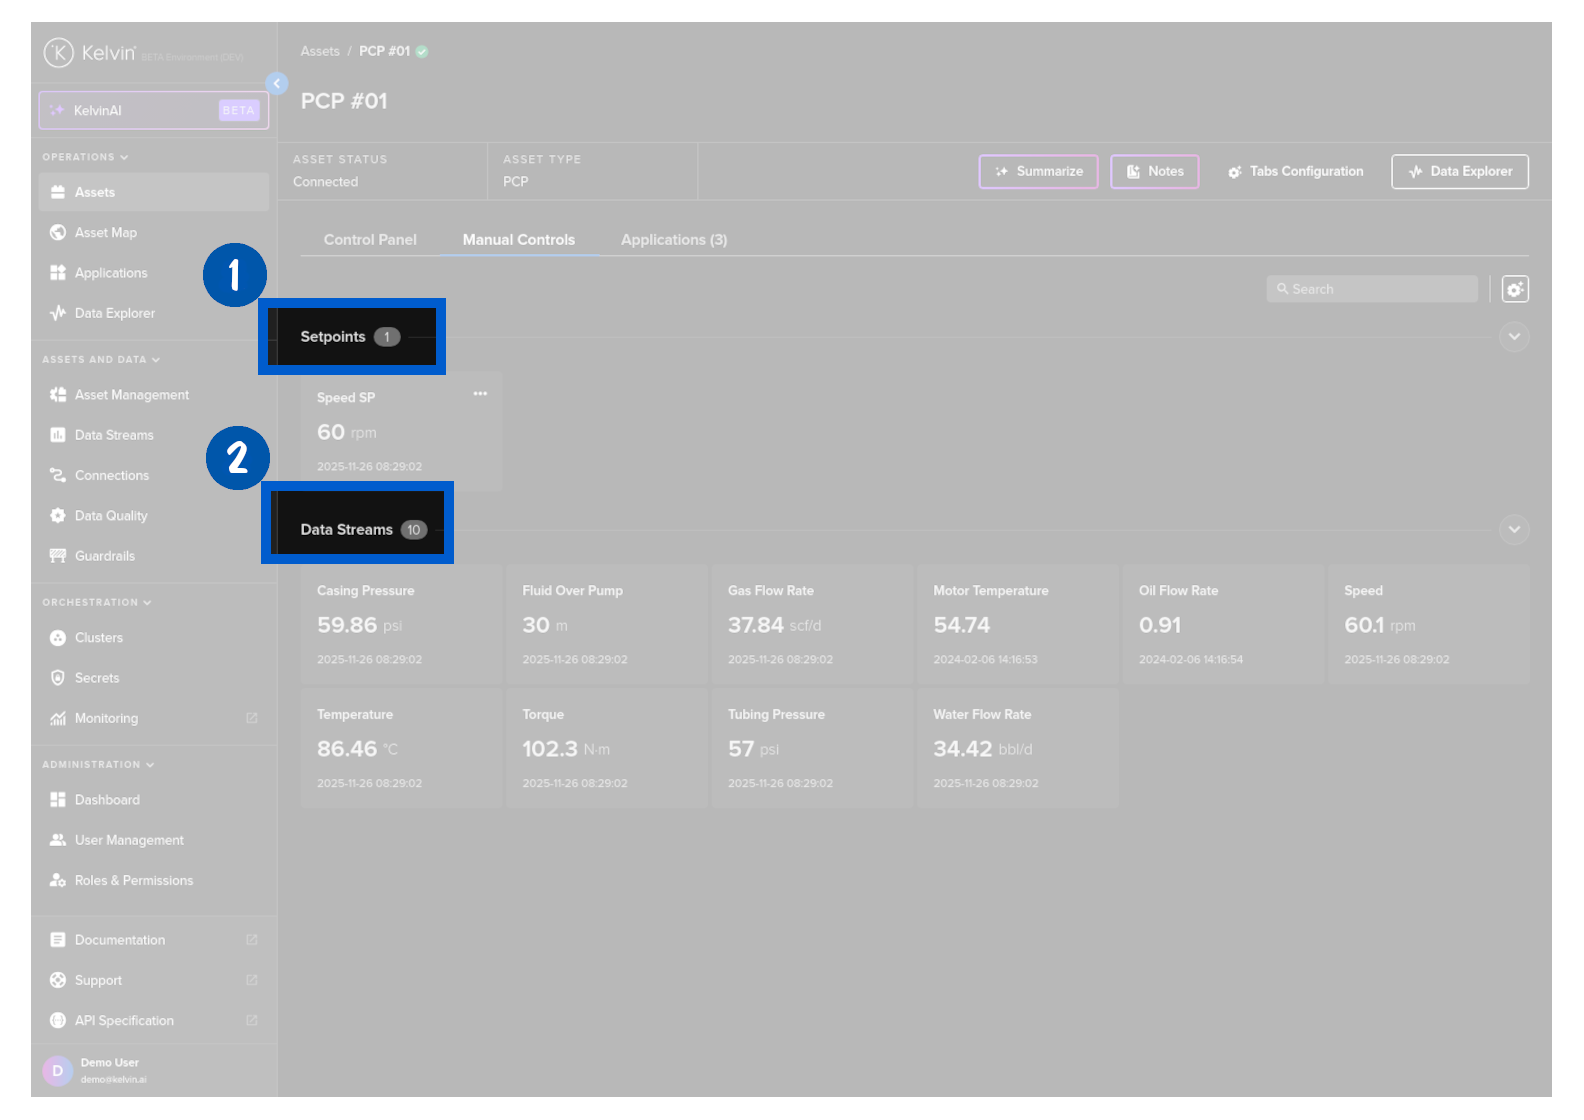
Groups
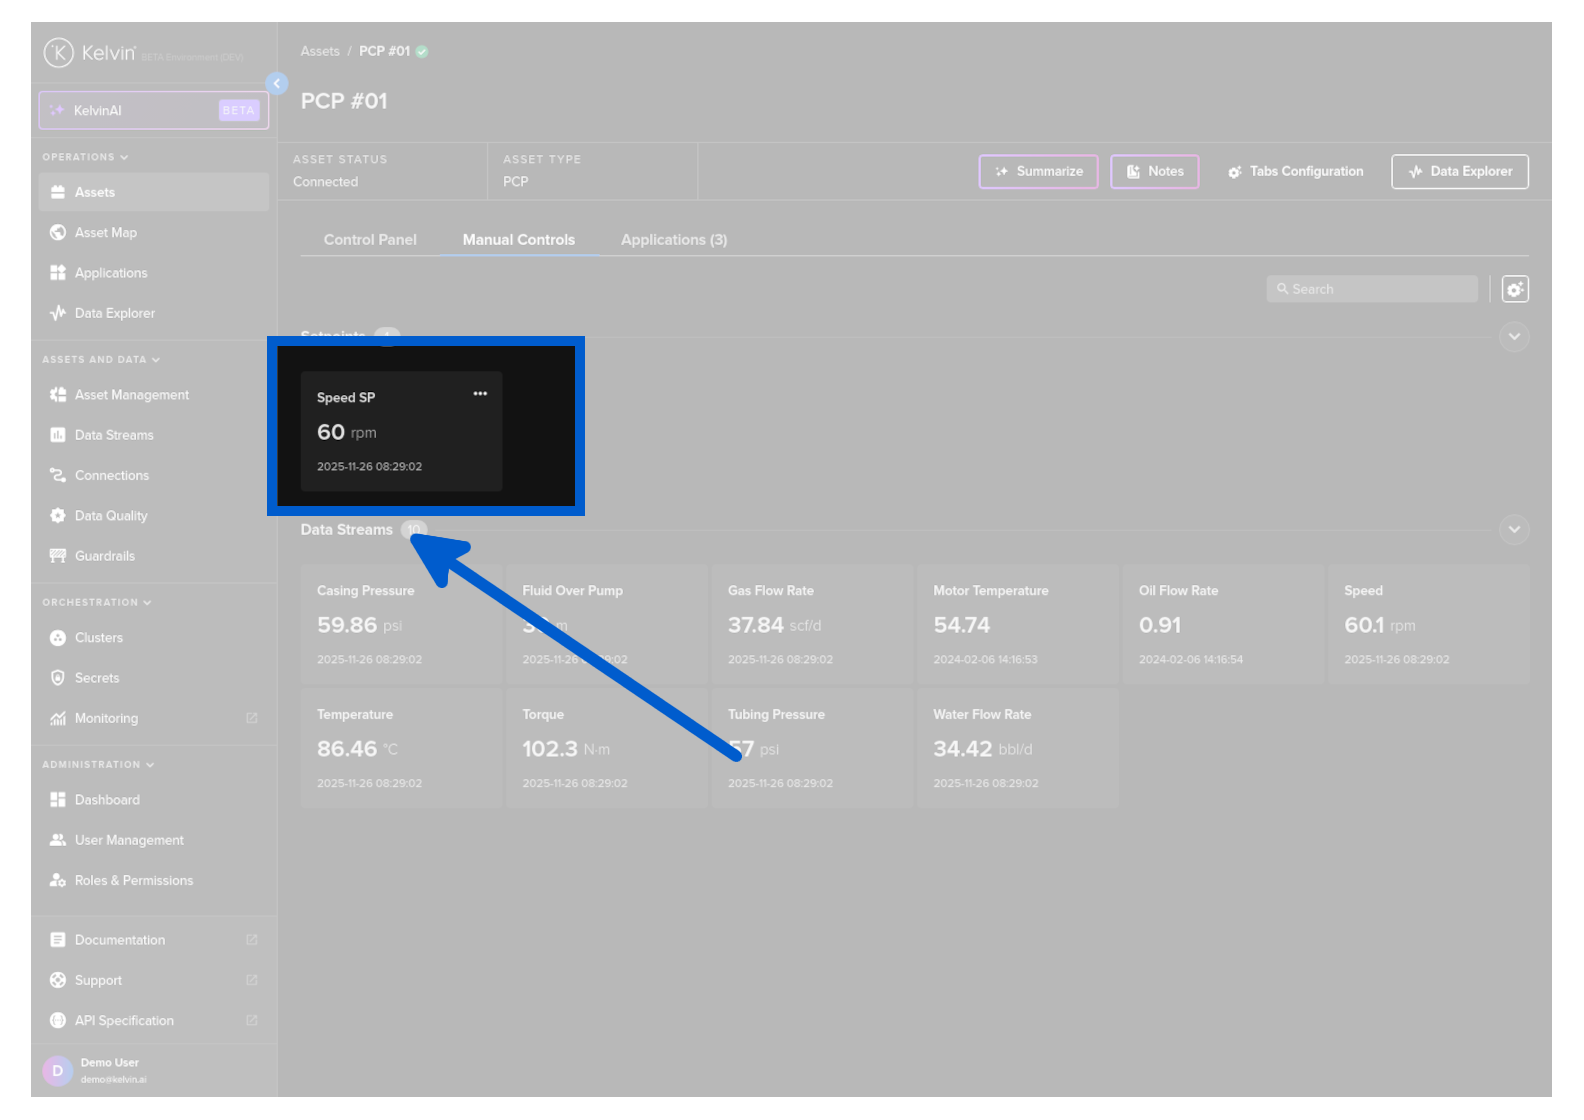
Initially Data Streams are grouped into two groups.
- Setpoints : Data Streams that are set as read / write when creating the Connector.
- Datastreams : Data Streams that are set as read only when creating the Connector.
You can also add custom groups and move any of your Data Streams into your custom groups.
Manage Groups
You can manage the groups and define where you want to show each Data Stream.
Note
If you do not assign a Data Stream to a group, it will be shown in the default group Data Streams.
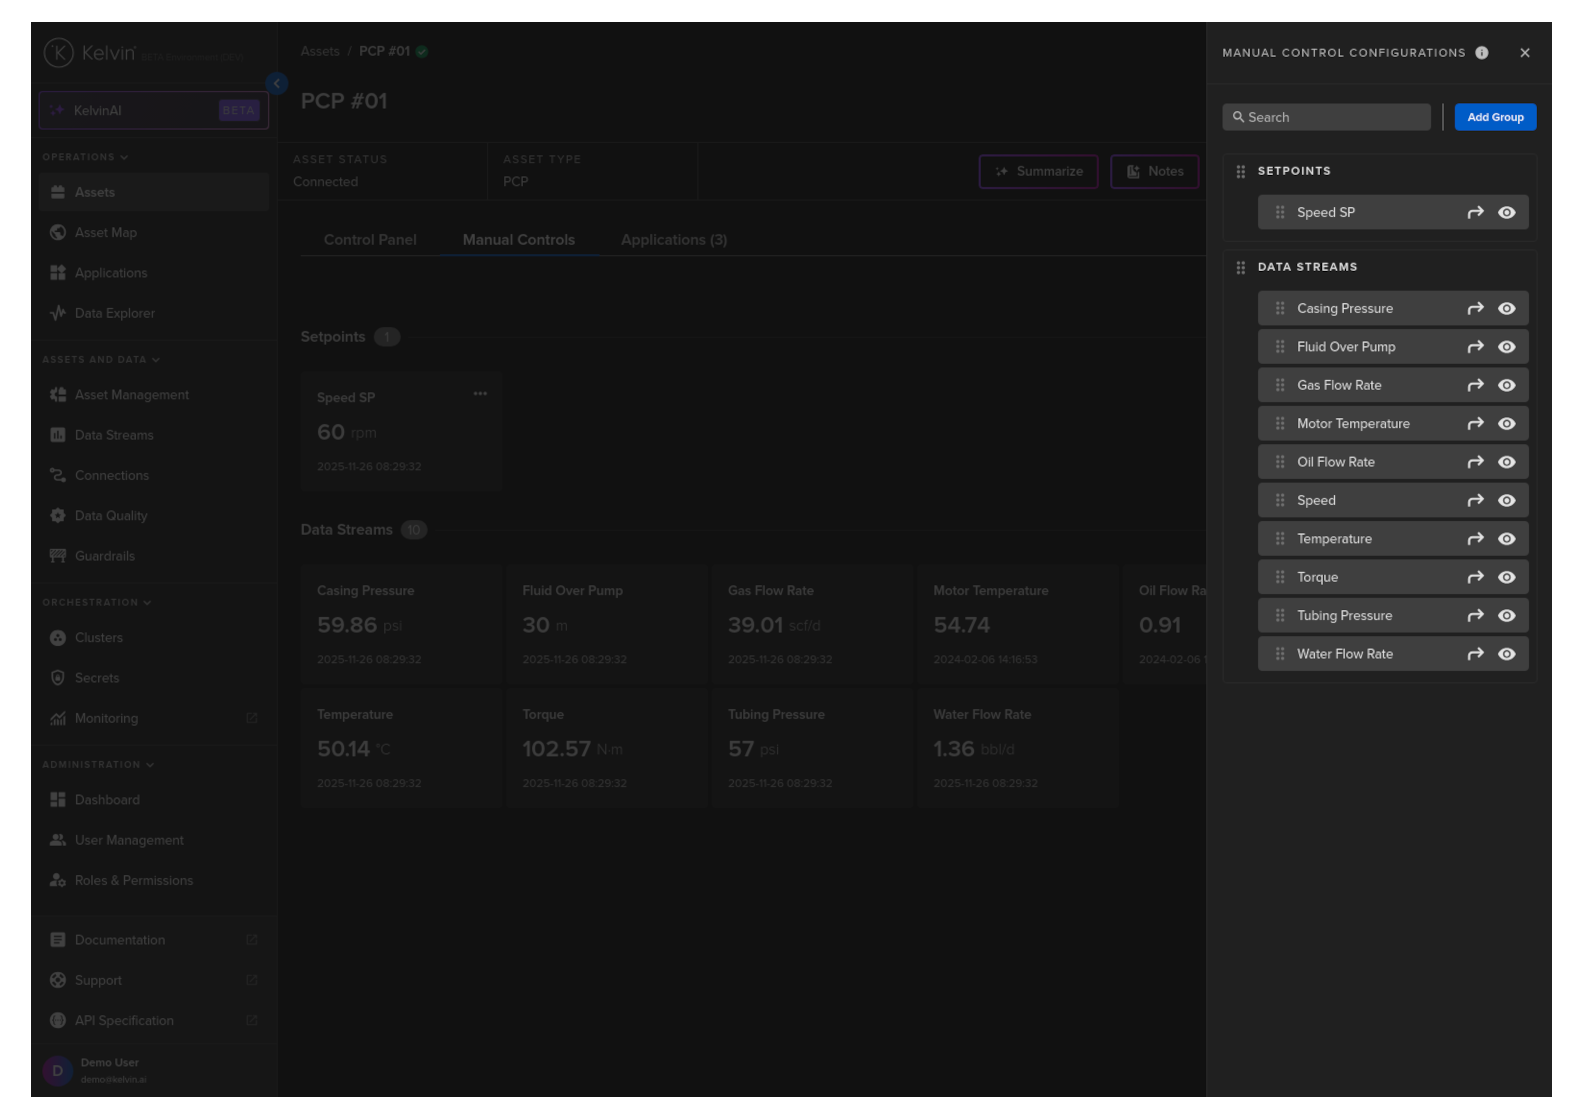
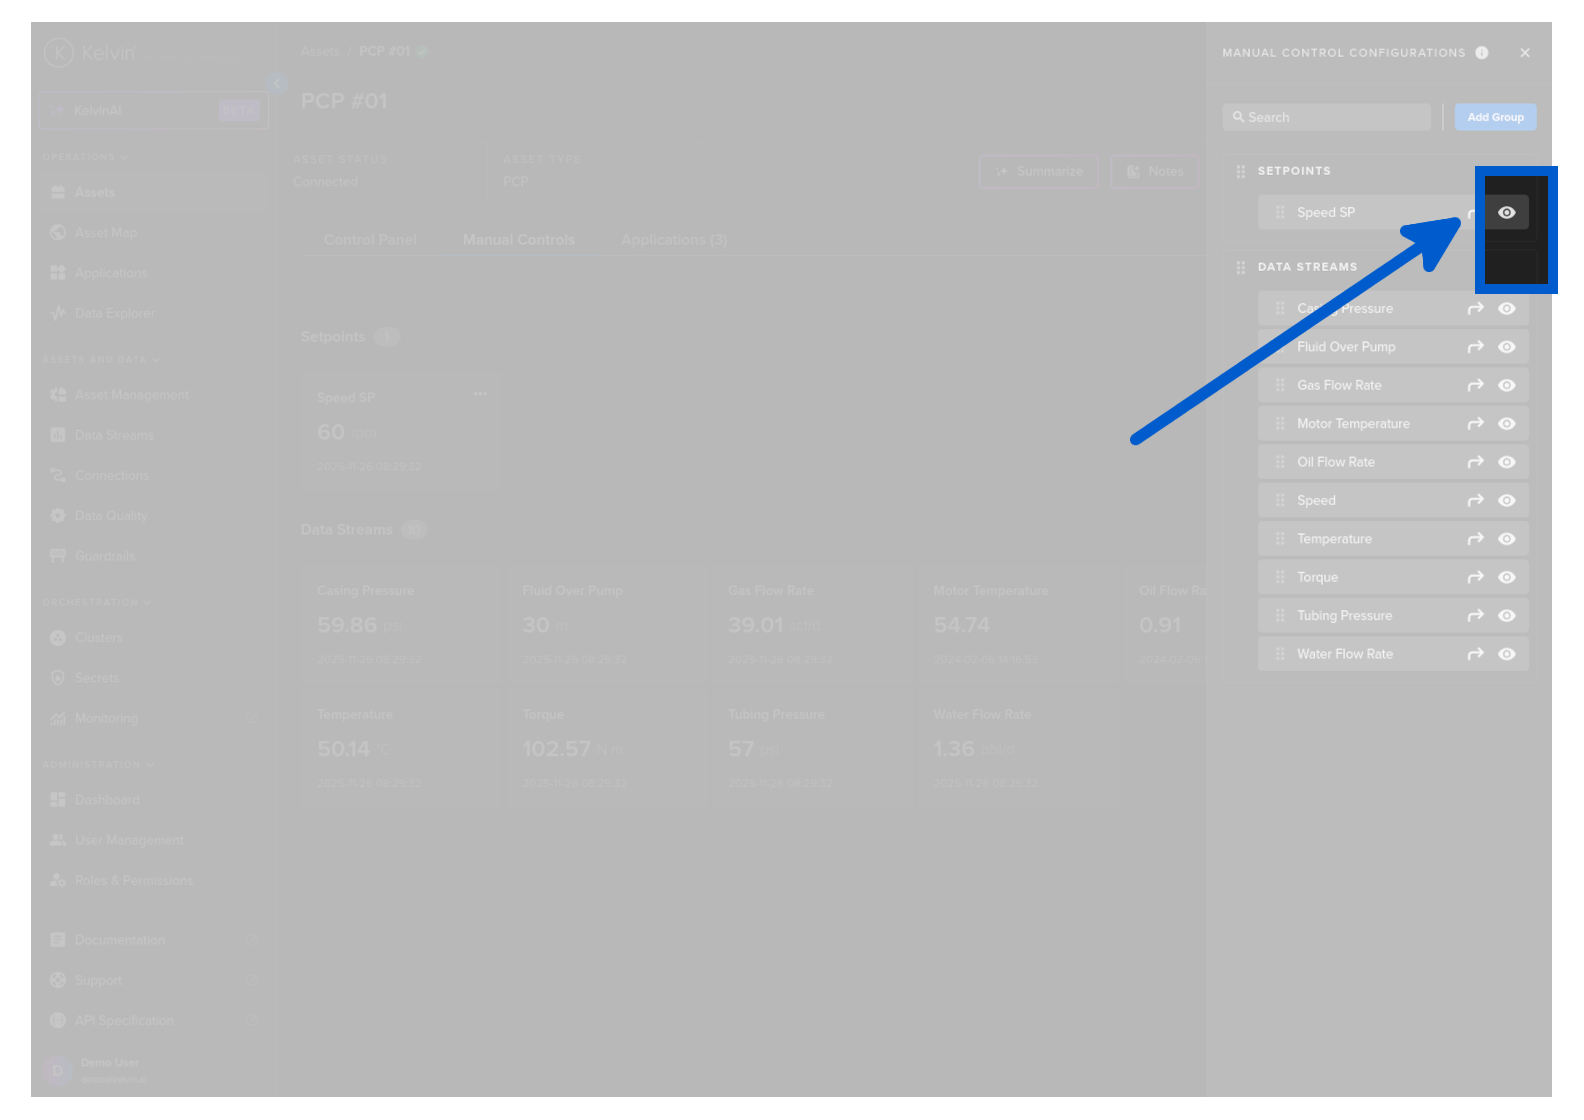
To manage your groups, click on the settings icon ![]() in the top right corner.
in the top right corner.
![]()
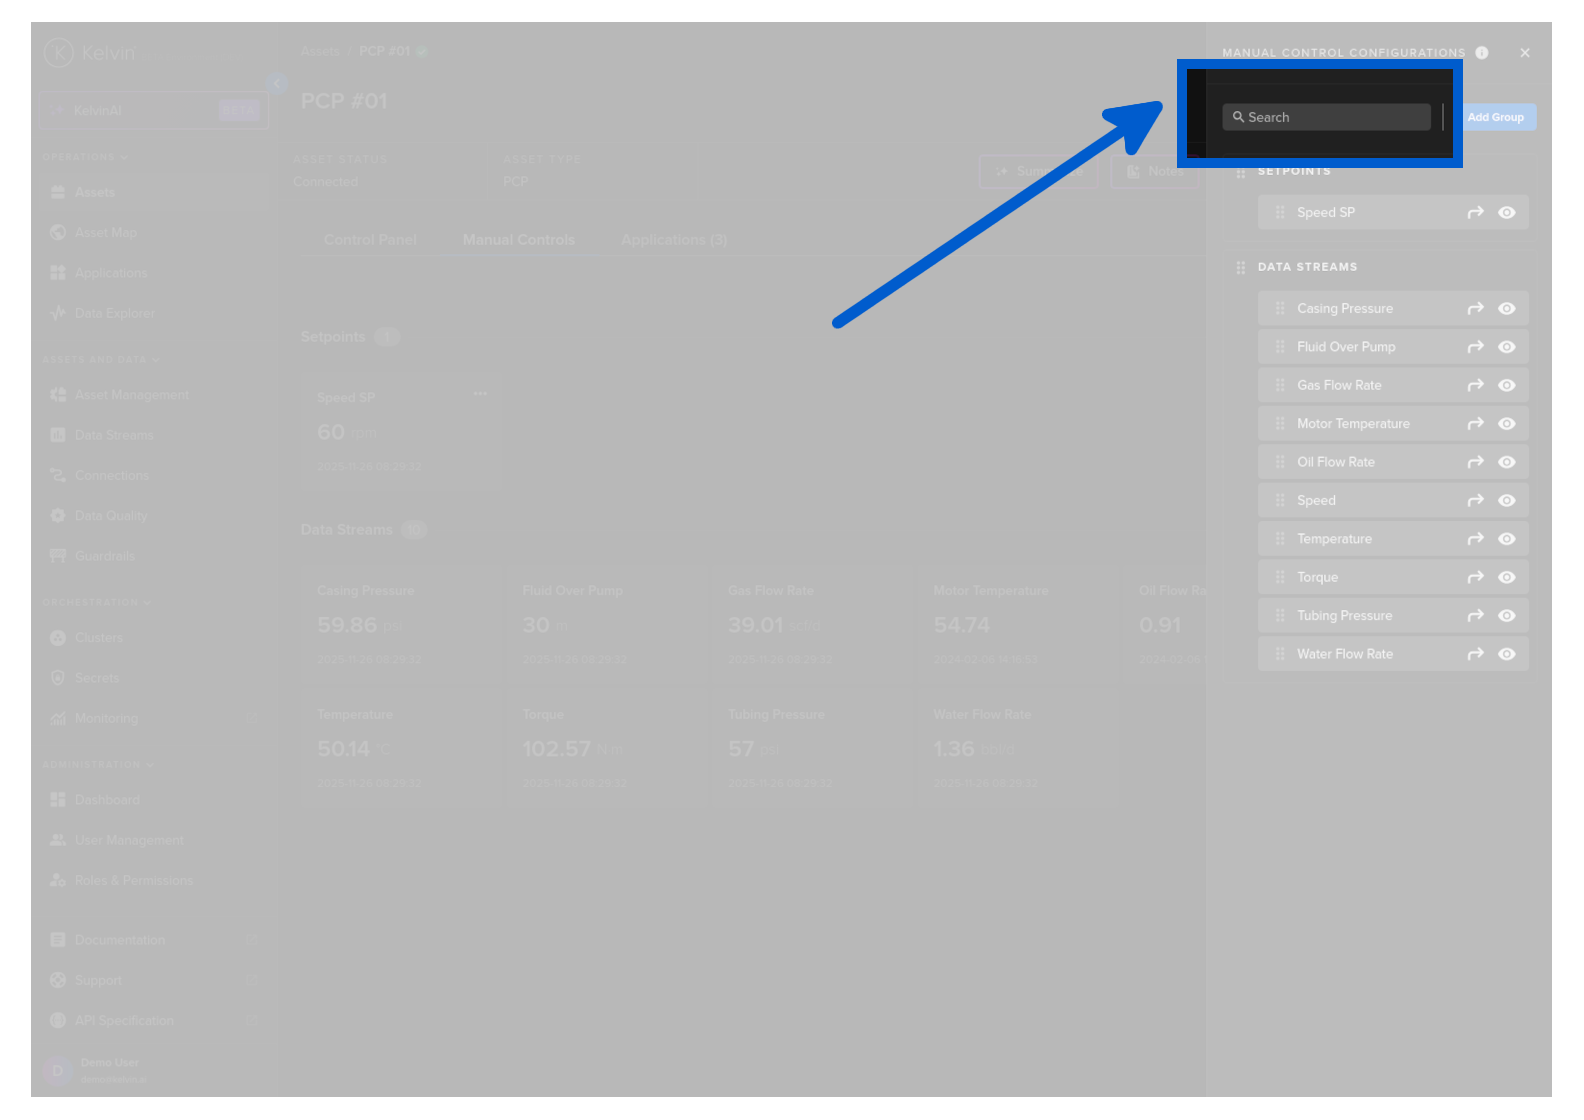
You will then see your group management window.
You can filter the Data Streams that are shown on the list in this group management section.
Note
This does not change how the Data Streams are displayed in the Dashboard itself.
You can drag and drop an Data Streams to reorganize the order of the Data Streams.
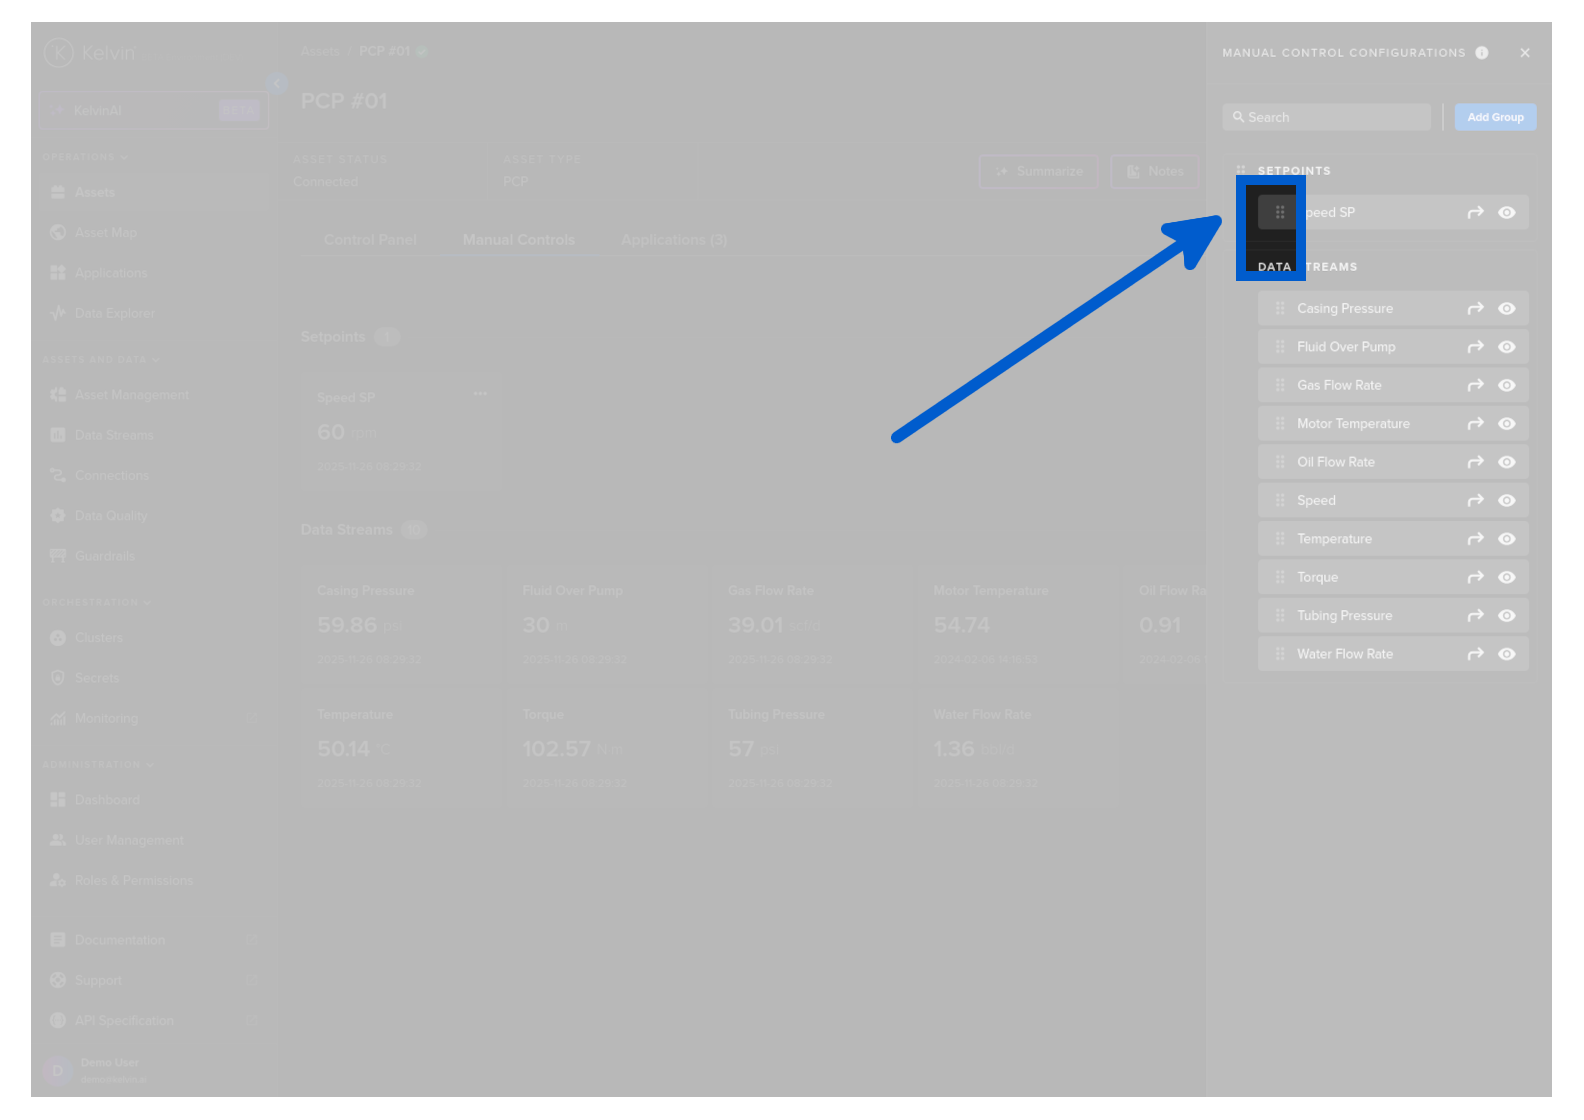
Or use the move icon.
![]()
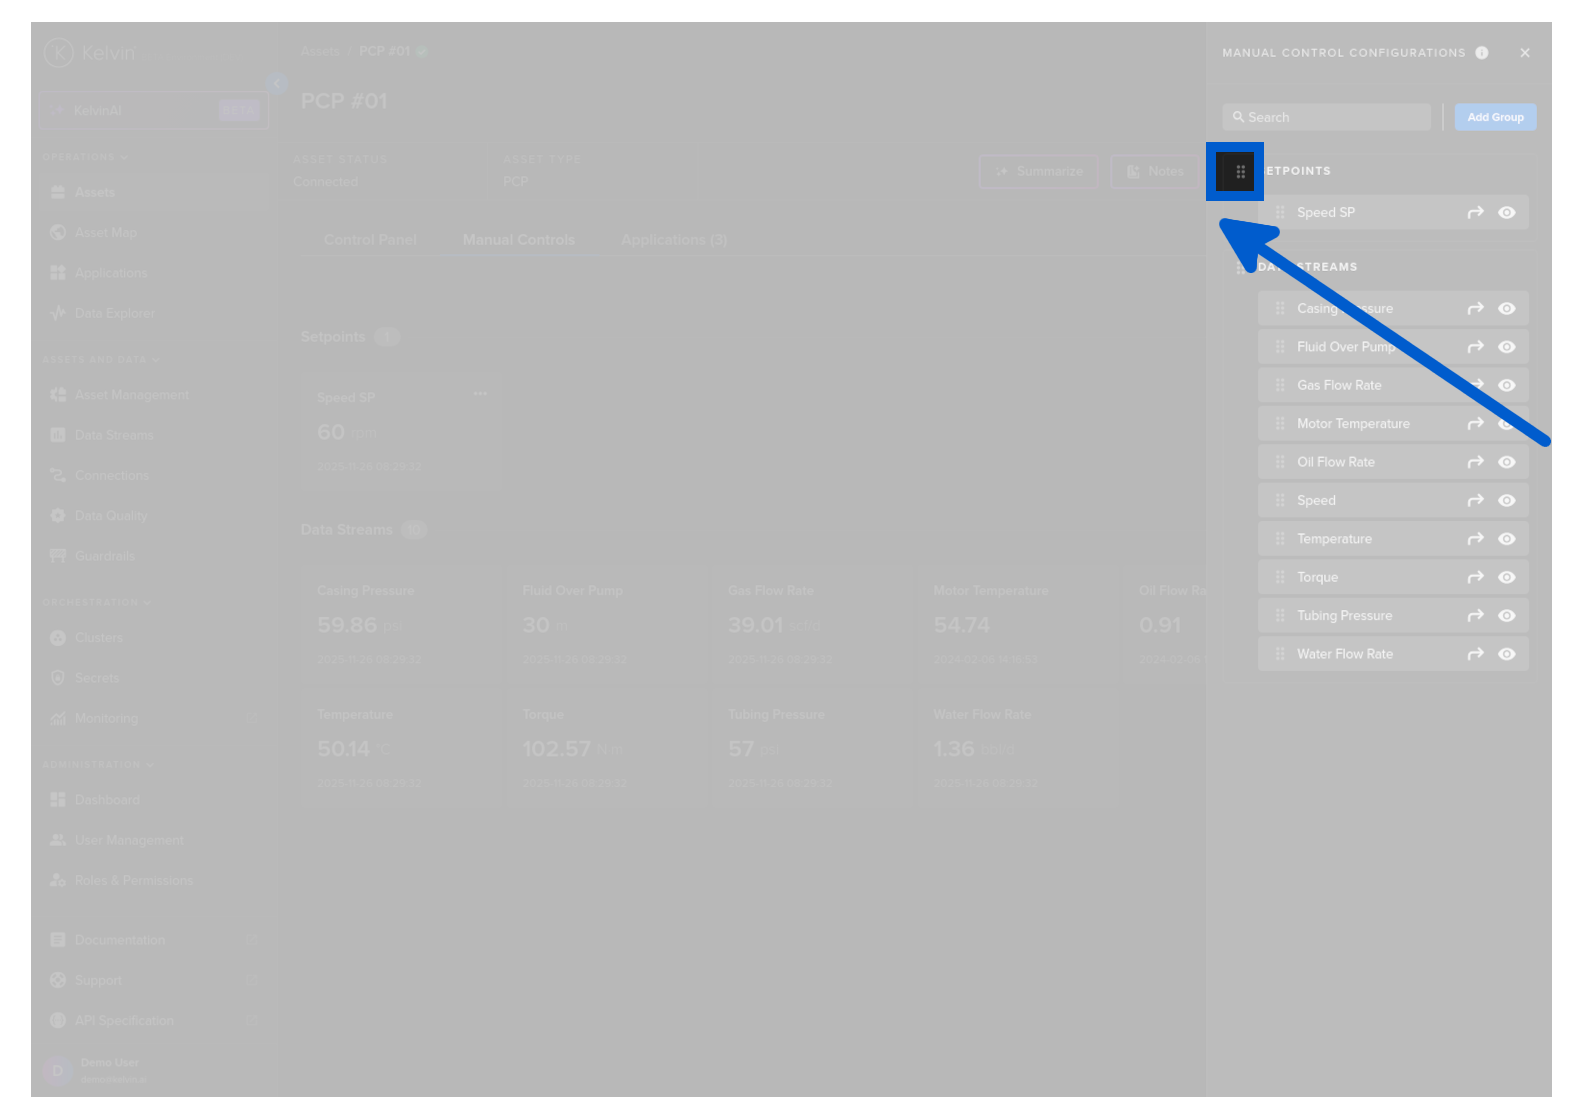
You can drag and drop a group to reorder how the Groups are shown on the Dashboard.
You can hide an Data Streams so that it is not shown in the Dashboard.
Add Custom Group
The default groups are mandatory and can not be removed.
Note
If there are no Data Streams listed in a default group or all Data Streams are hidden, then the Group will not be shown in the Dashboard.
You can also add a new custom groups.
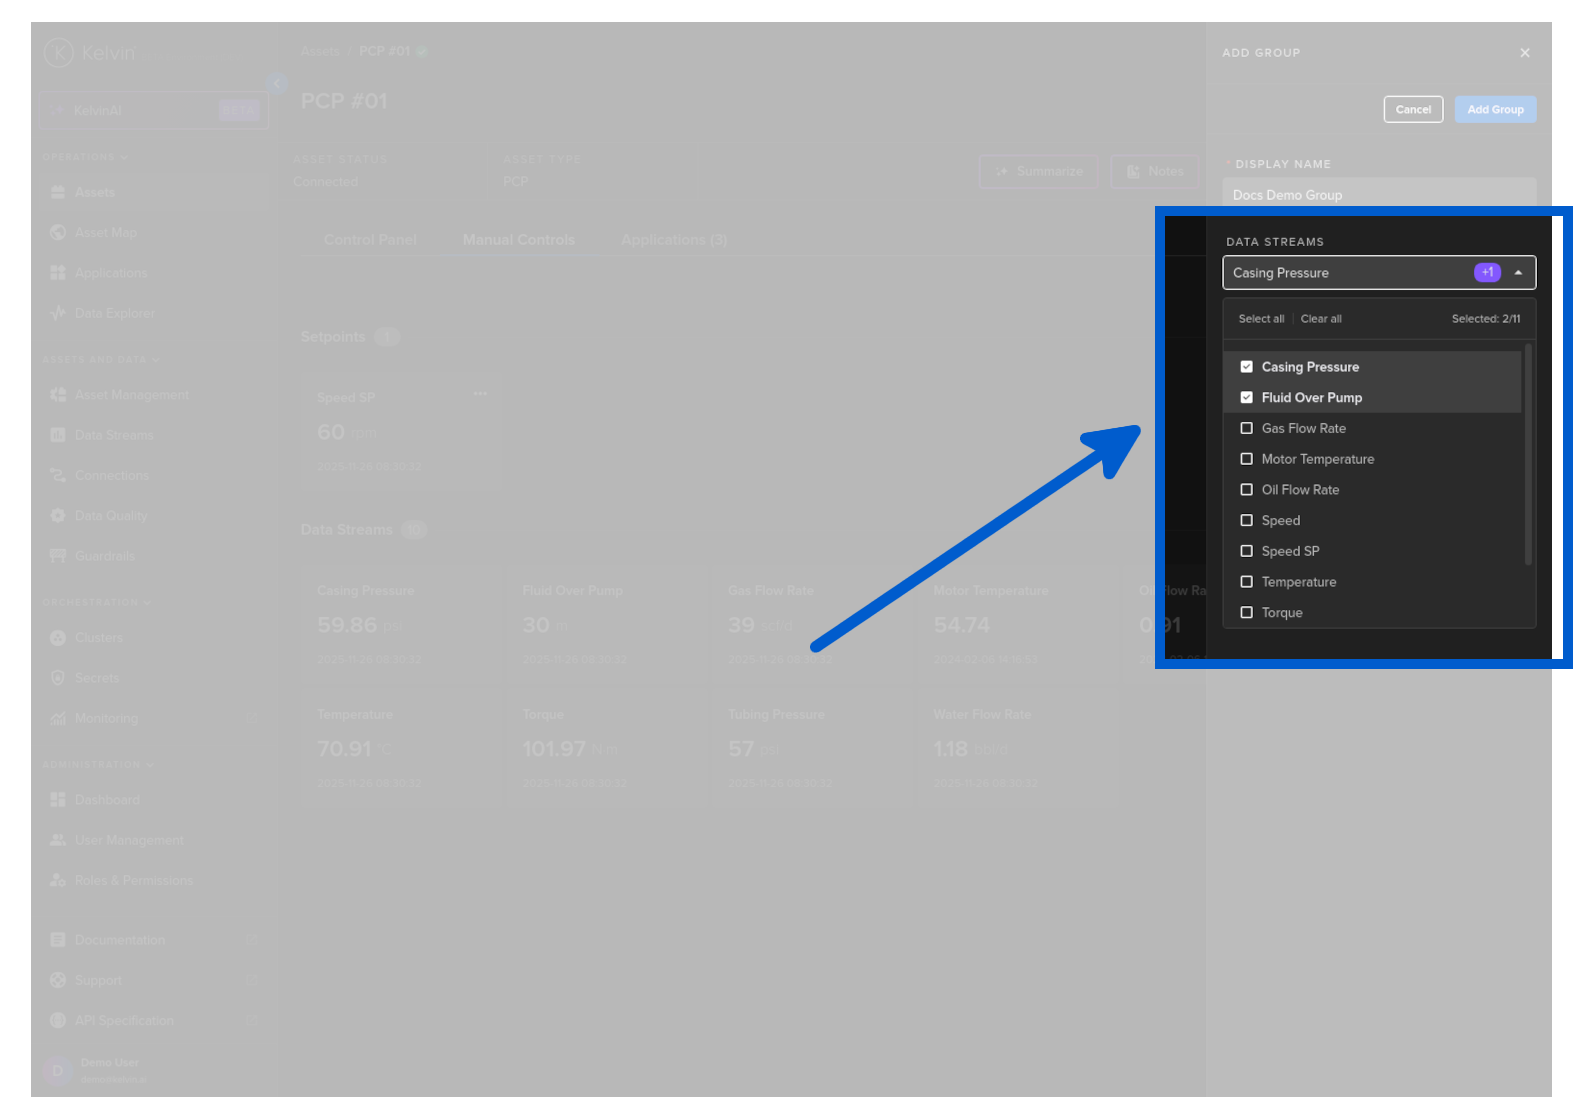
Simply click on the Add Group button.
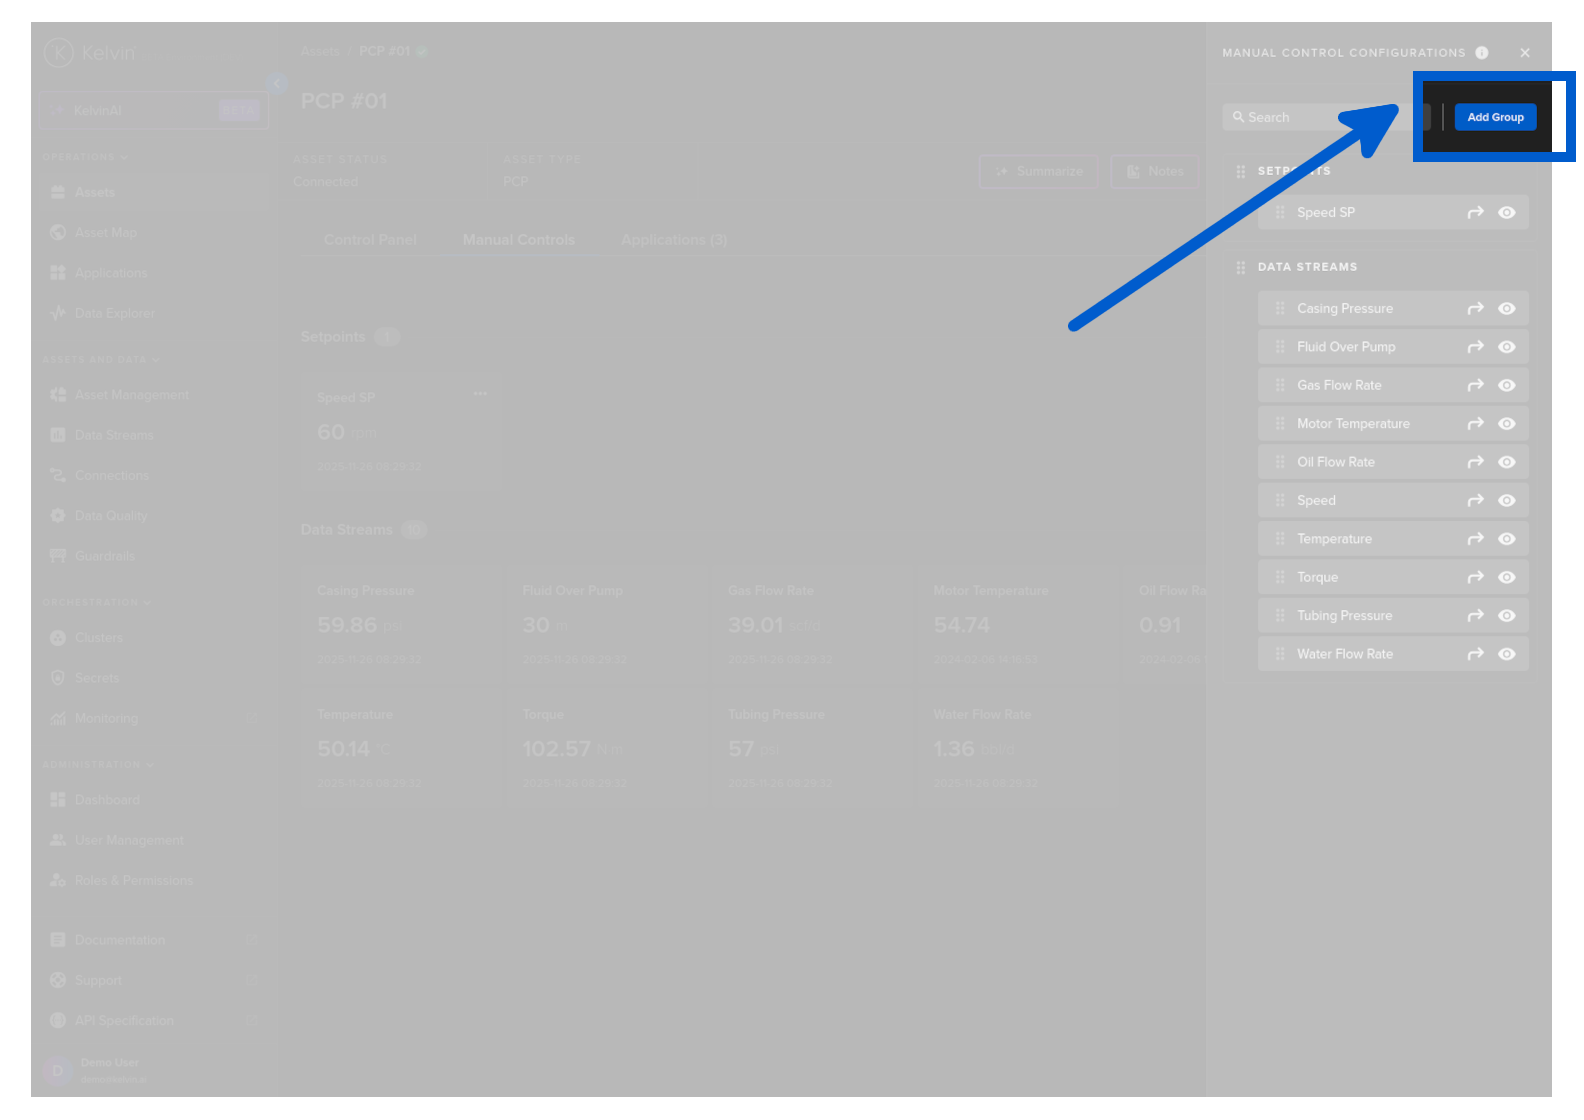
A side bar will open up.
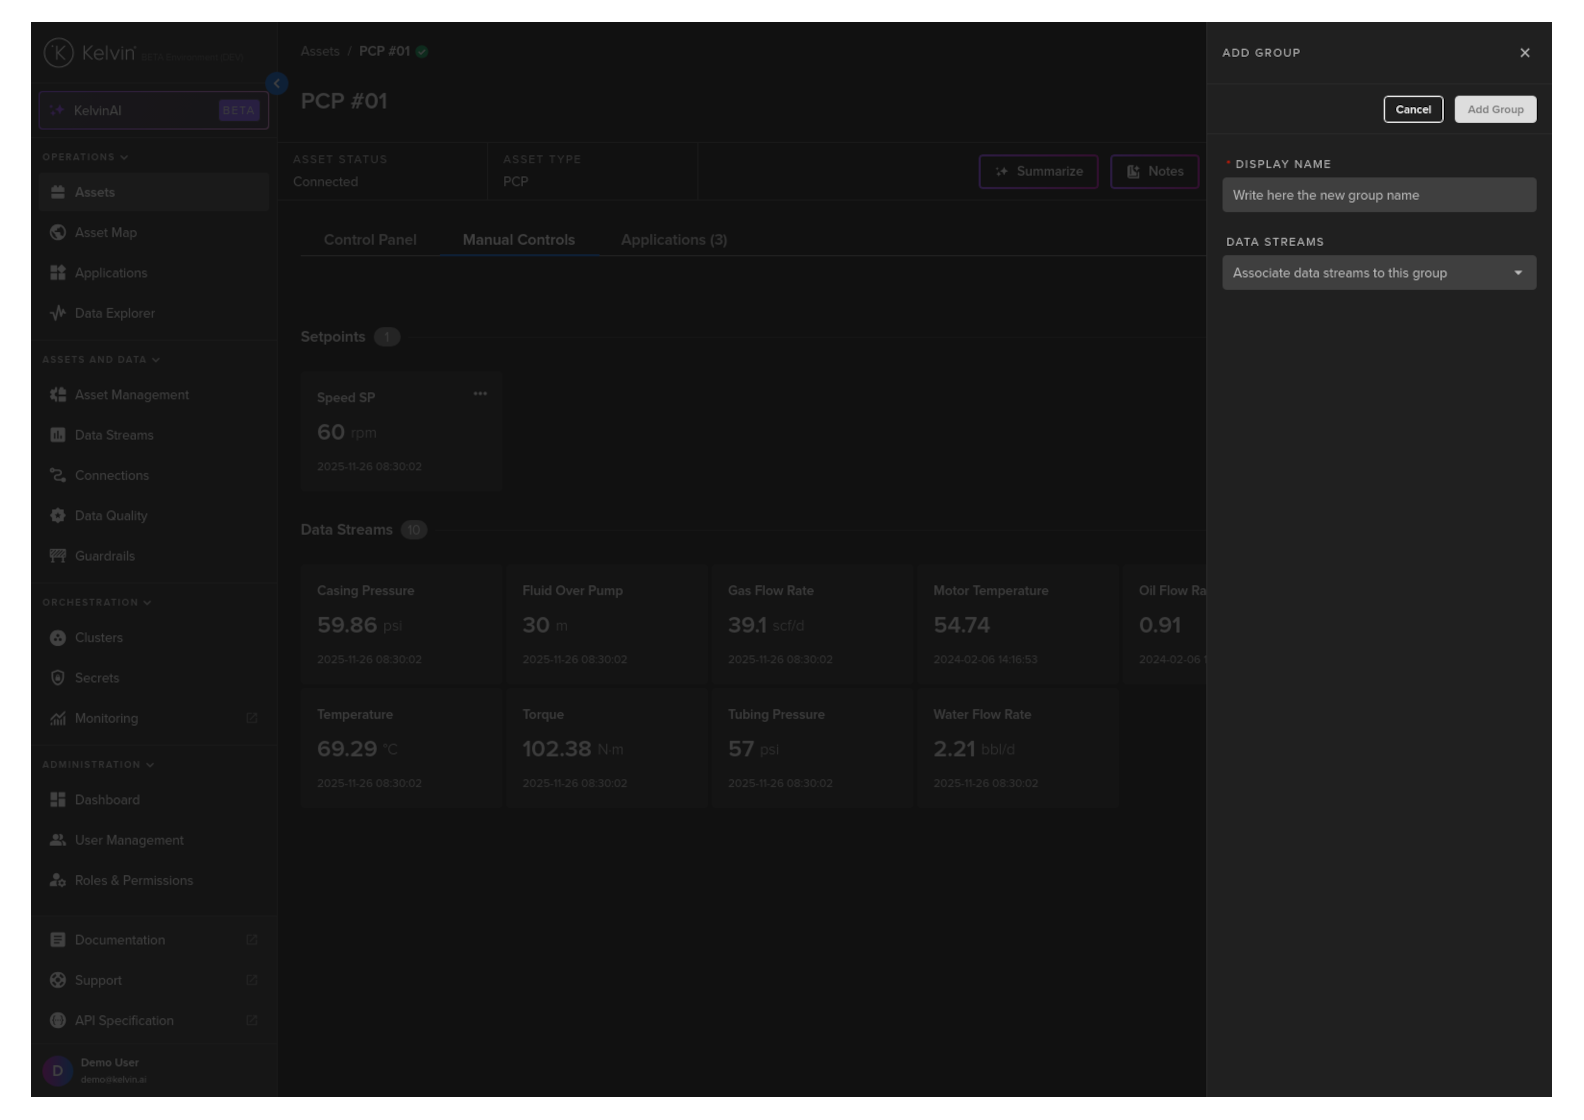
Give the new group a name.
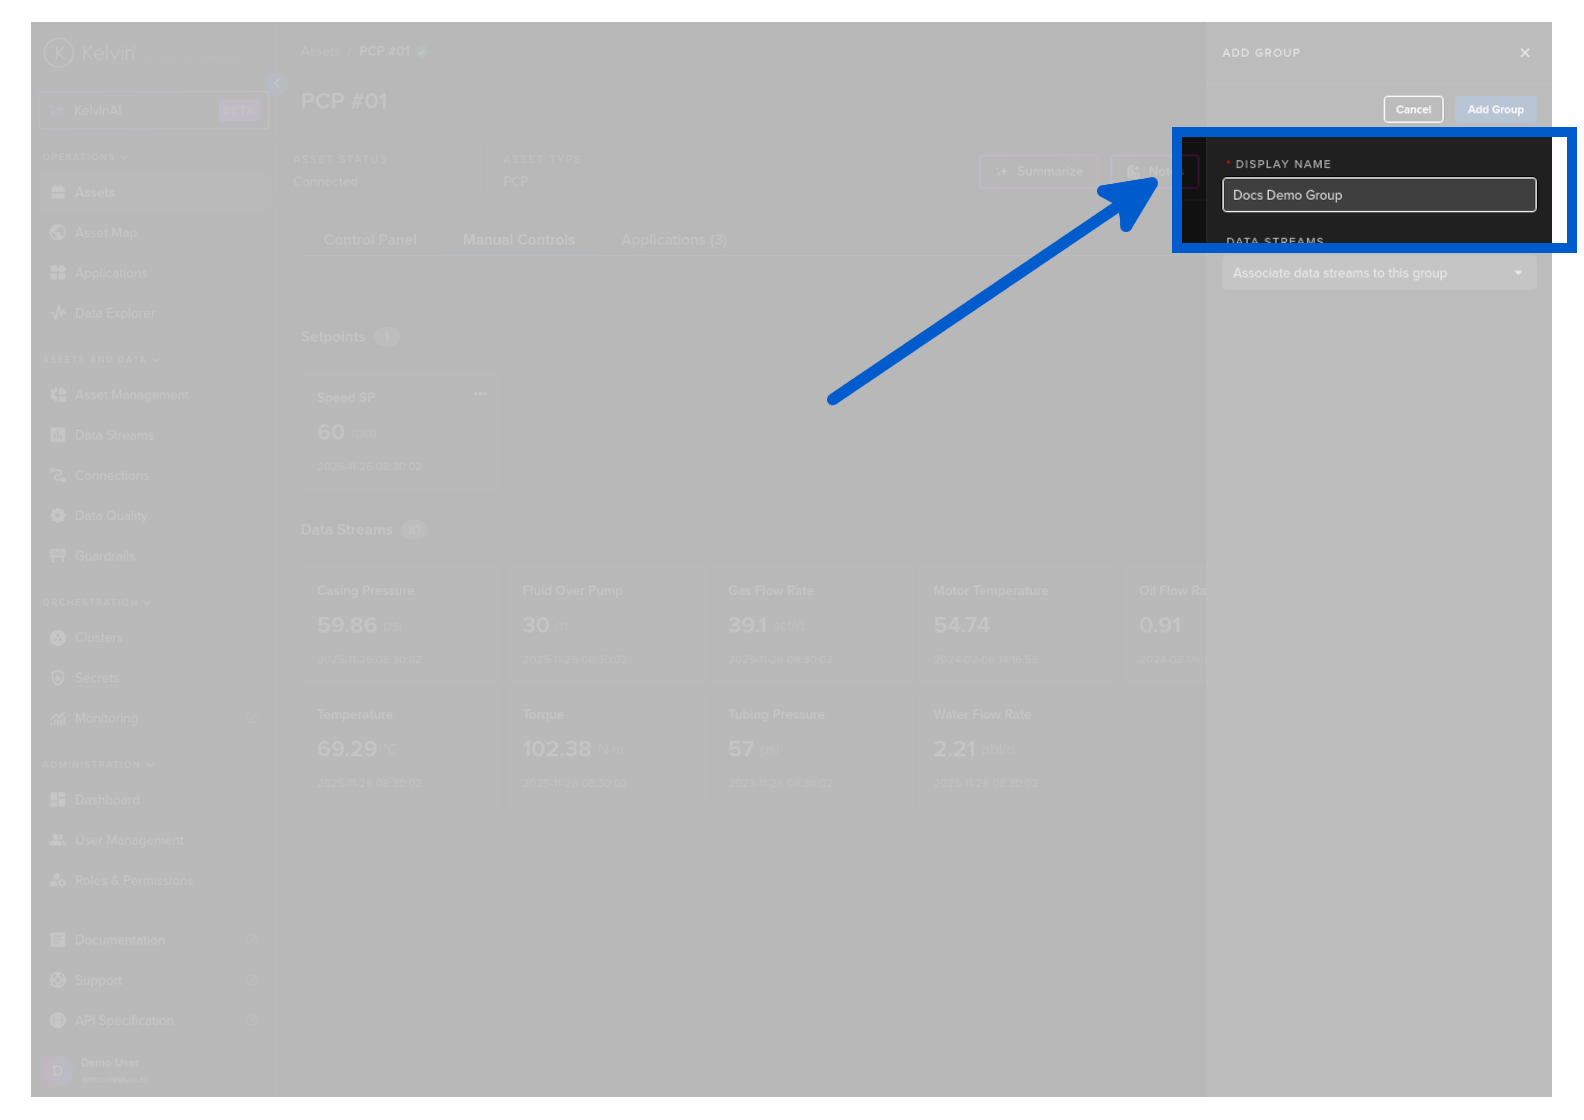
You can also immediately populate it with your wanted Data Streams.
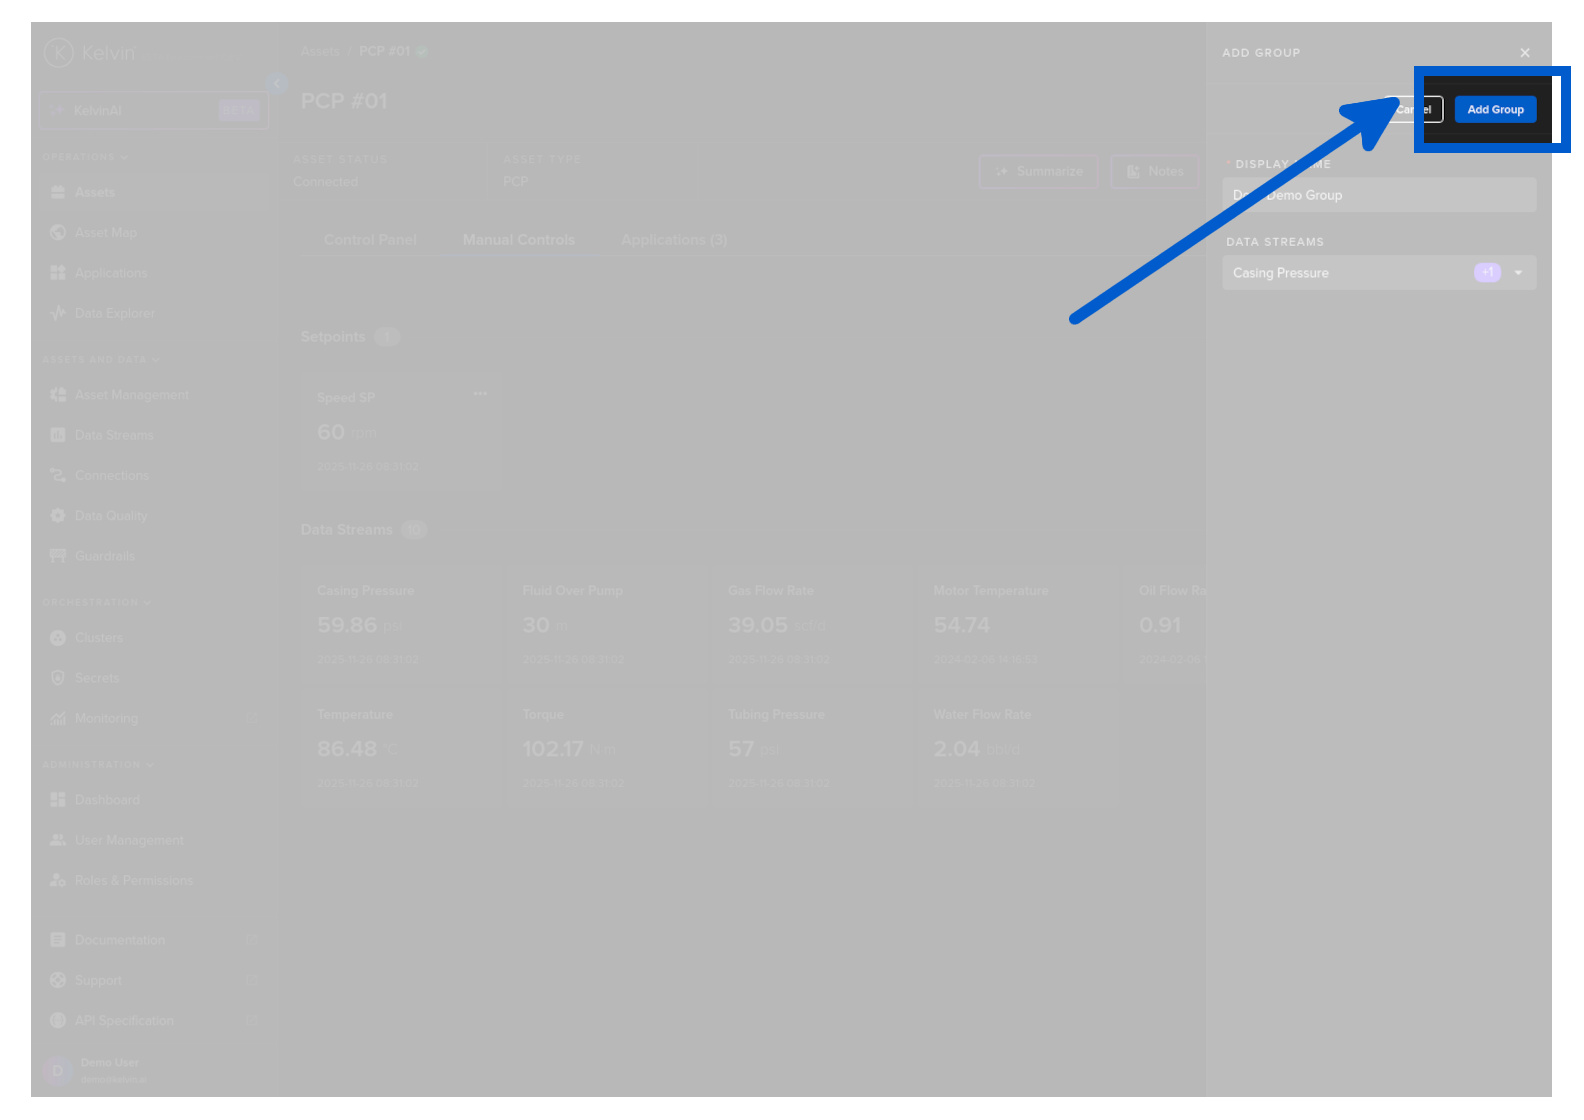
And then Click the Add Group button.
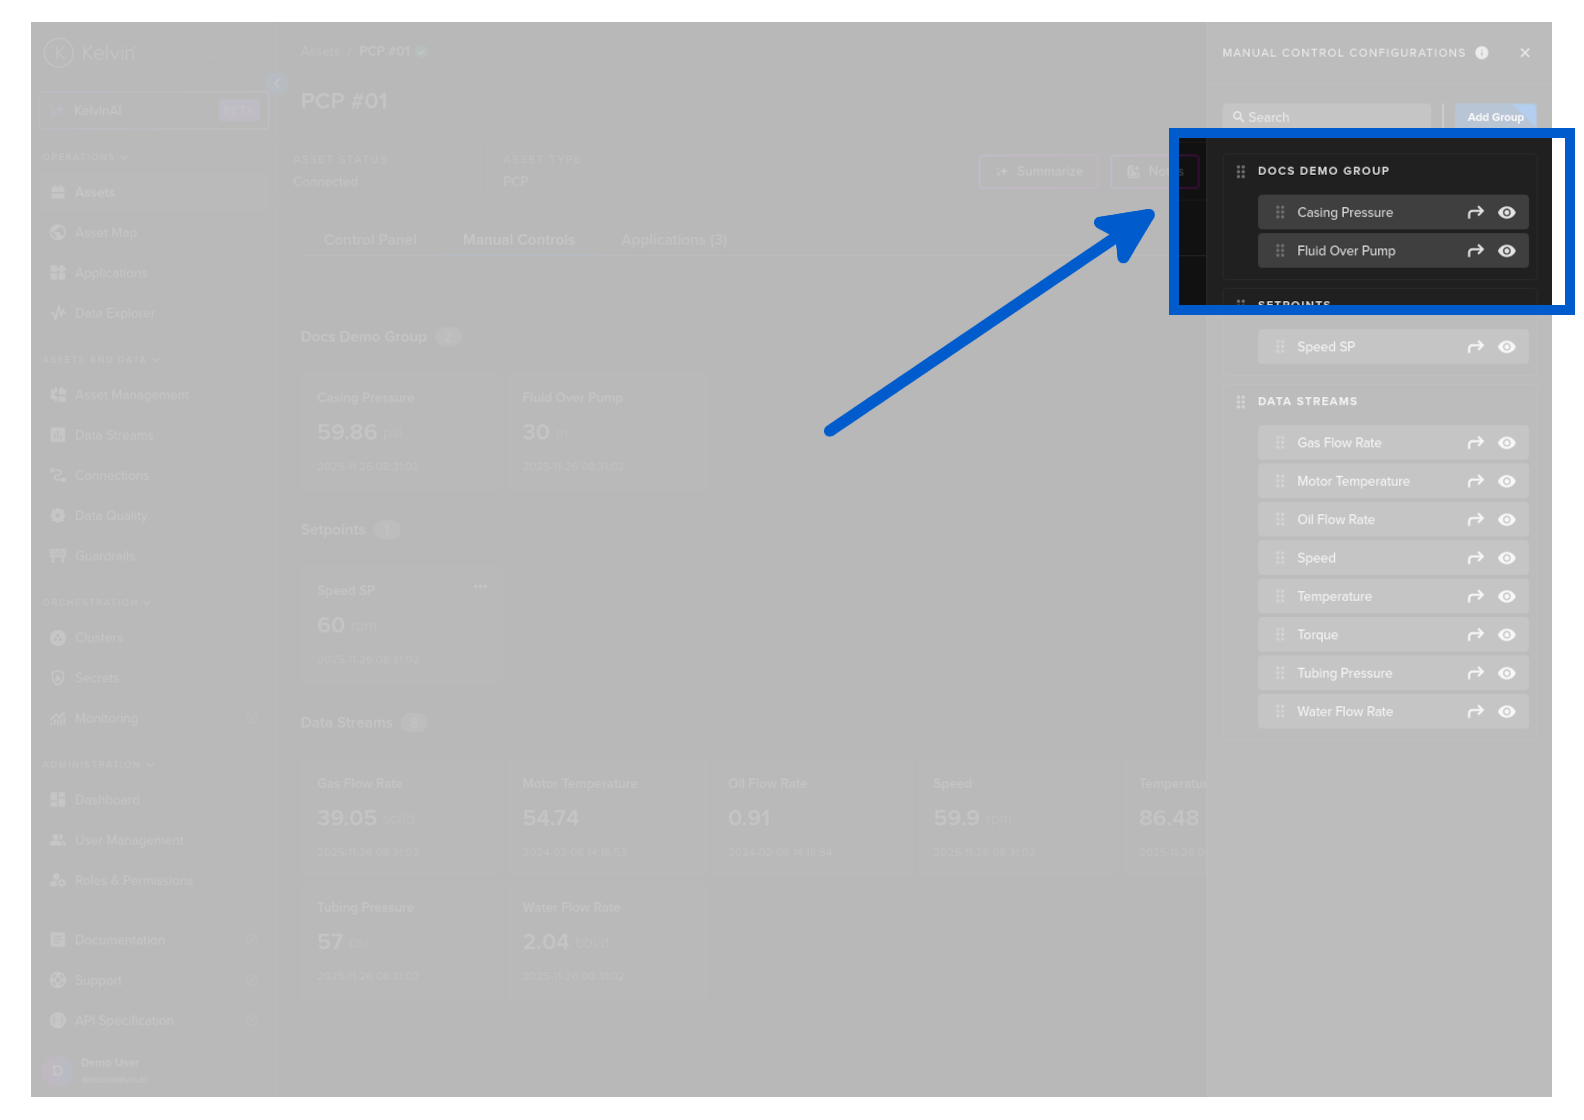
And you can see the new group with your preselected Data Streams.
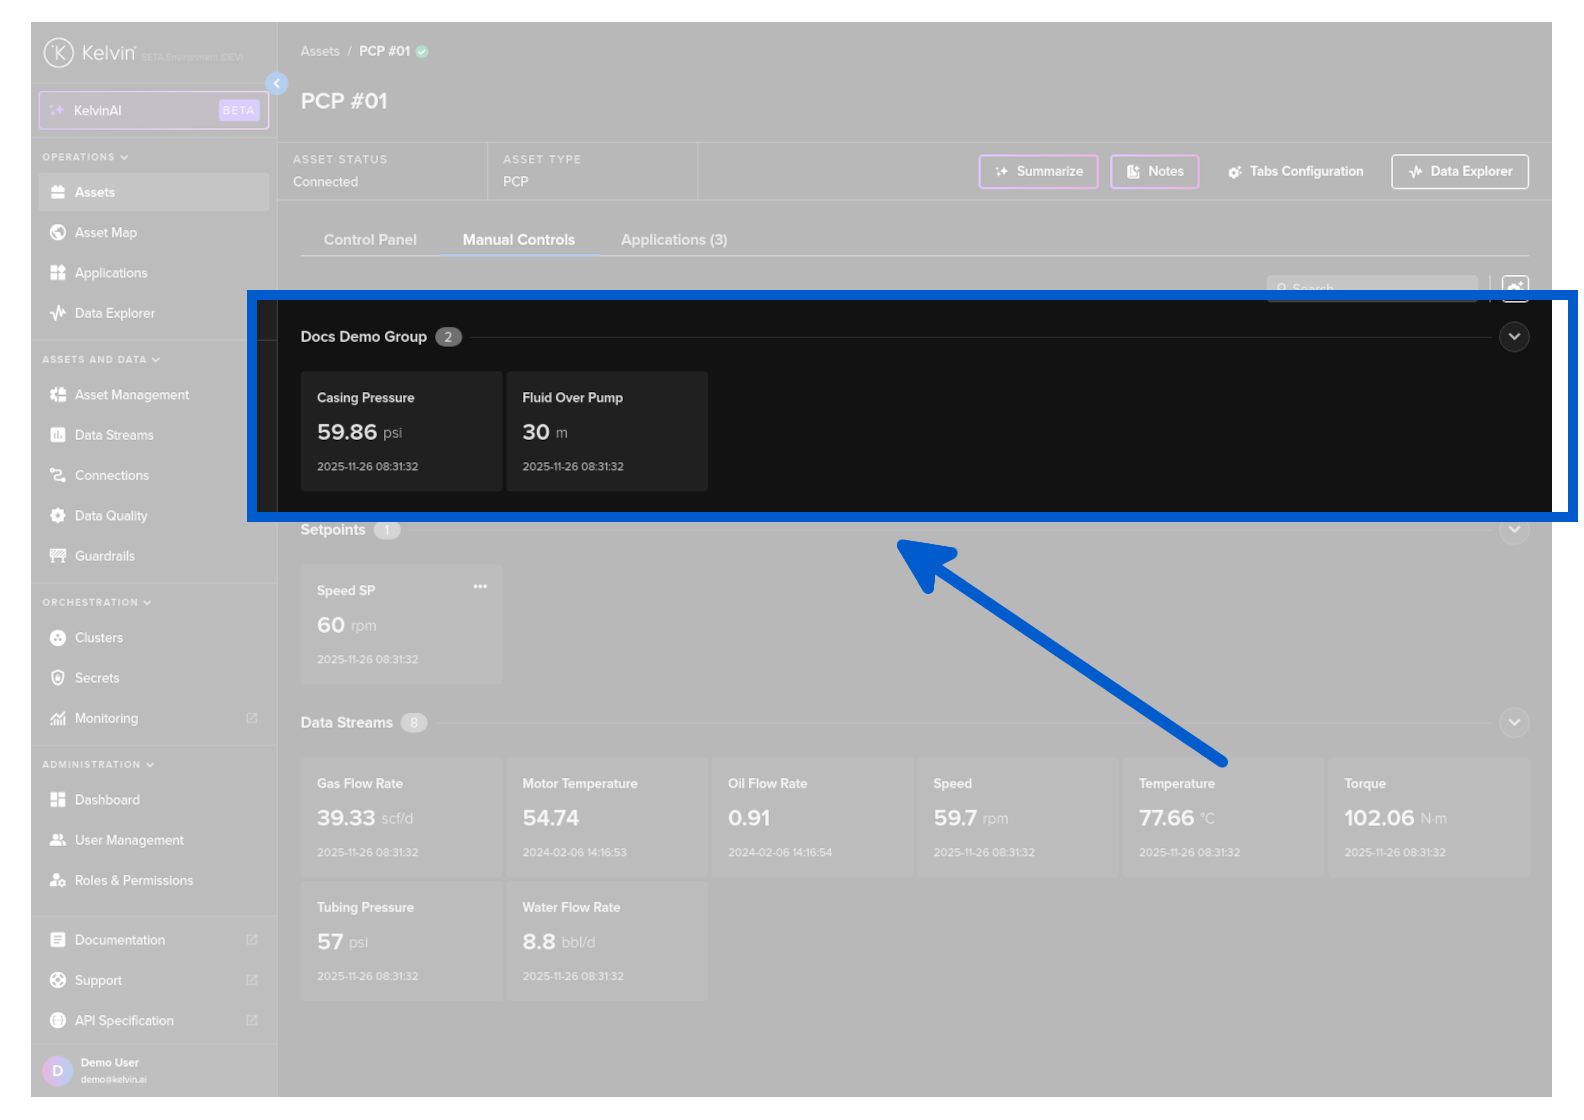
Closing the Group sidebar you can see it now in your Manual Controls Dashboard.
Data Stream Cards
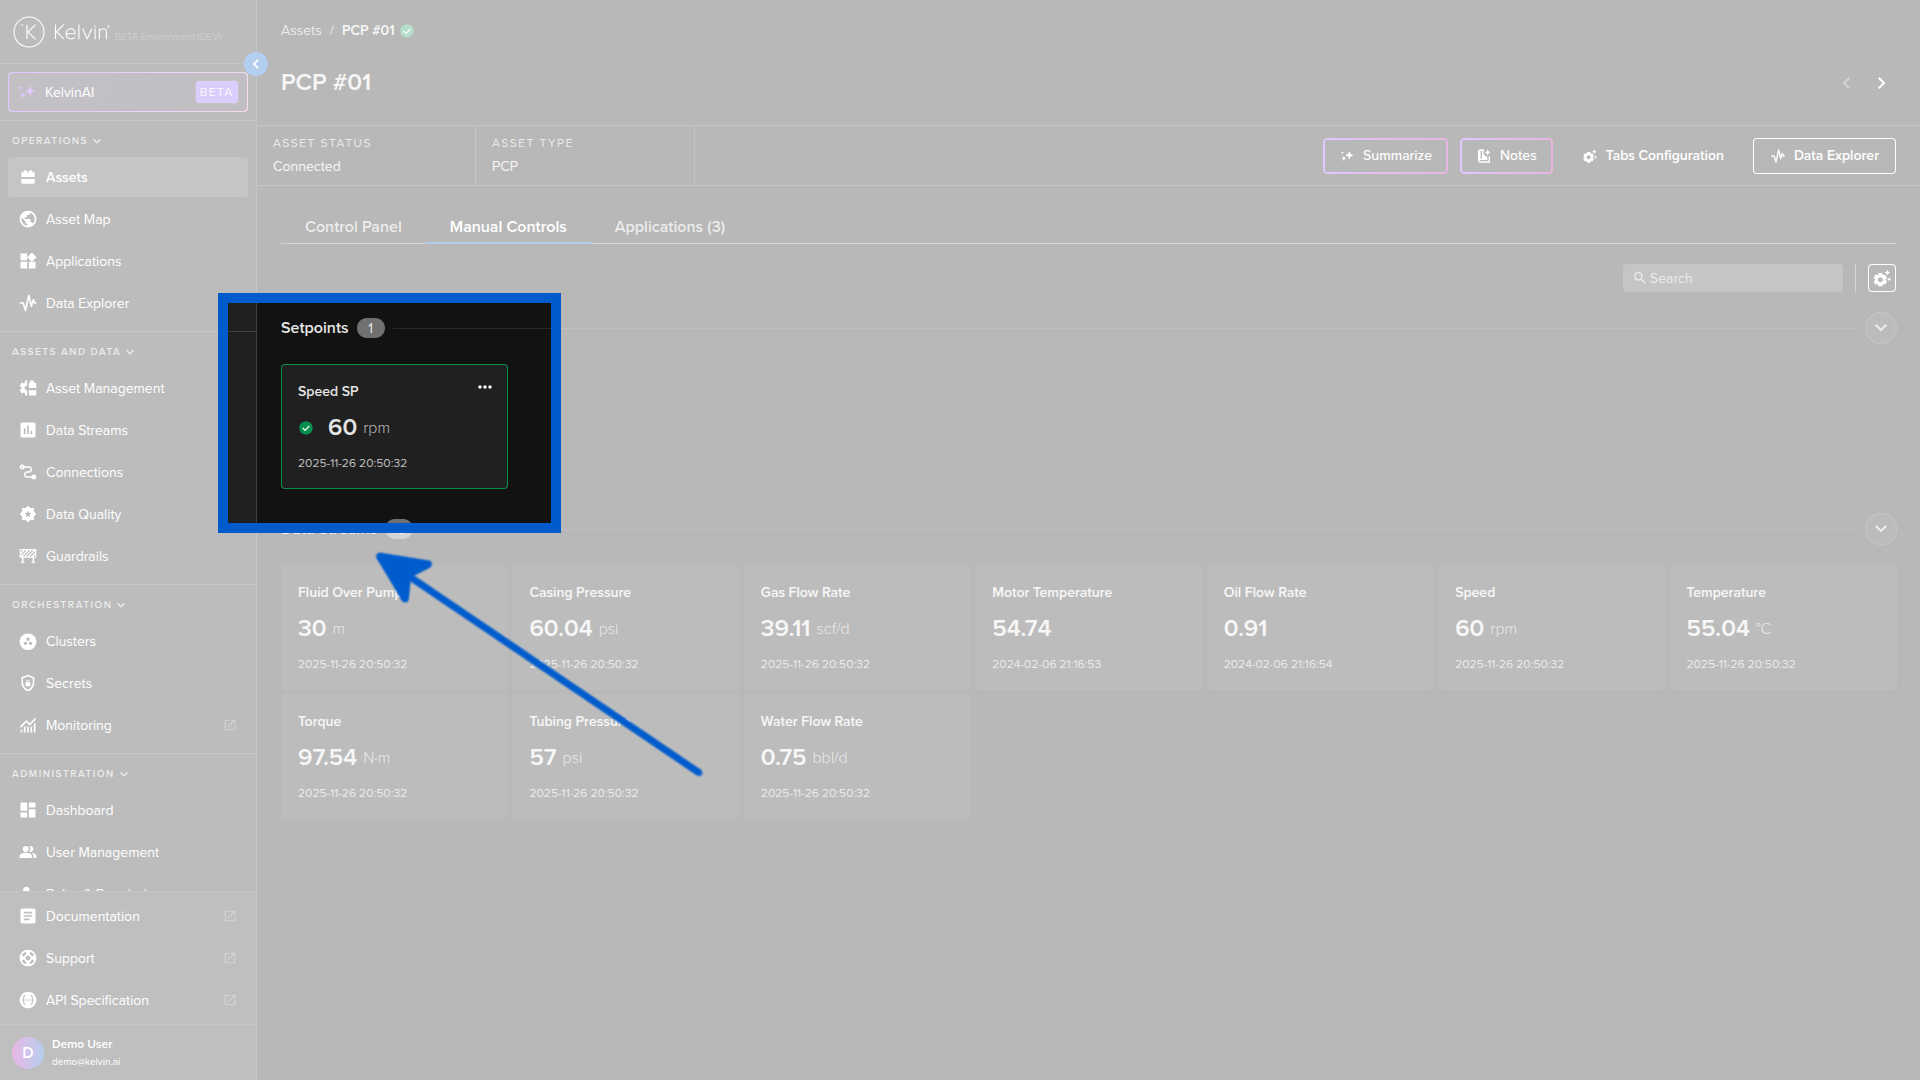
Read / Write Card
For the read / write Data Streams you will see the Data Stream values and have the ability to write new values or see the Control History.
Note
For read / write cards you will have a meatball menu icon ![]() in the top right corner.
in the top right corner.
After changing the value, the card outline will briefly change color to indicate the results of the Control Change.
Note
If a Control Change fails, then the card will also show a red error mark to alert you that there is a problem.
You can see the issues by looking at the history.
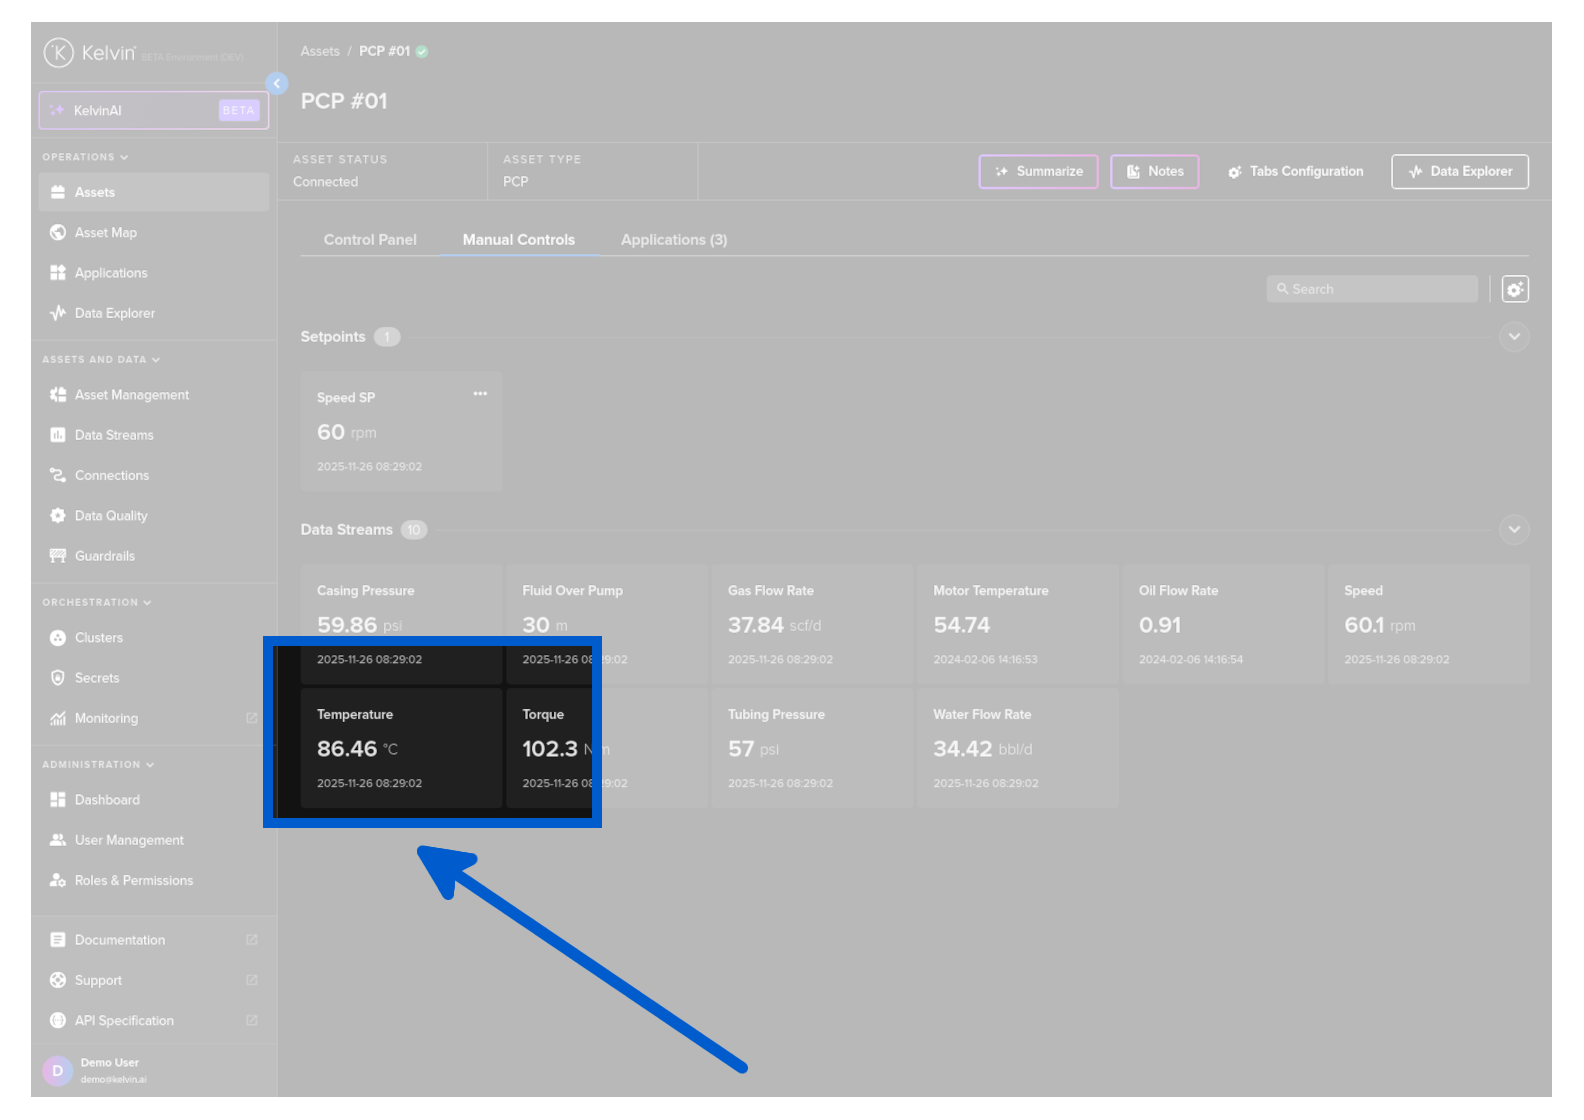
Read Only Card
For the read-only Data Streams you will only see the Data Stream values and when it was last received.
Change Values
For read write Data Streams the card also shows the most recent Control Change and its status.
You can send a new value to the Asset / Data Stream pair by clicking on the three dot icon ![]() in the top right corner of the Data Stream card and select Add Value.
in the top right corner of the Data Stream card and select Add Value.
A popup will appear where you can set a new value
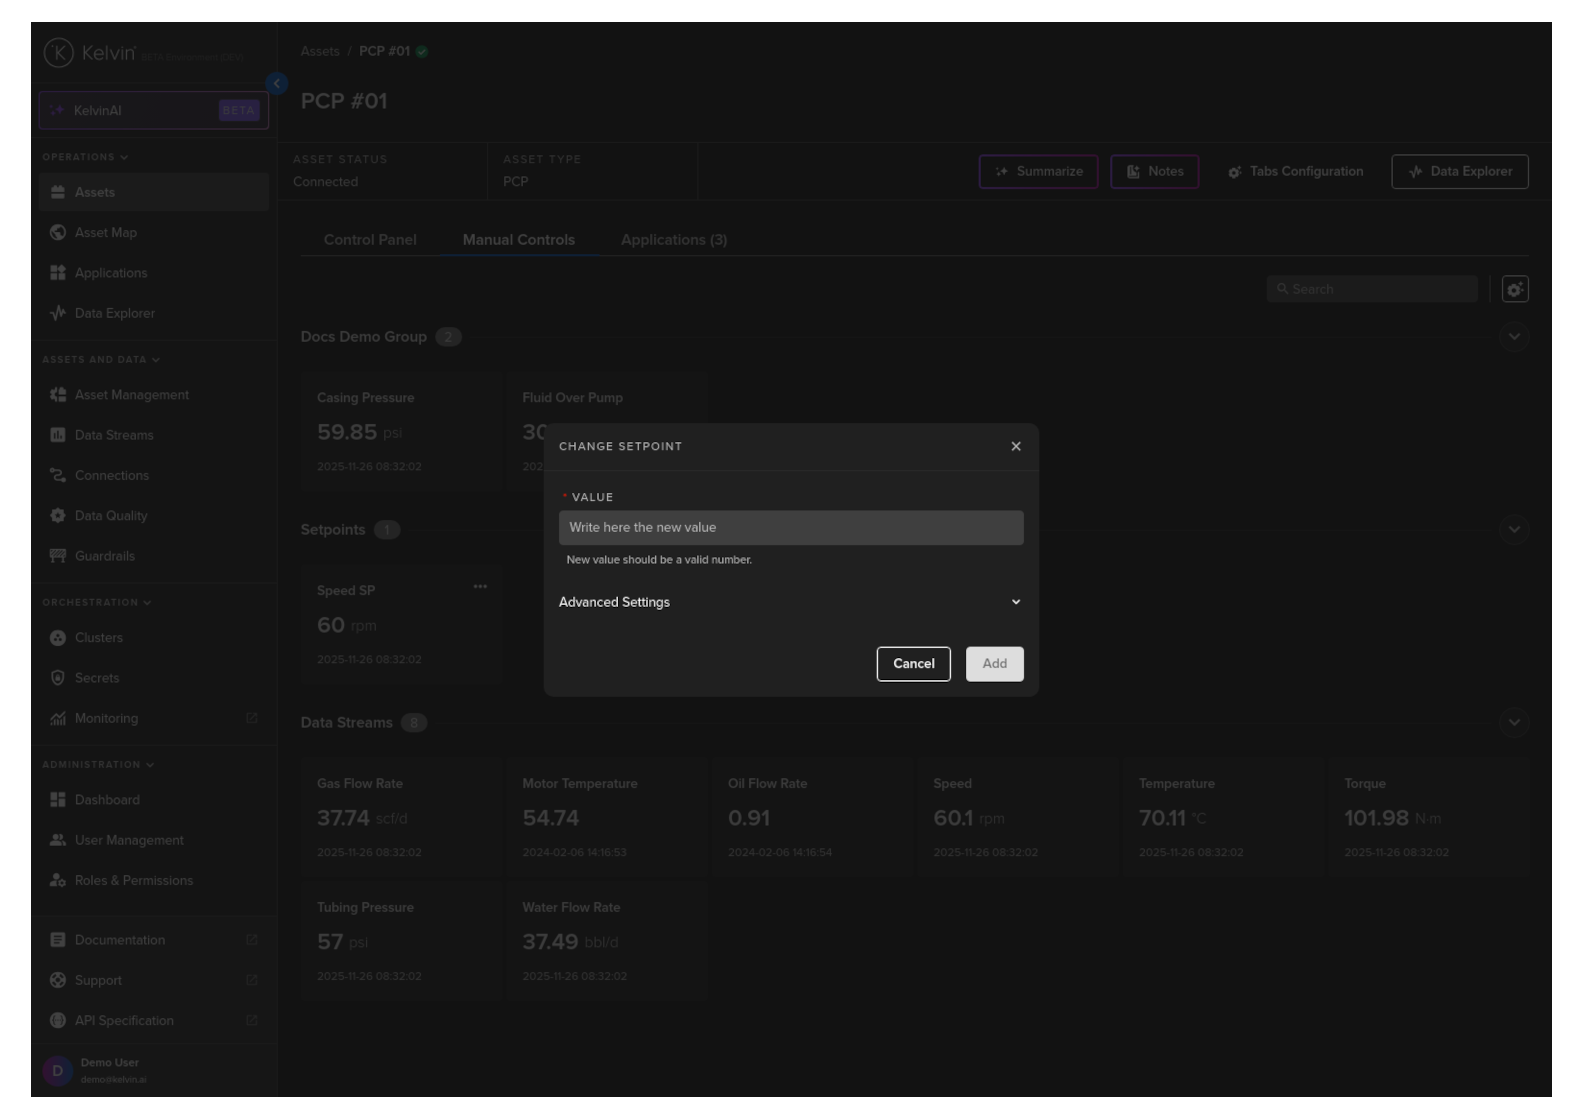
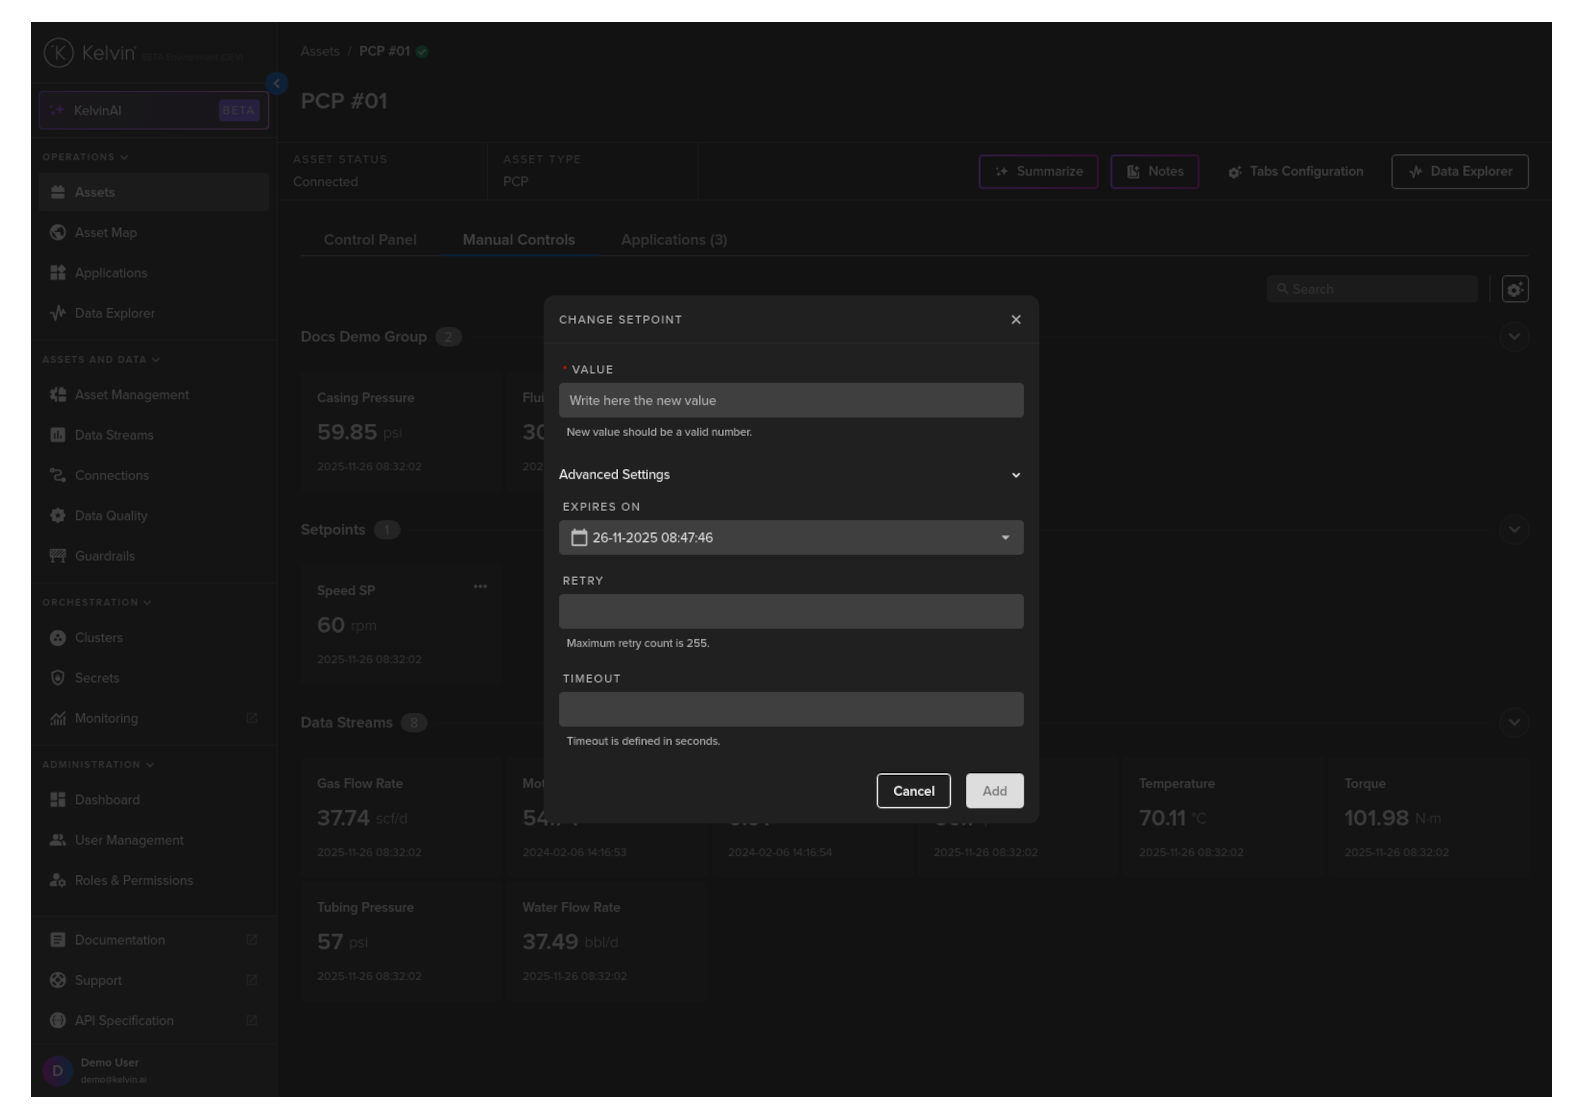
There are also some advanced settings which will override the default control change settings.
Unless instructed these settings normally do not need to be changed from the defaults.
Note
In advanced settings, if the selected expire time has already passed when you click Add, it is automatically reset to one minute after the click.
The Control Change Manager uses the Advanced Settings to determine how it attempts to write the value and confirm it on the Asset.
| Title | Description |
|---|---|
| Expires In | This is the amount of time allowed to try and change and validate the change on the Asset. After this it will fail and not try again. The Default is one minute. |
When finished click on the Add button to initiate the value change to the Asset.
You can then monitor the value card for the success or failure of the write to the Asset.
Note
A countdown timer is shown on the value card while Kelvin waits for the Asset to confirm the change.
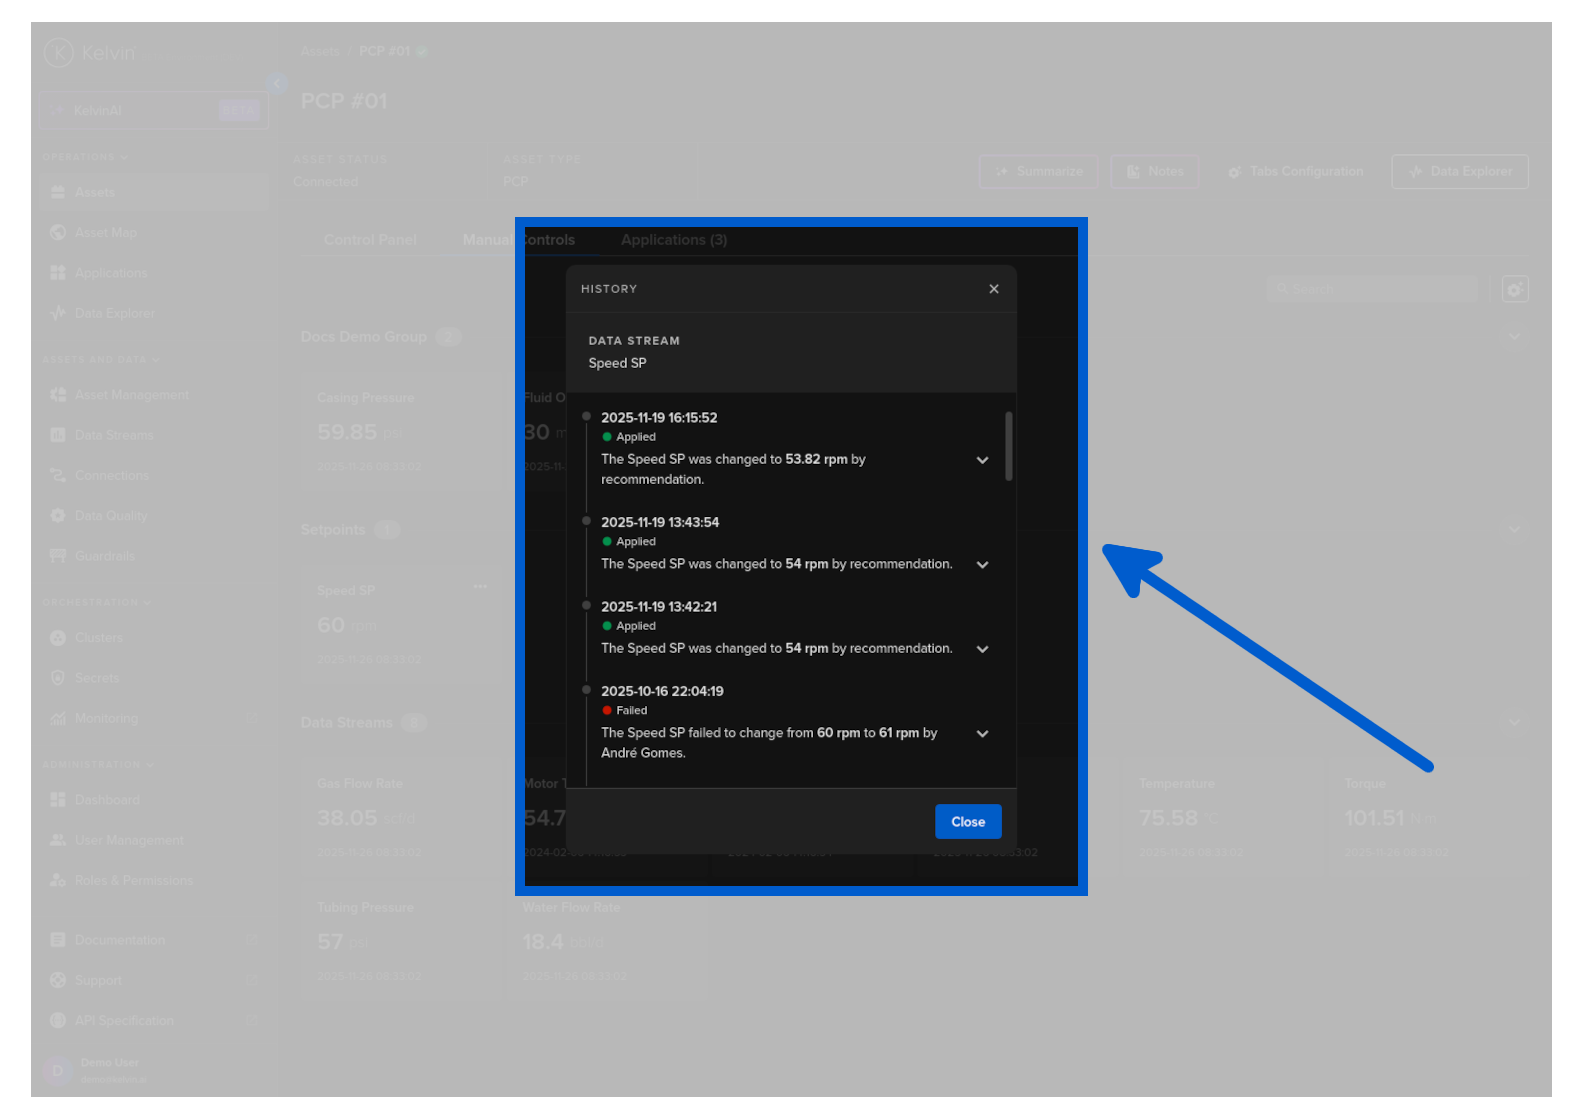
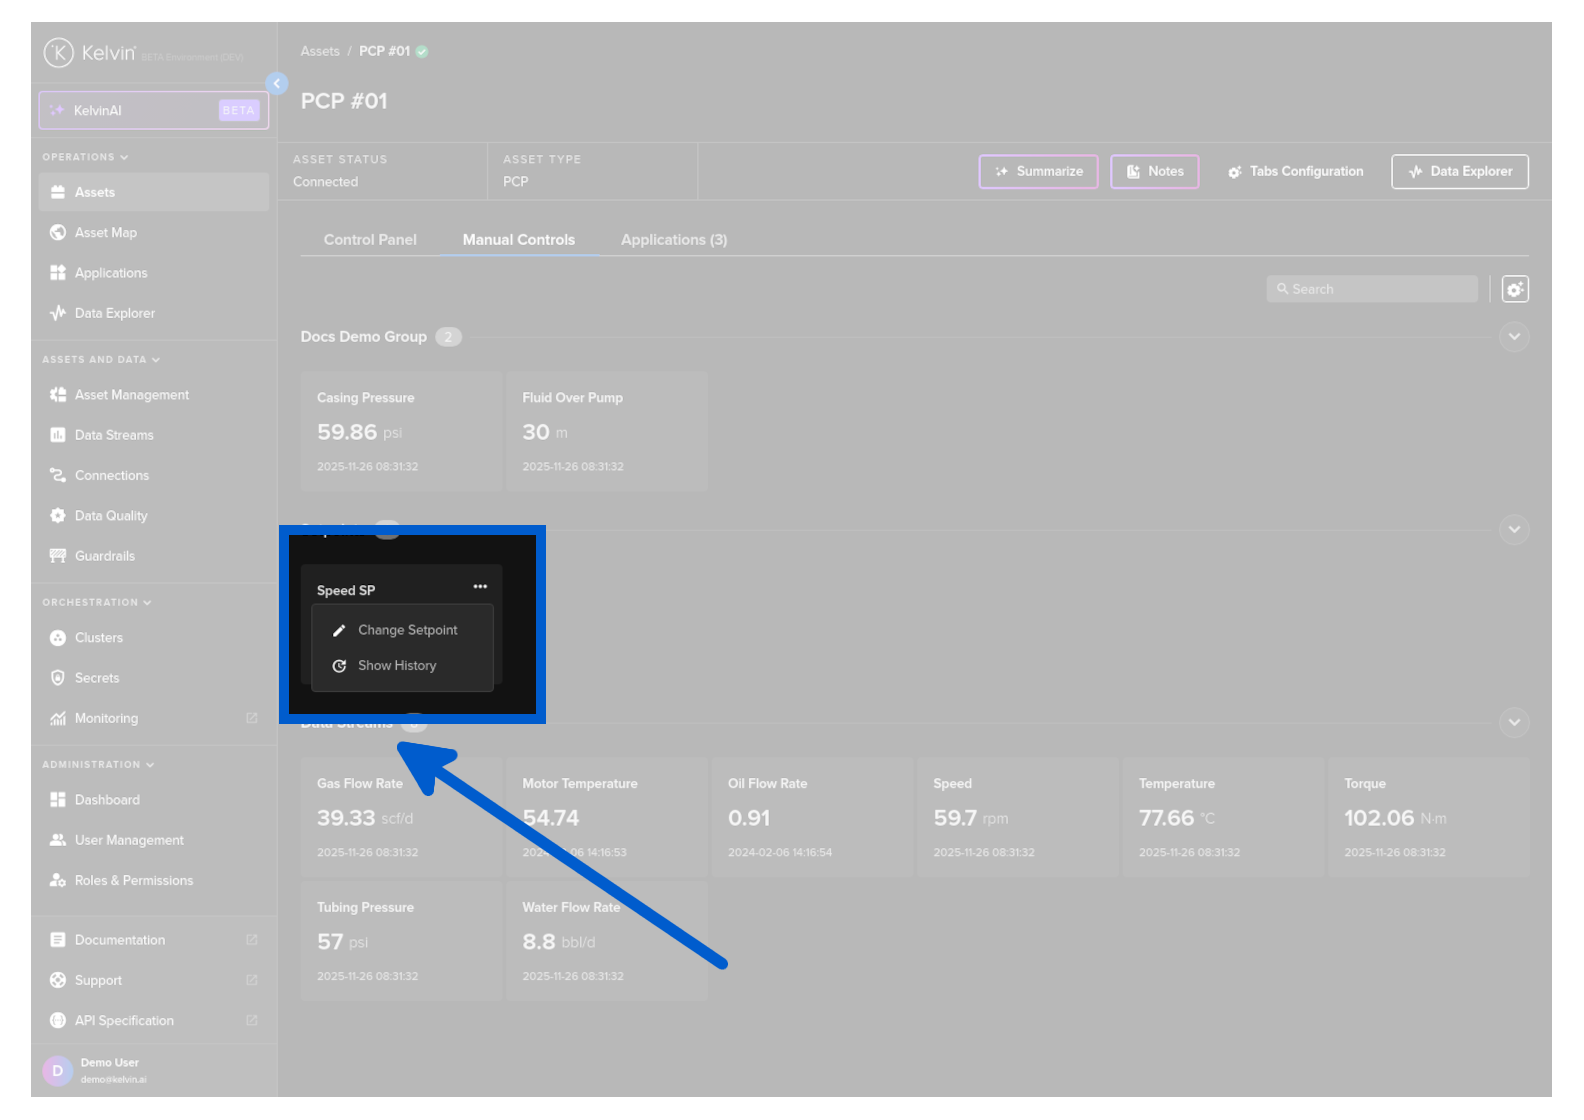
Control Change History
To see the history of Control Changes for a particular Asset / Data Stream pair, click on the hamburger menu in the card containing the data value of interest.
And then click on the Check History option. A side bar will appear on the right showing you the information of the full history of Control Changes.