Administration Dashboard
Overview
There is an administration dashboard to see an overview of the Kelvin Platform and its current performance.
Note
You can apply filters to see statistics only for information that matches the filter settings.
To see the dashboard, click on the Dashboard menu under Administration.
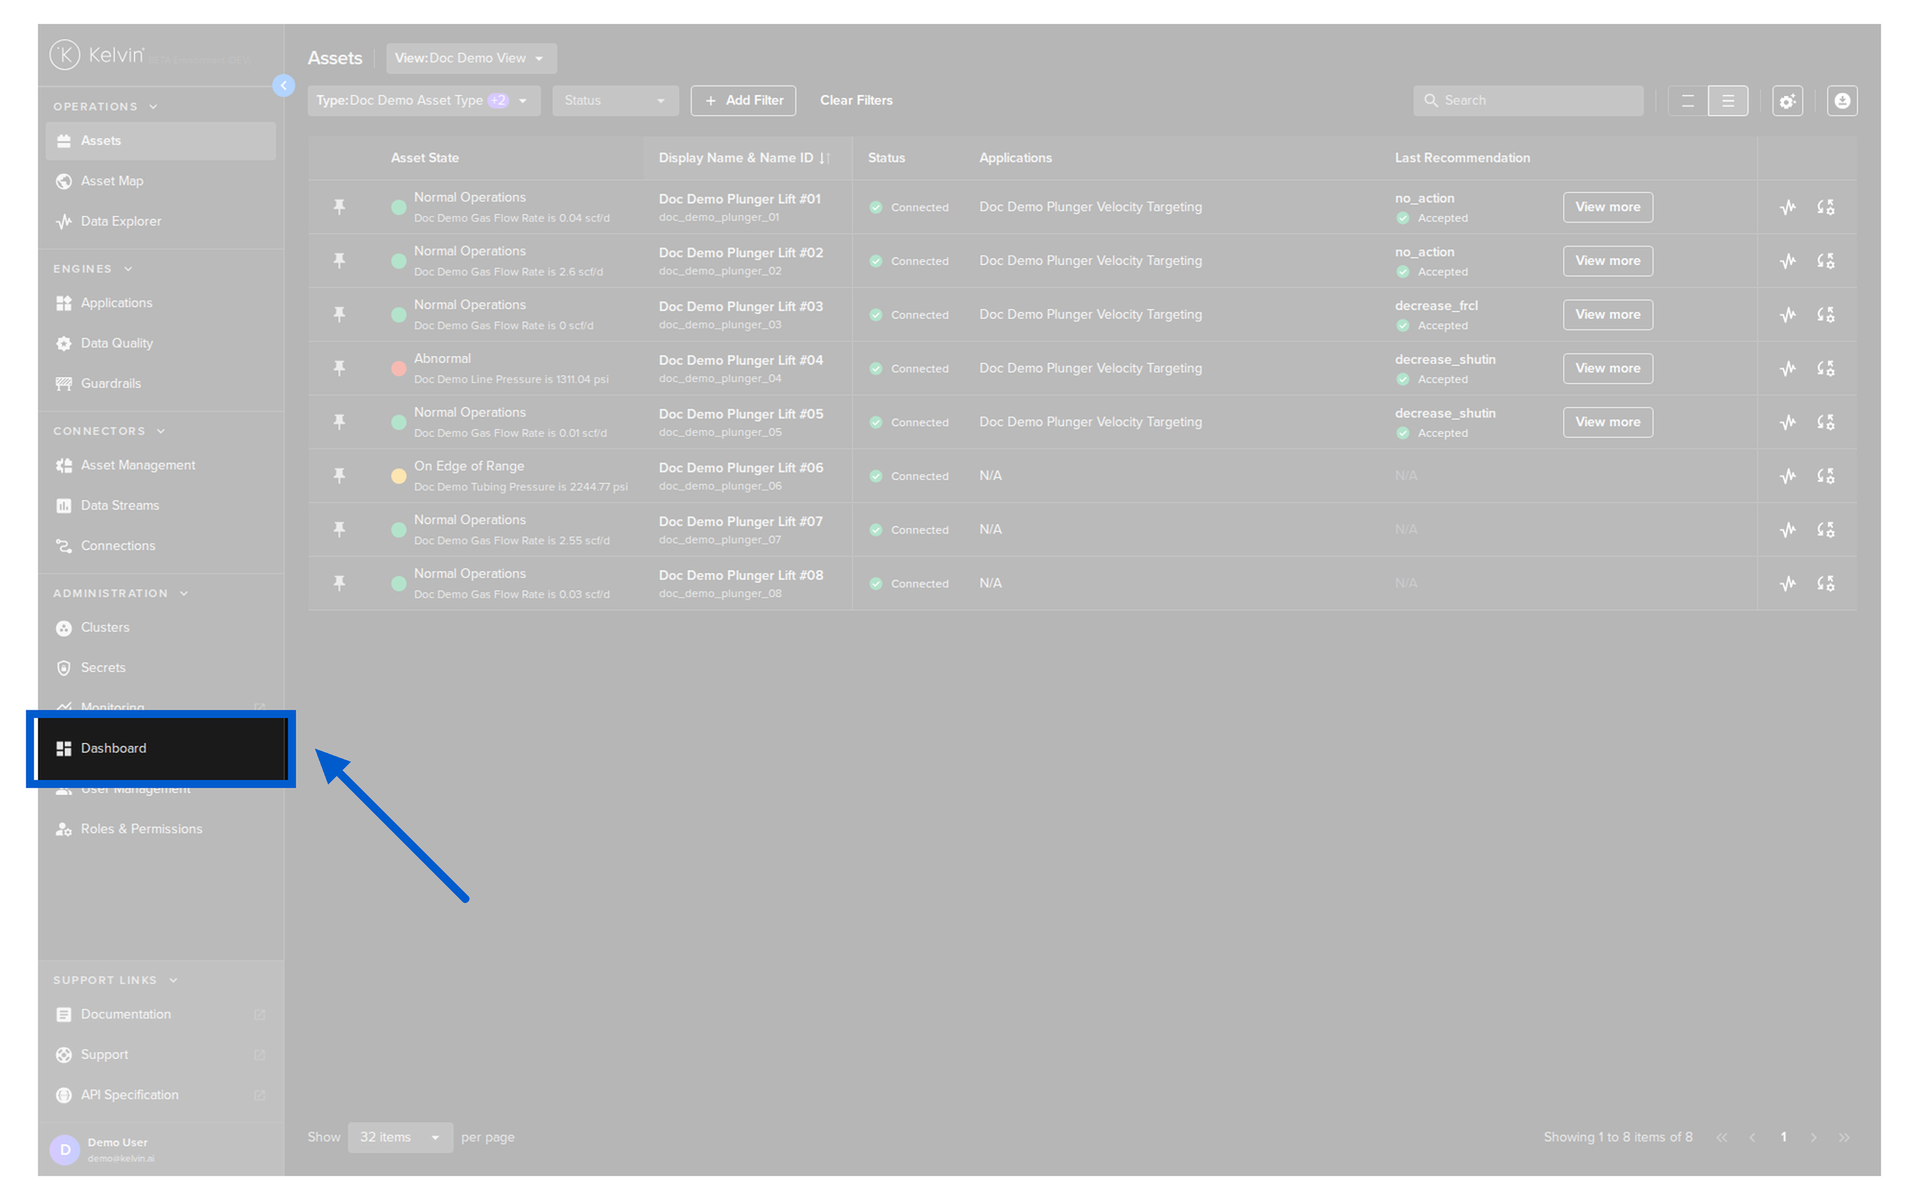
You will then see the Dashboard.
Note
This is a fixed Dashboard and Administrators cannot customize the contents.
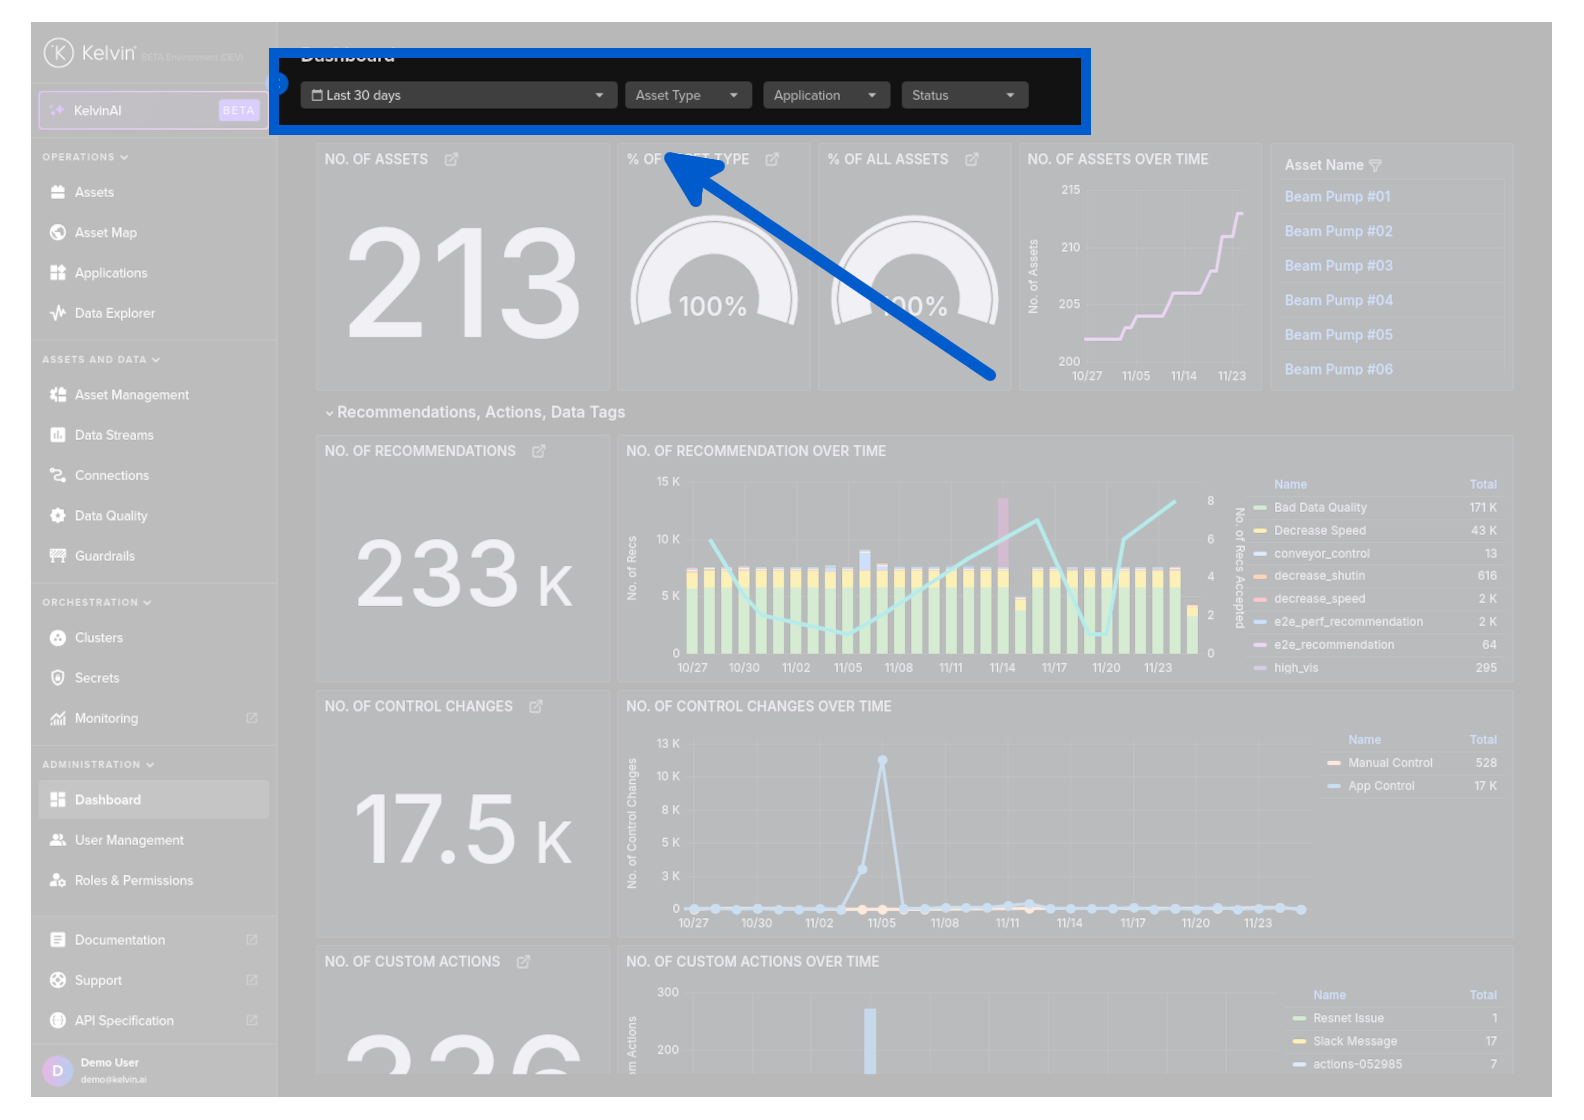
Filter
You can use the filters to limit the statistics to only the information relevant to your selection.
You have four options available;
- Time range
- Select Asset Types to include
- Select Applications to include
- Select Assets with only certain Asset Statuses.
Note
If you select multiple filters, the Kelvin Platform displays only the statistics that meet all selected criteria.
Available Statistics
The statistics are grouped into common themes.
- Assets
- Recommendations, Actions, Data Tags
- Apps
- Orchestration
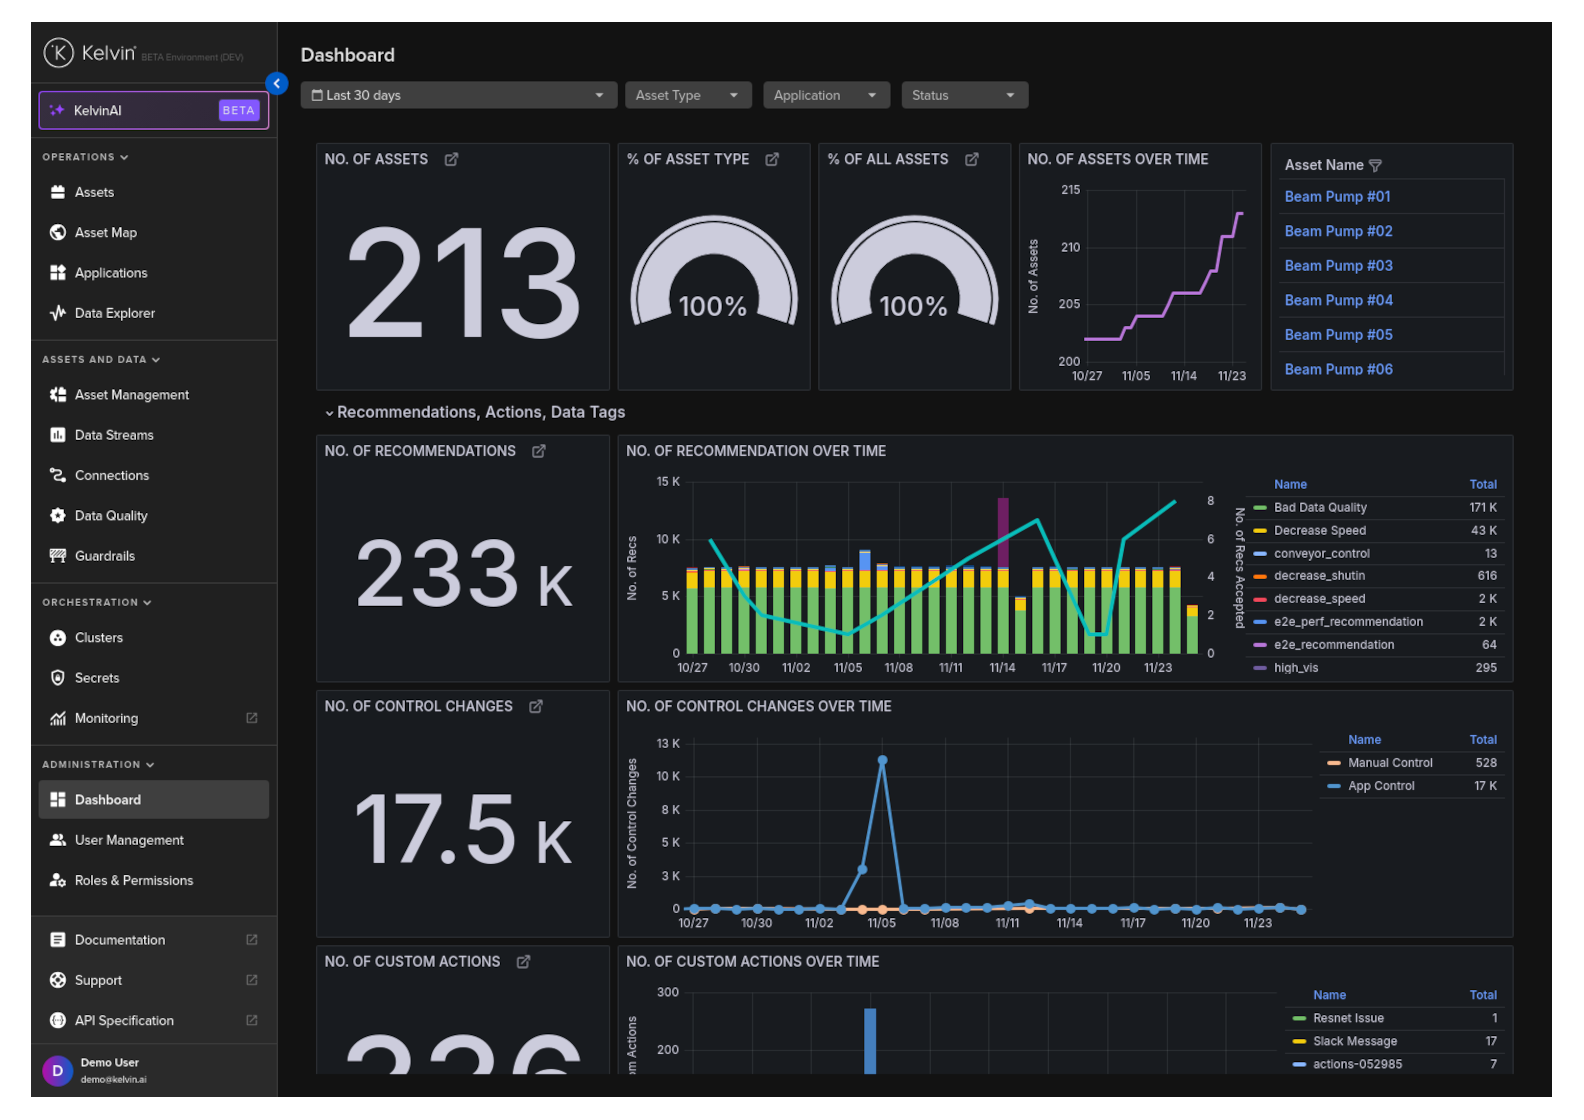
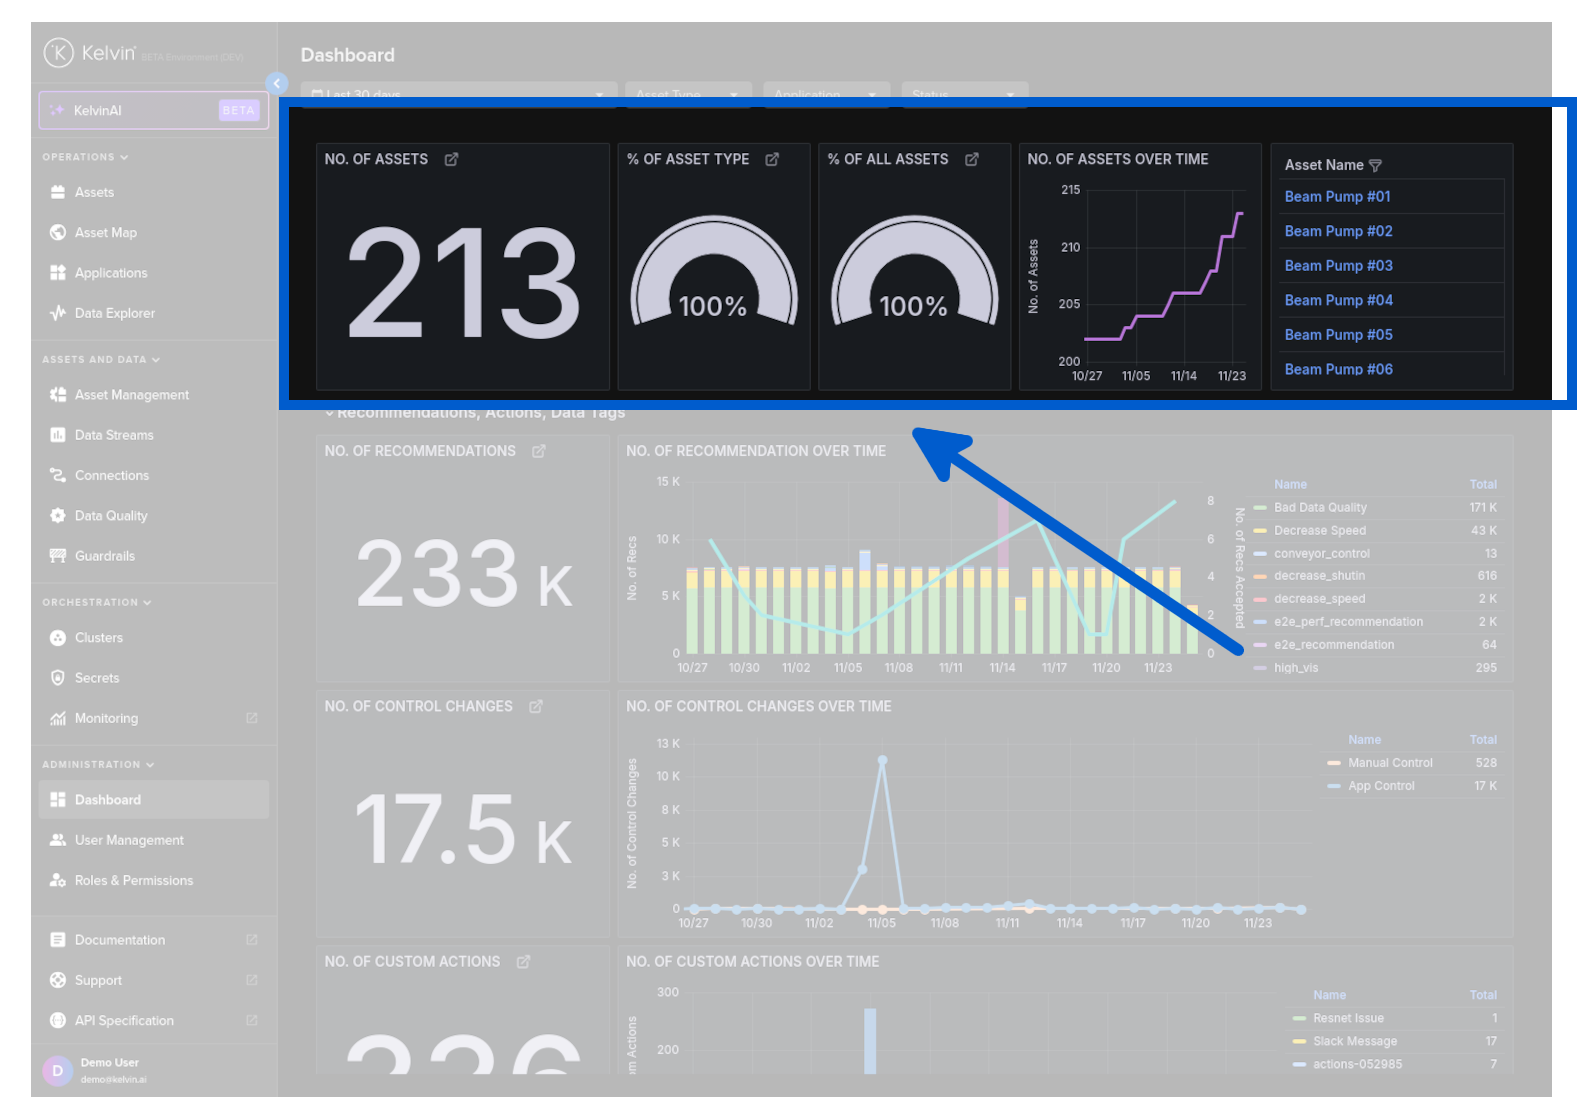
Assets
This gives you the general Asset information.
| Card Name | Description |
|---|---|
| No. of Assets | Total number of assets matching the current filter. |
| % of Asset Type | Percentage of all or filtered Asset Types in the statistics that match the selected Asset Status and Application filters. |
| % of All Assets | Percentage of filtered assets compared to all assets on the Kelvin Platform. |
| No. of Assets over Time | Historical weekly count of assets matching the current filter. |
| Asset Name | List of assets in the current filter. Click an asset to view its details in the Asset section. |
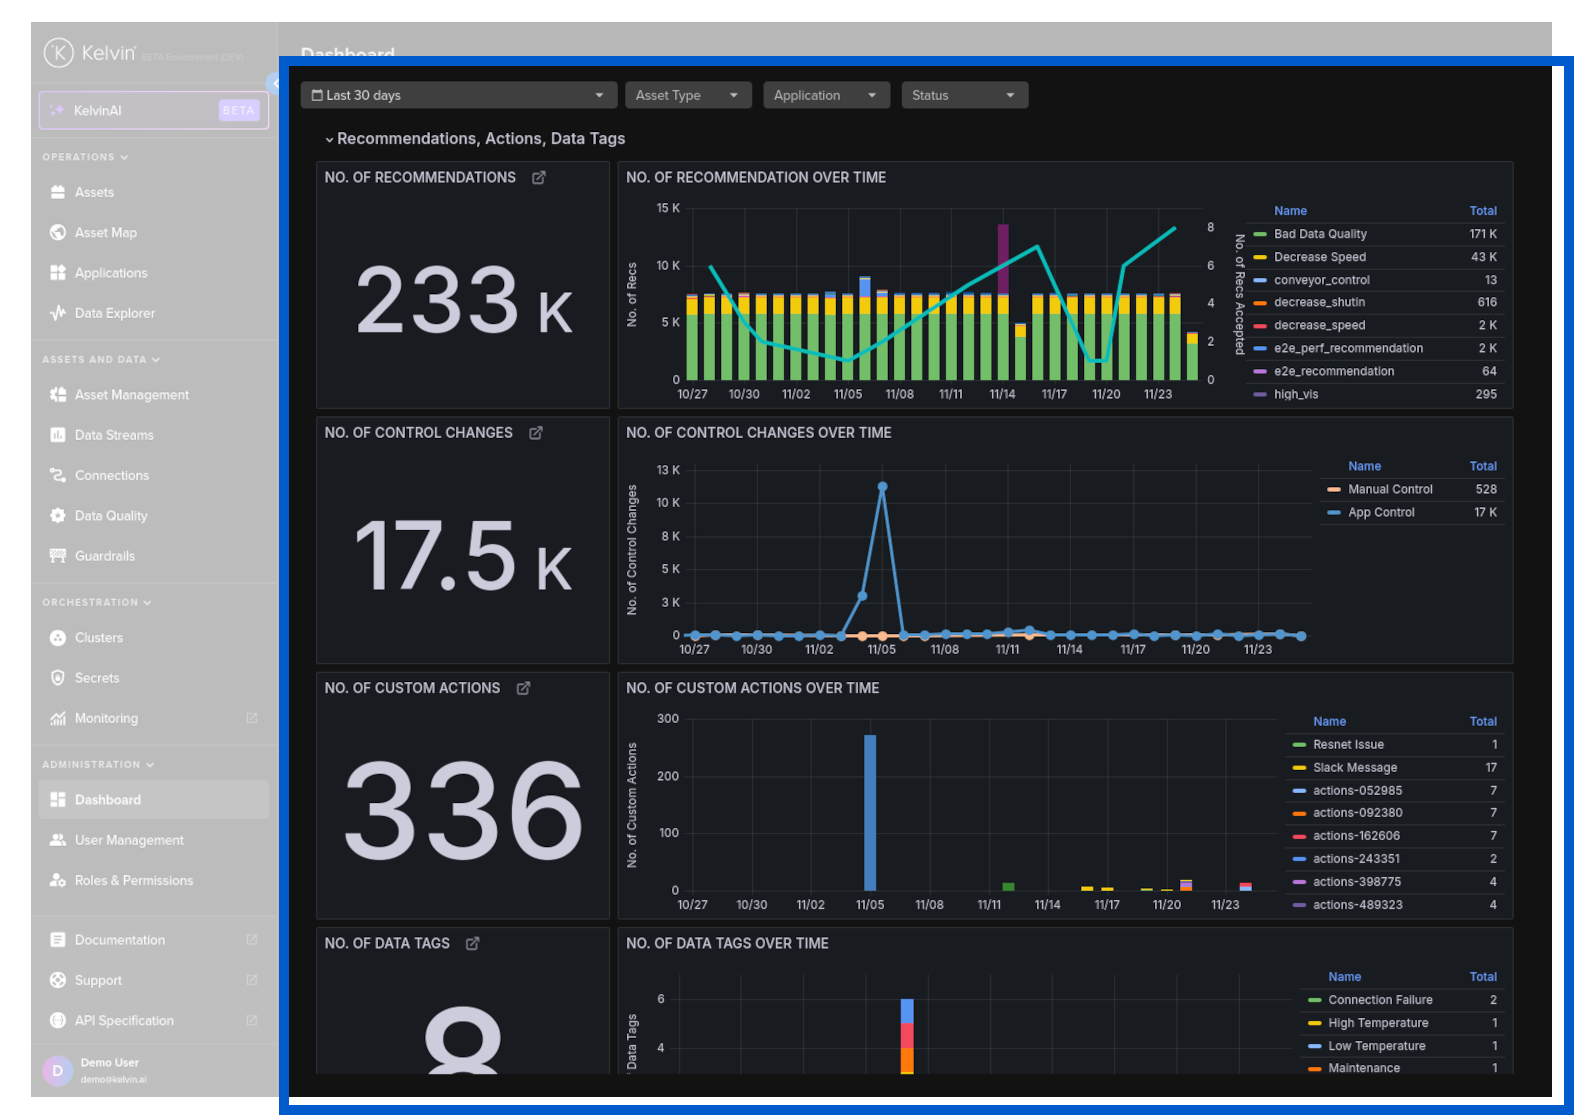
Recommendations, Actions, Data Tags
| Card Name | Description |
|---|---|
| No. of Recommendations | Displays the total number of recommendations that match the current filter. |
| No. of Recommendation Over Time | Shows the trend of recommendations over time for assets matching the current filter. |
| No. of Control Changes | Indicates the total number of control changes that match the current filter. |
| No. of Control Changes Over Time | Plots control change activity over time for assets matching the current filter (currently no data). |
| No. of Custom Actions | Displays the total count of custom actions that match the current filter. |
| No. of Custom Actions Over Time | Shows custom action activity trends over time for assets matching the current filter (currently no data). |
| No. of Data Tags | Displays the total number of data tags that match the current filter. |
| No. of Data Tags Over Time | Shows the number of data tags over time for assets matching the current filter (currently no data). |
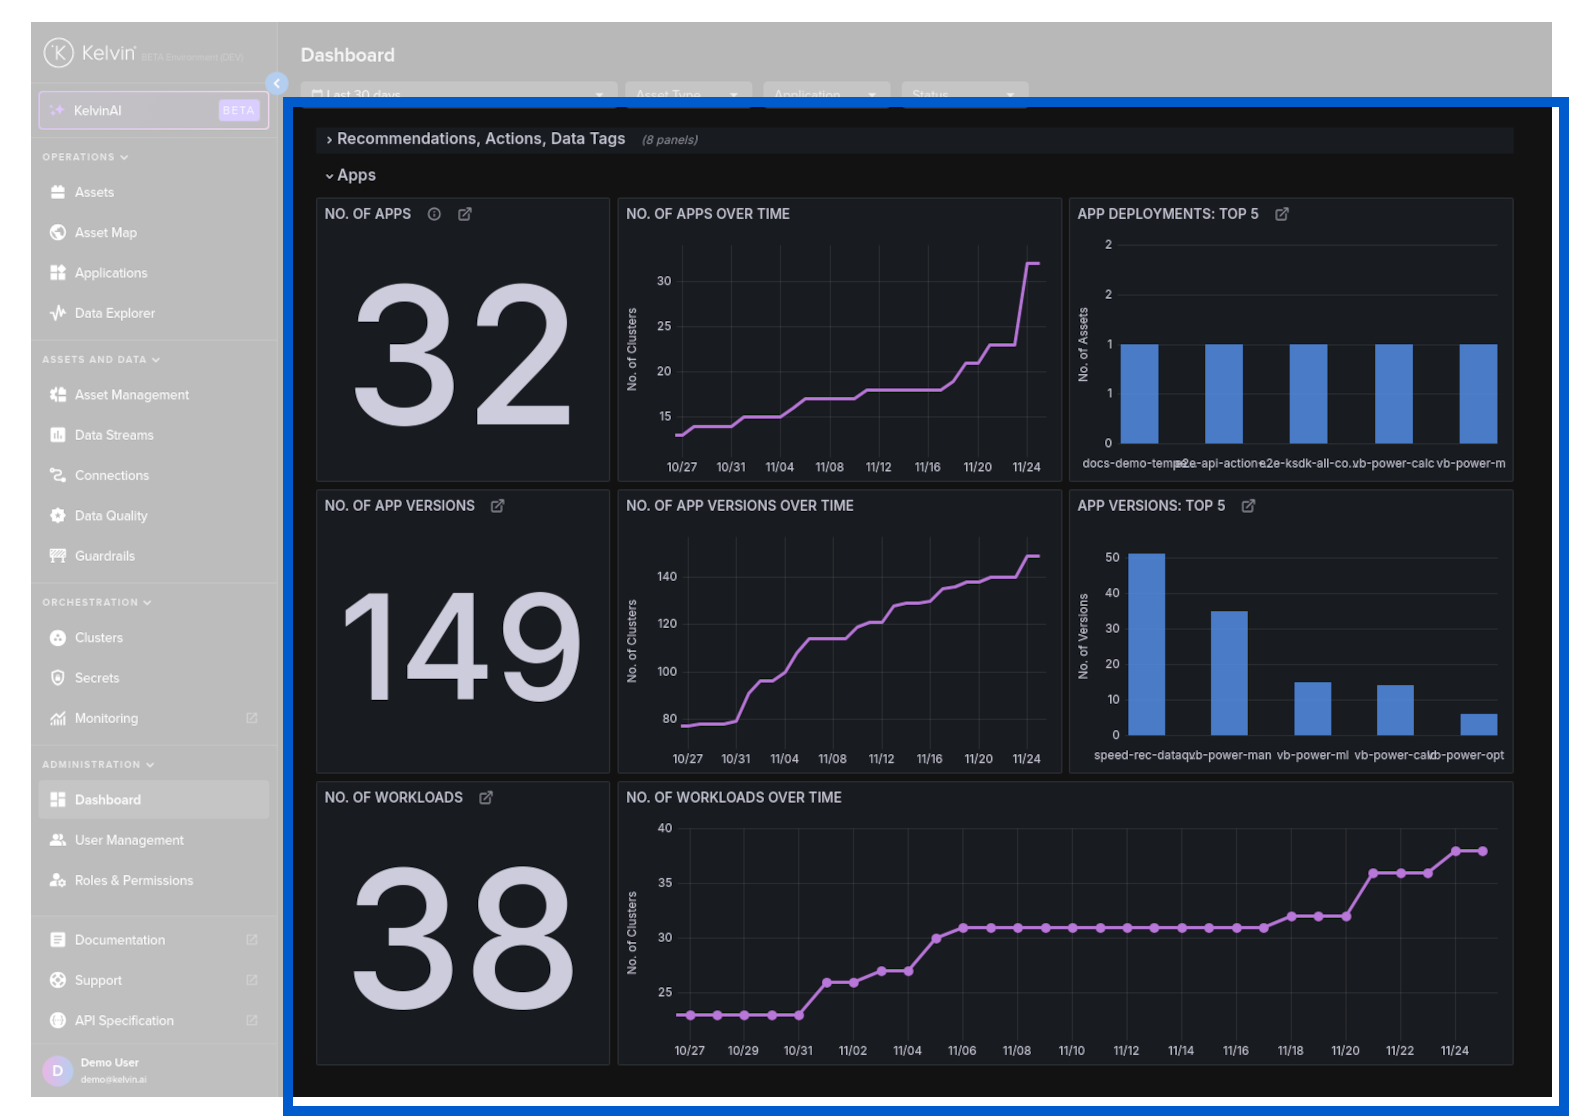
Apps
| Card Name | Description |
|---|---|
| No. of Apps | Total number of apps matching the current filter. |
| No. of Apps Over Time | Historical count of apps matching the current filter. |
| App Deployments: Top 5 | Top 5 apps by number of deployments within the current filter. |
| No. of App Versions | Total number of app versions matching the current filter. |
| No. of App Versions Over Time | Historical count of app versions matching the current filter. |
| App Versions: Top 5 | Top 5 apps by version count within the current filter. |
| No. of Workloads | Total number of workloads matching the current filter. |
| No. of Workloads Over Time | Historical count of workloads matching the current filter. |
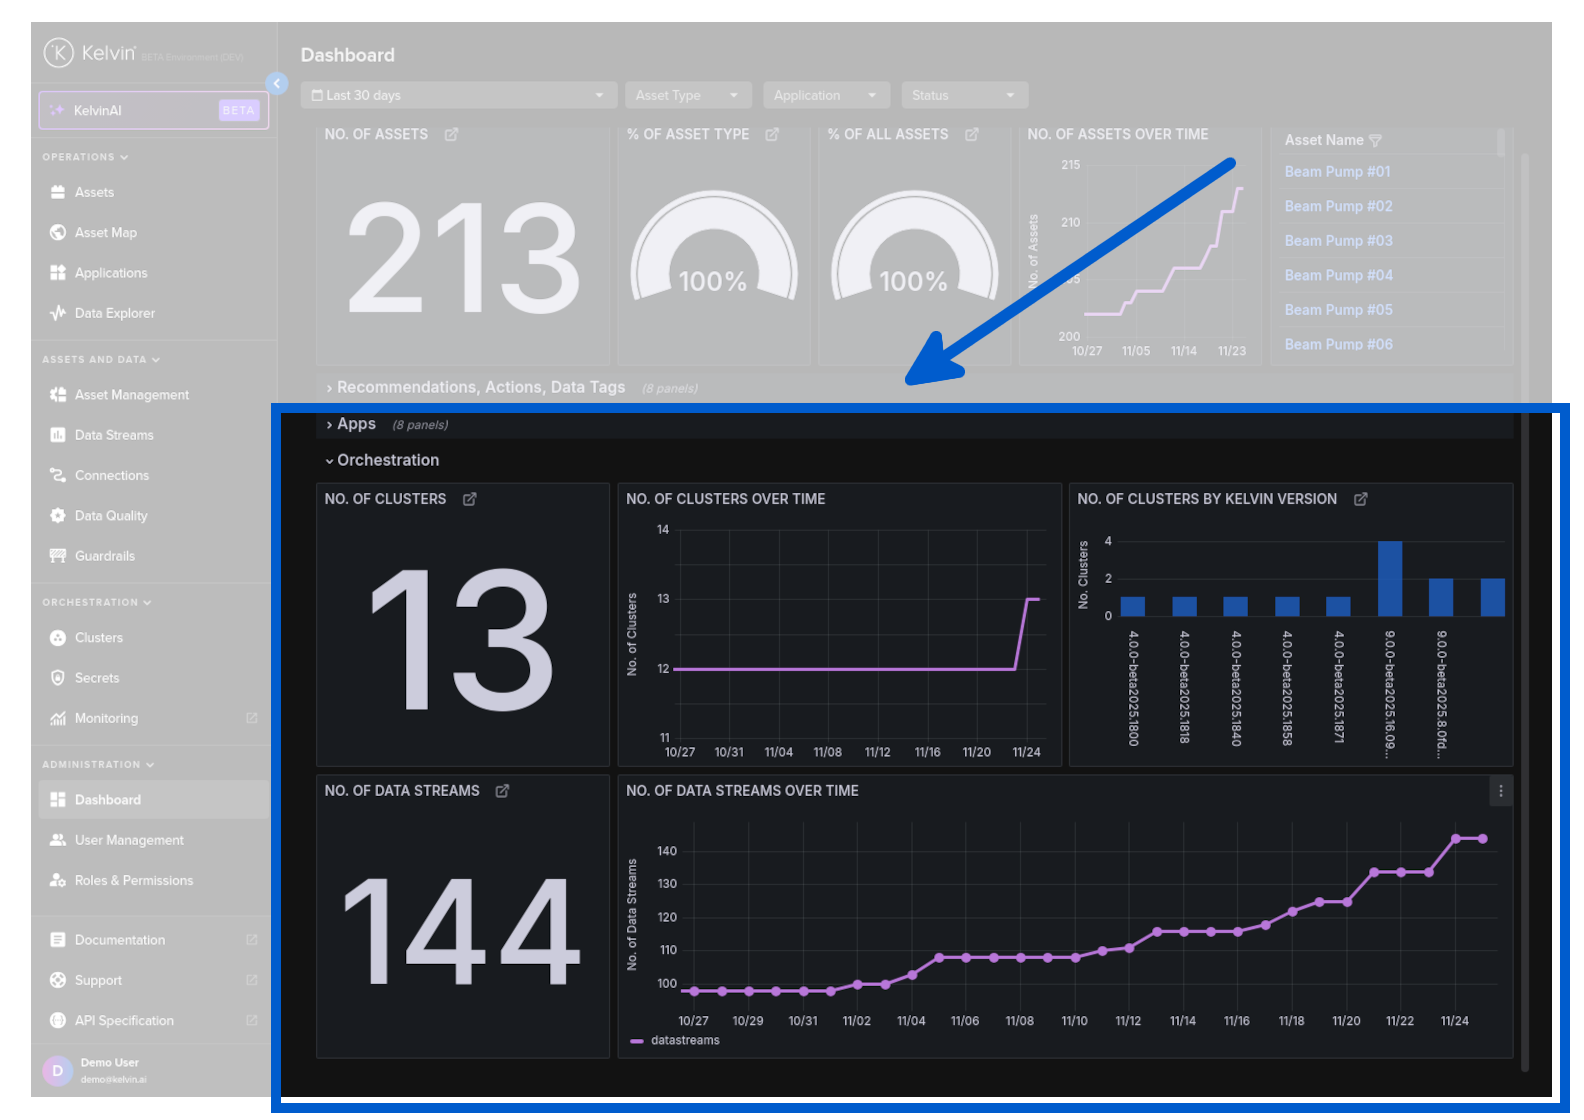
Orchestration
| Card Name | Description |
|---|---|
| No. of Clusters | Total number of clusters matching the current filter. |
| No. of Clusters Over Time | Historical count of clusters matching the current filter. |
| No. of Clusters by Kelvin Version | Distribution of clusters by Kelvin version within the current filter. |
| No. of Data Streams | Total number of data streams matching the current filter. |
| No. of Data Streams Over Time | Historical count of data streams matching the current filter. |