Tags in Data Explorer
On this page you will go through understanding how to create Tags and view them in activity lane in the Data Explorer.
Overview
Tags are a way for you to attach useful information and links to the Asset in Data Explorer at a defined time point or time range.
Information you can save with the time point / time range tag;
- Tag name
- Notes up to 256 characters long
- Multiple Data Stream names
- One Kelvin SmartApp™ name
This information can also be retrieved programmatically by Developers and Data Scientists if required, so this is a good method of tagging significant events for your records or for feedback to other teams.
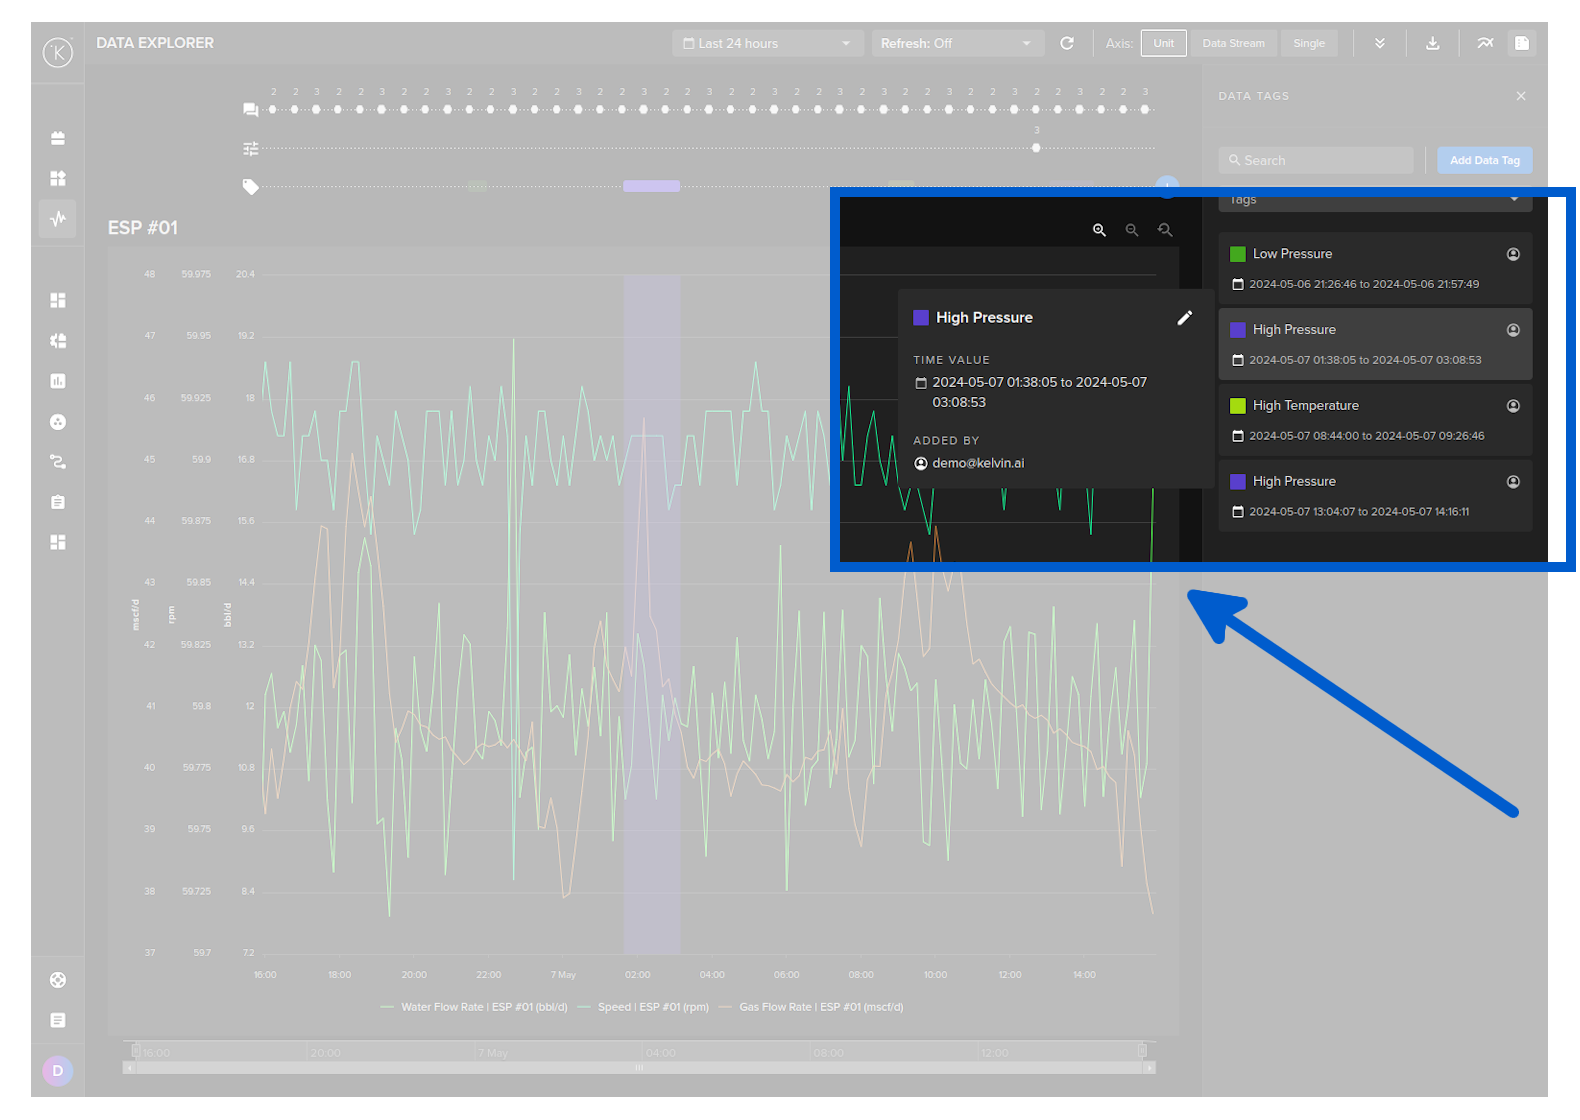
Viewing Tags
Tags are shown in identifiable colors in the bottom Lane (if enabled).
Clicking on a Tag point or Tag range color, the Tag sidebar will automatically open up on the right hand side and the relevant tag information will be shown in a popup.
Tags are also viewable in a list by clicking on the tag icon in the top right hand corner.
![]()
This will open the right sidebar with all Tags that are within the current x-axis time range.
You can click on any tag to highlight it on the graph and to show full information recorded with the tag in a popup.
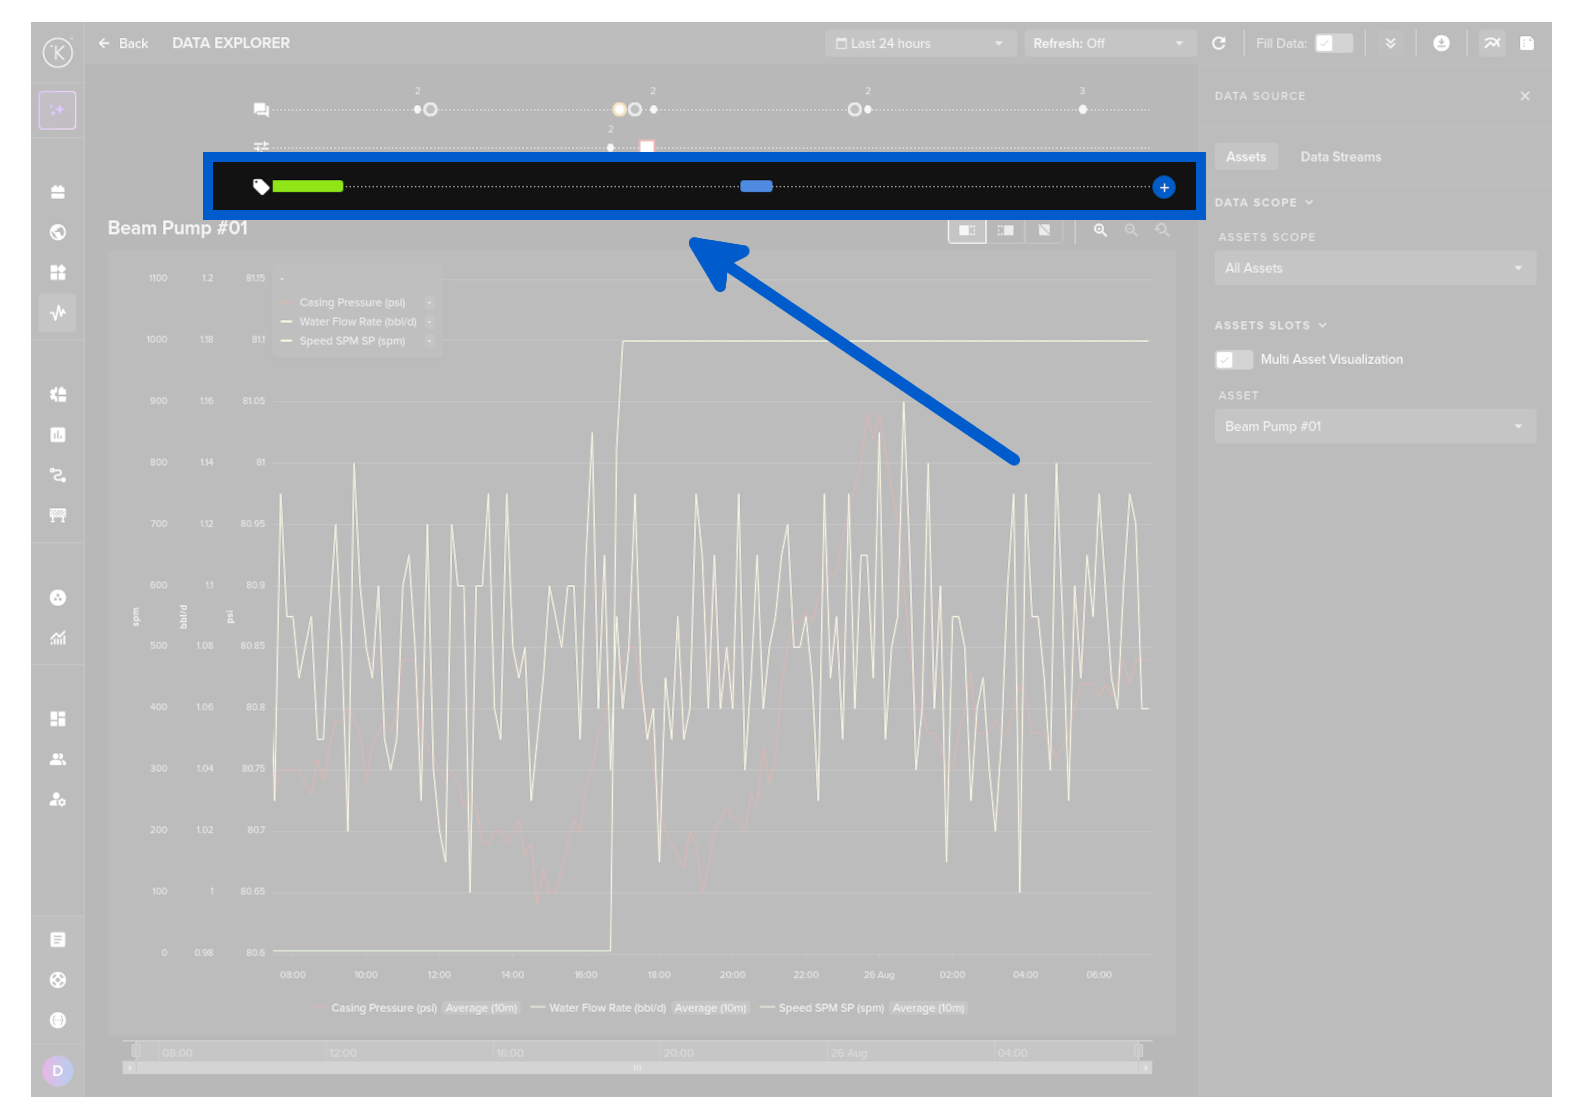
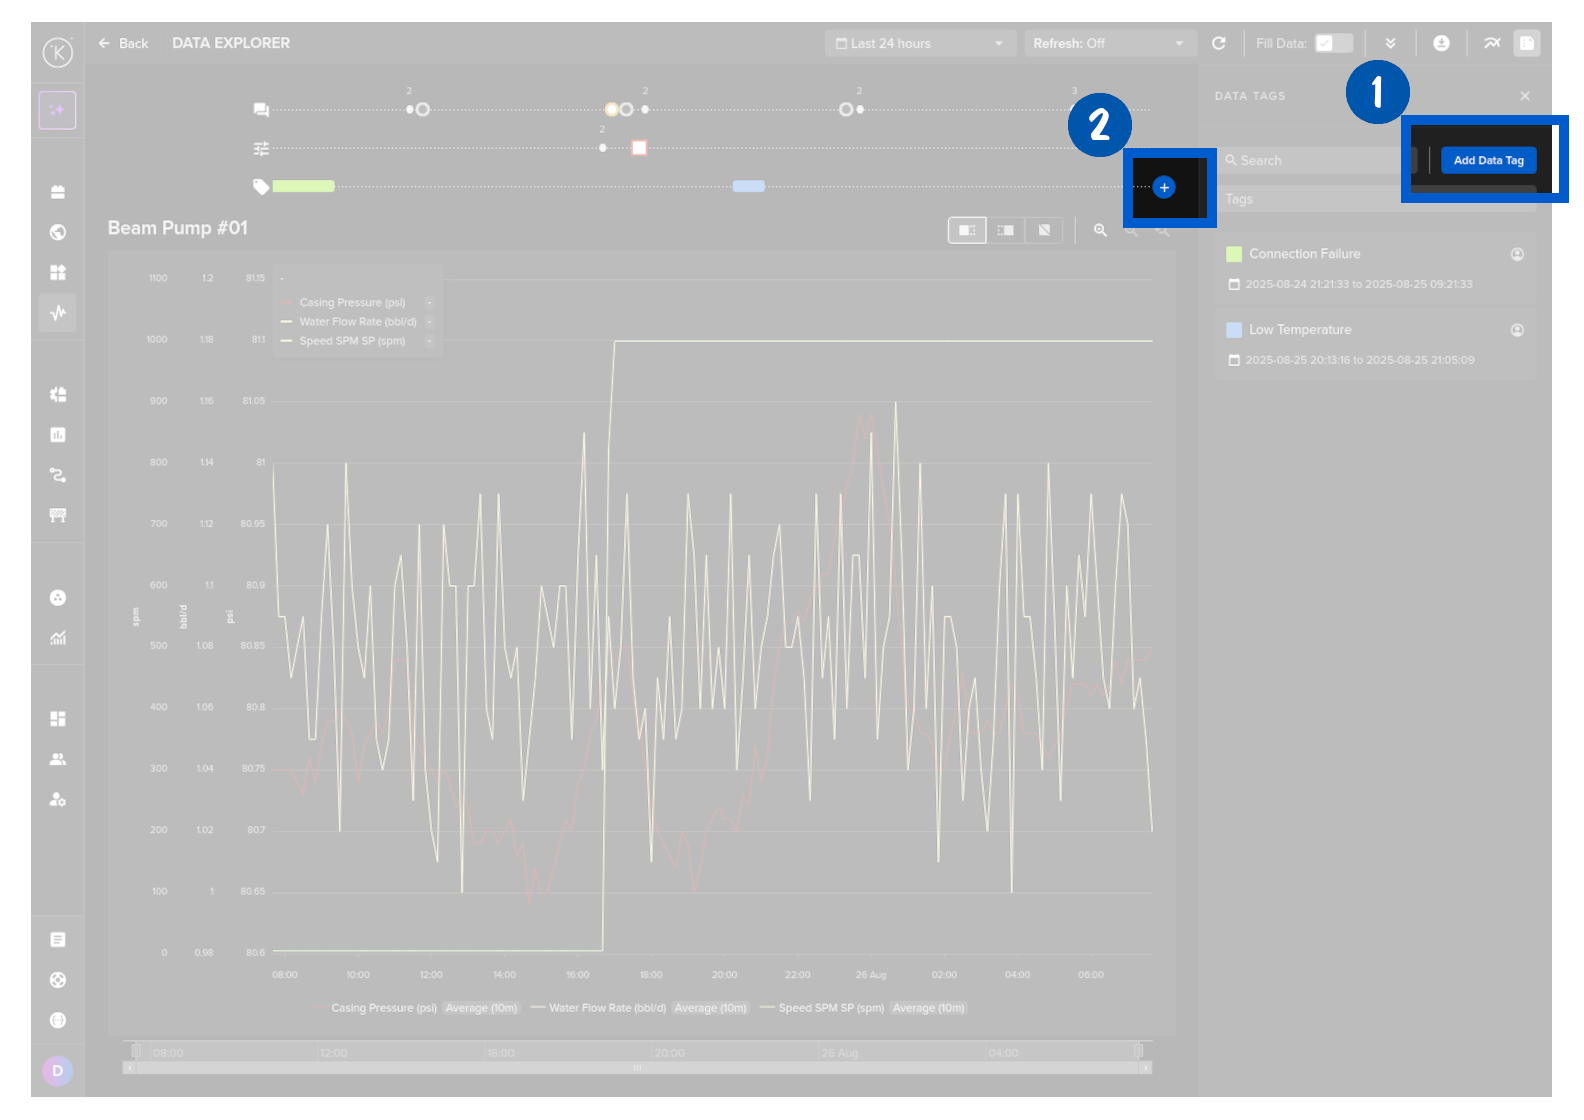
Adding Tags
You can add new tags in two ways;
- Click on the Tag icon in the top left corner and then click on the Add Insight button or
- By clicking on the plus icon in the tags lane.
You can not add tags if you are in Multiple Asset view.
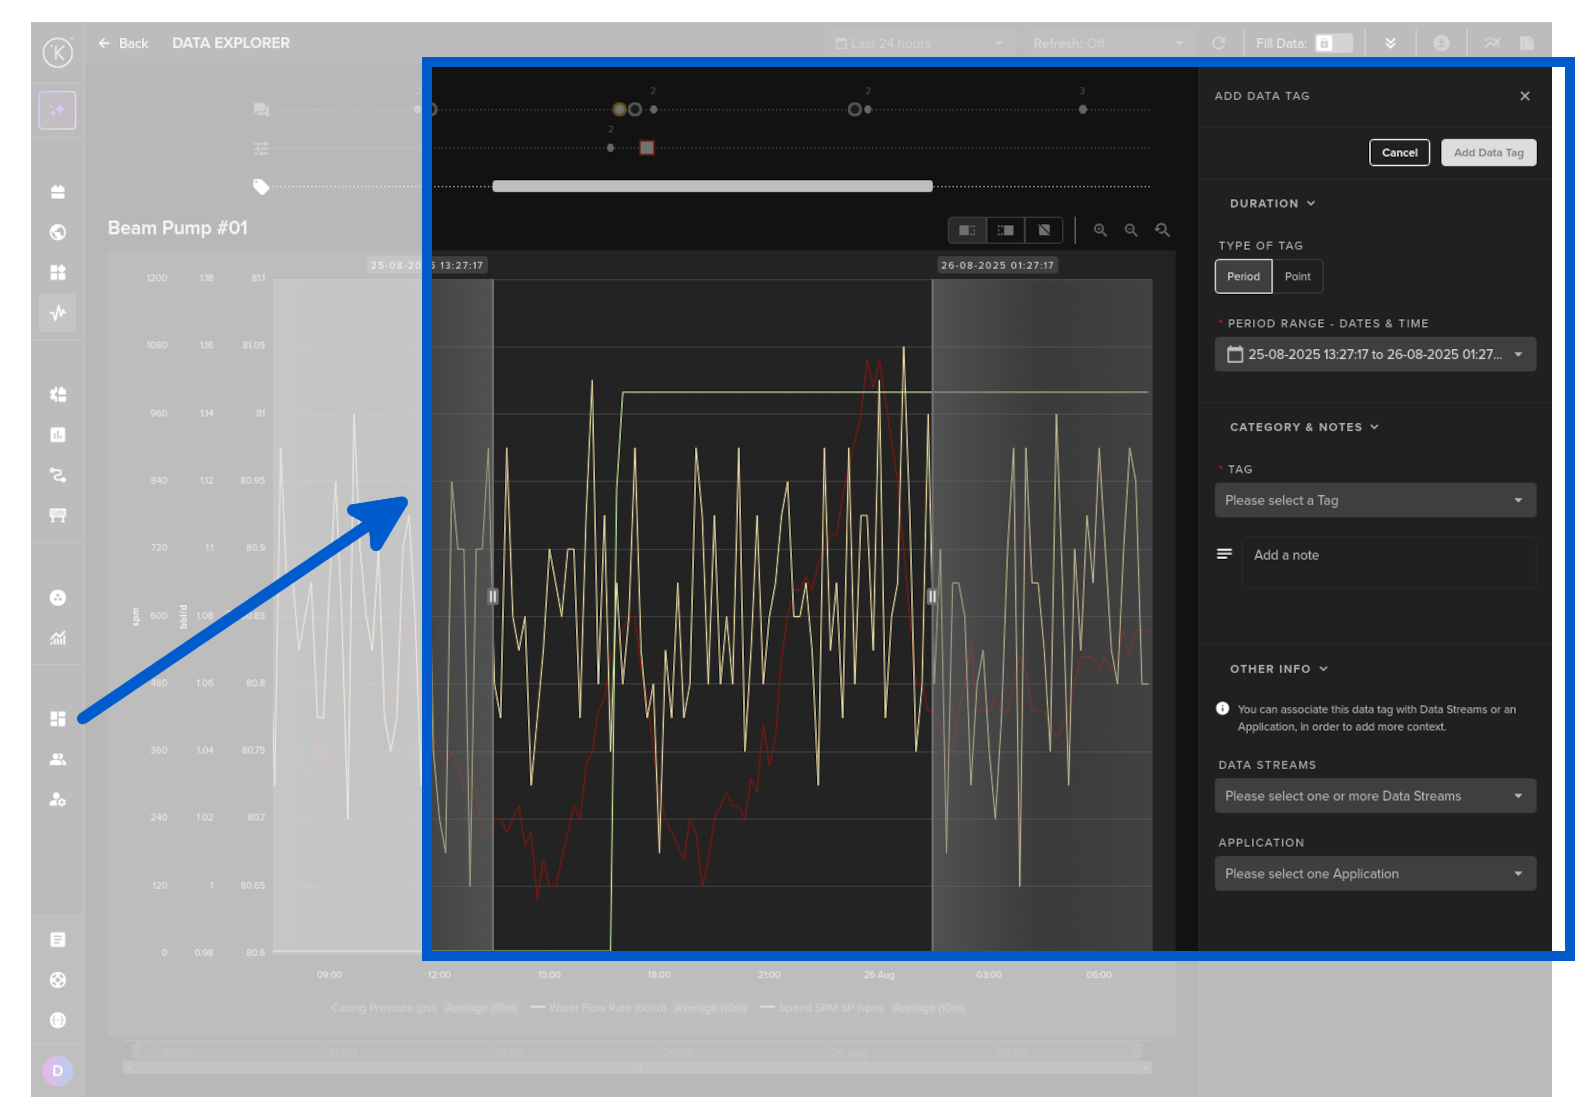
The Create Insight panel has the following fields.
| Field | Description |
|---|---|
| Describe your Insight | Select an existing tag name from the list or create a new one. The color swatch on the left lets you assign a color to the tag. |
| Add More Details | Expandable section to add a comments section with additional context for the tag event. |
| Period / Point | Select whether the tag covers a time range (Period) or a single moment (Point). Drag the markers on the graph to define the exact period or point. |
| Data Streams | Data streams associated with this tag. By default all data streams currently shown in the Data Explorer are selected. |
Once complete, click Create Insight.
Edit Tags
To edit a Tag event, open the Tag list on the right hand sidebar and click on a Tag event.
In the popup click on the edit pencil icon.
![]()
Update the information and click Save.
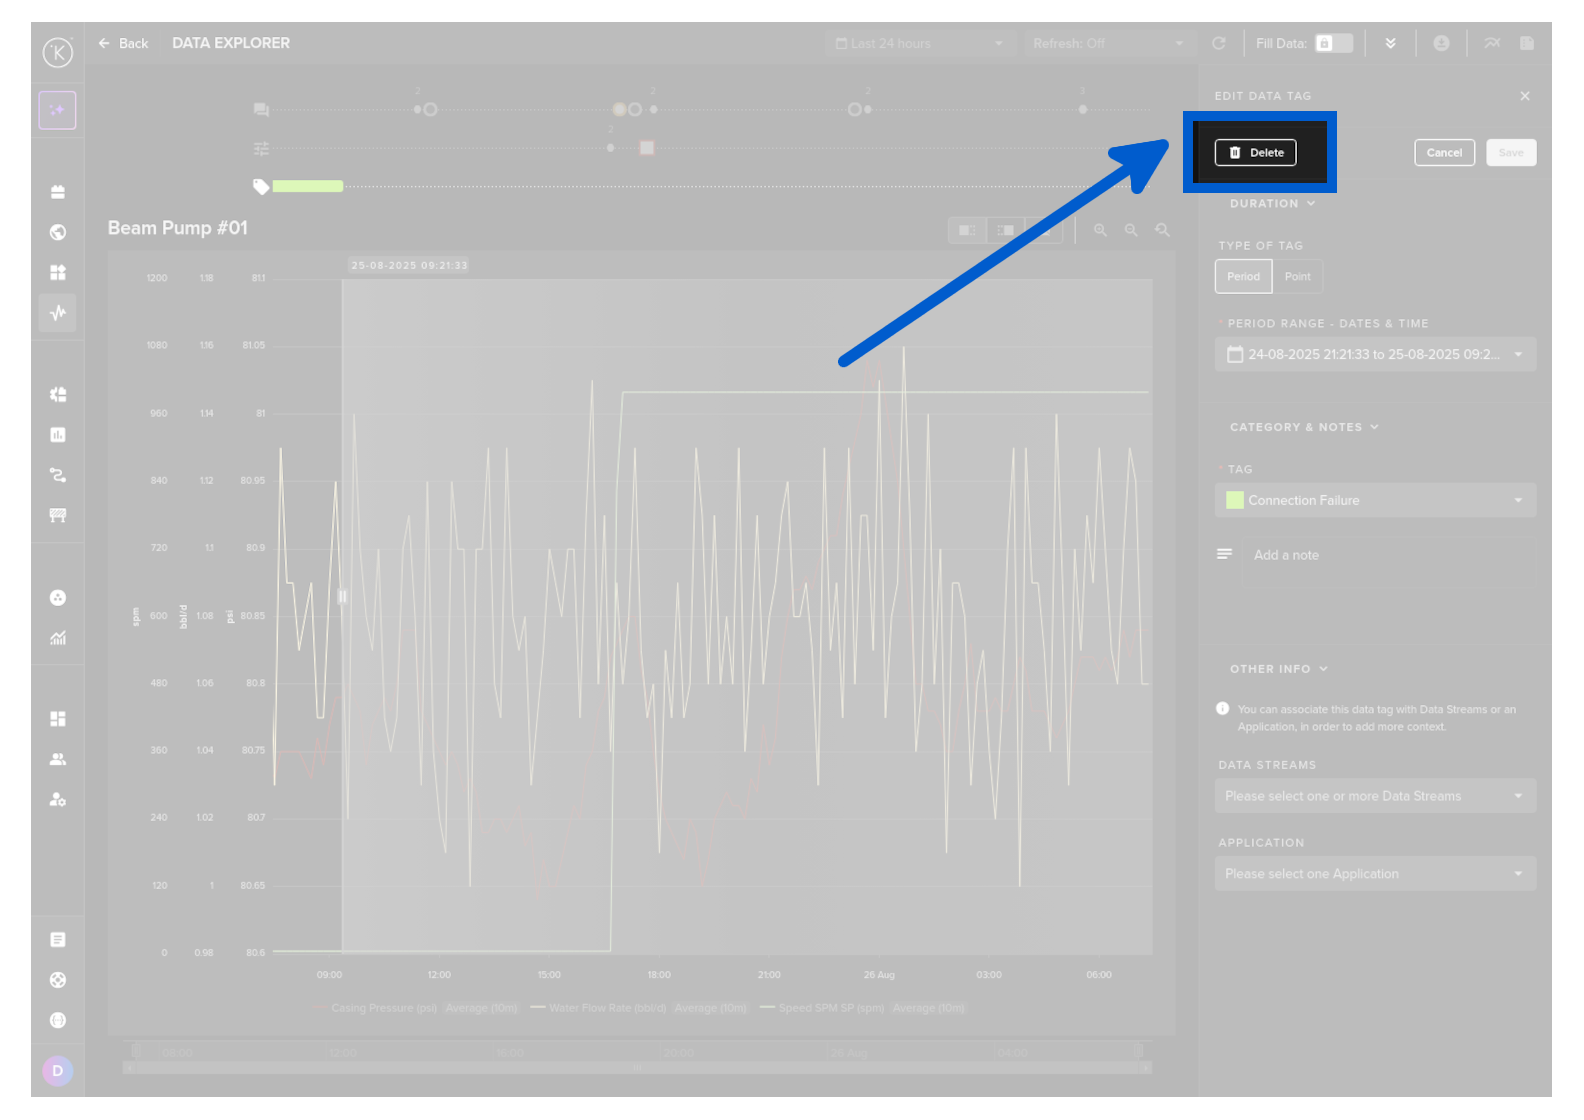
Delete Tags
To delete a Tag event, open the Tag list on the right hand sidebar and click on a Tag event.
In the popup click on the edit pencil icon.
![]()
Click the Delete button.
There is no confirmation warning. The Tag is immediately and permanently deleted, so ensure this action before pressing the button.