Stream Data
This tutorial is delivered both as a video tutorial and a written tutorial for you to choose which medium suits you.
A tutorial example to import your assets and data stream definitions and then seamlessly connect to your simulation data using the Kelvin CSV Publisher via Connections.
This demonstration video was done in v5.9.
There may be slight differences with the latest version.
Check the latest documentation for the specific tasks should any feature not quite work as expected.
It takes only three simple steps;
- Import your assets.
- Import your Data Streams.
- Connect and Stream Data.
Watch this tutorial performed in real time in less than 6 minutes.
When getting started with Kelvin Platform, the first steps to take is to add your assets and data streams to the Kelvin Cloud. You will use these to define and organize your industrial operational data into the cloud database.
Once setup you can then use your existing historical data to populate the cloud database and use it to test your applications.
So, let's dive in and show you how fast and easy the setup can be by first logging into the Kelvin Platform and going step by through the process.
1. Import your Assets
When dealing with large numbers of assets, it is much easier to make an excel sheet of your assets and import them into Kelvin.
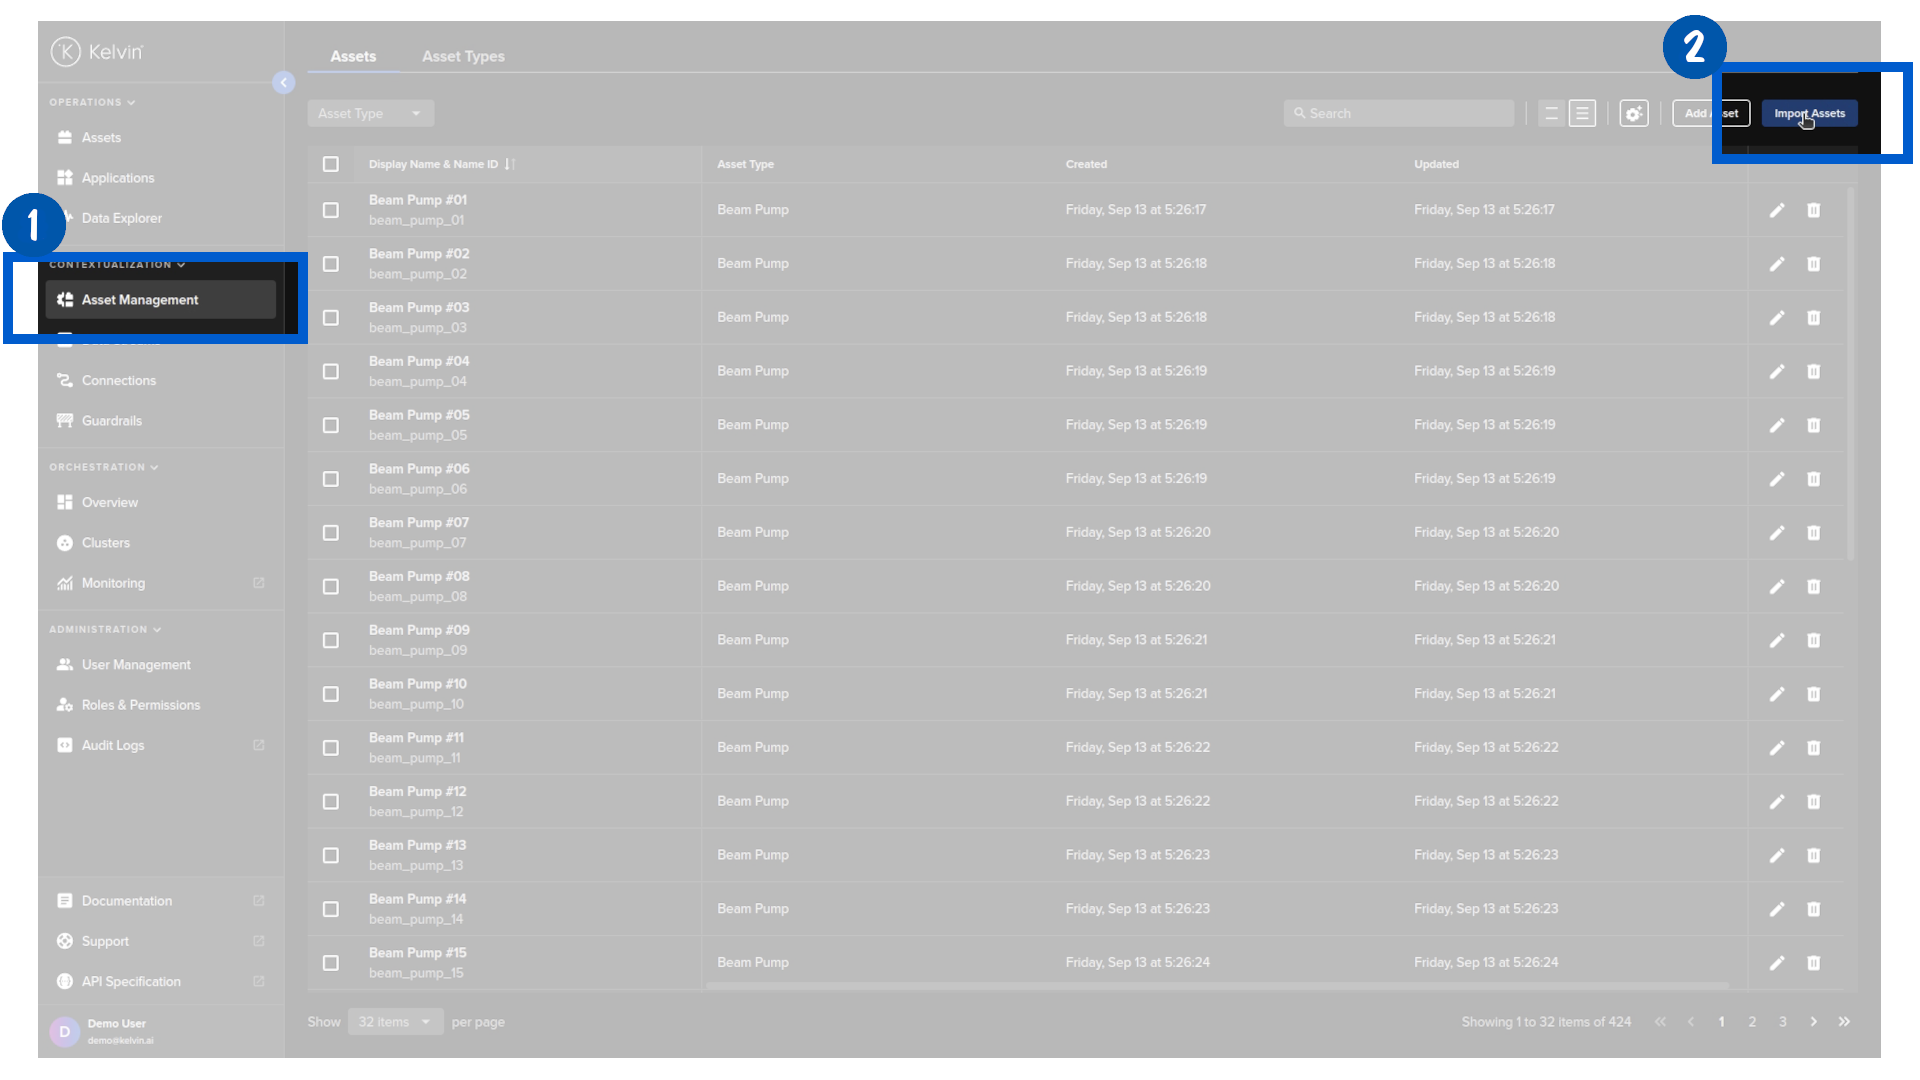
First, head over to Asset Management section and click the Import Assets button.
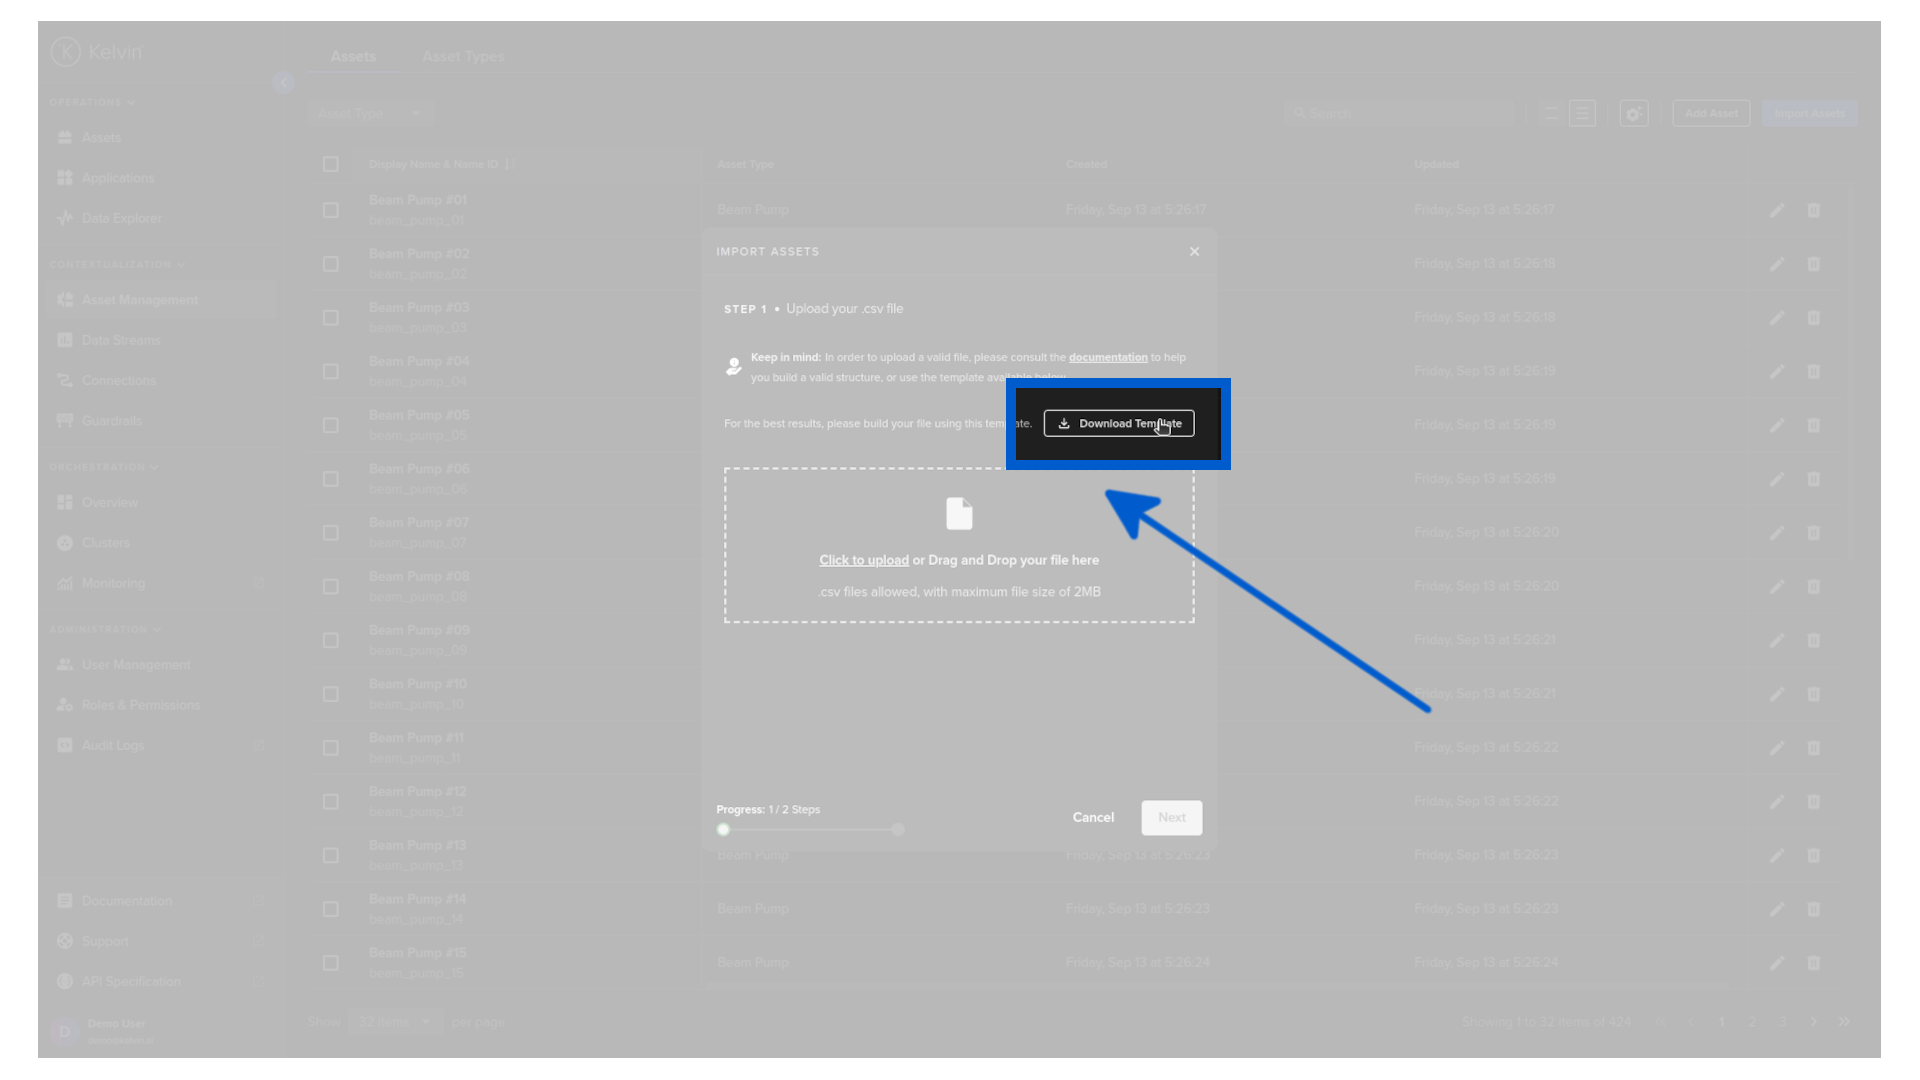
In the popup, you will have the option to download the sample template that gives you the structure you need to follow. Go ahead and click on the Download Template button and save the file.
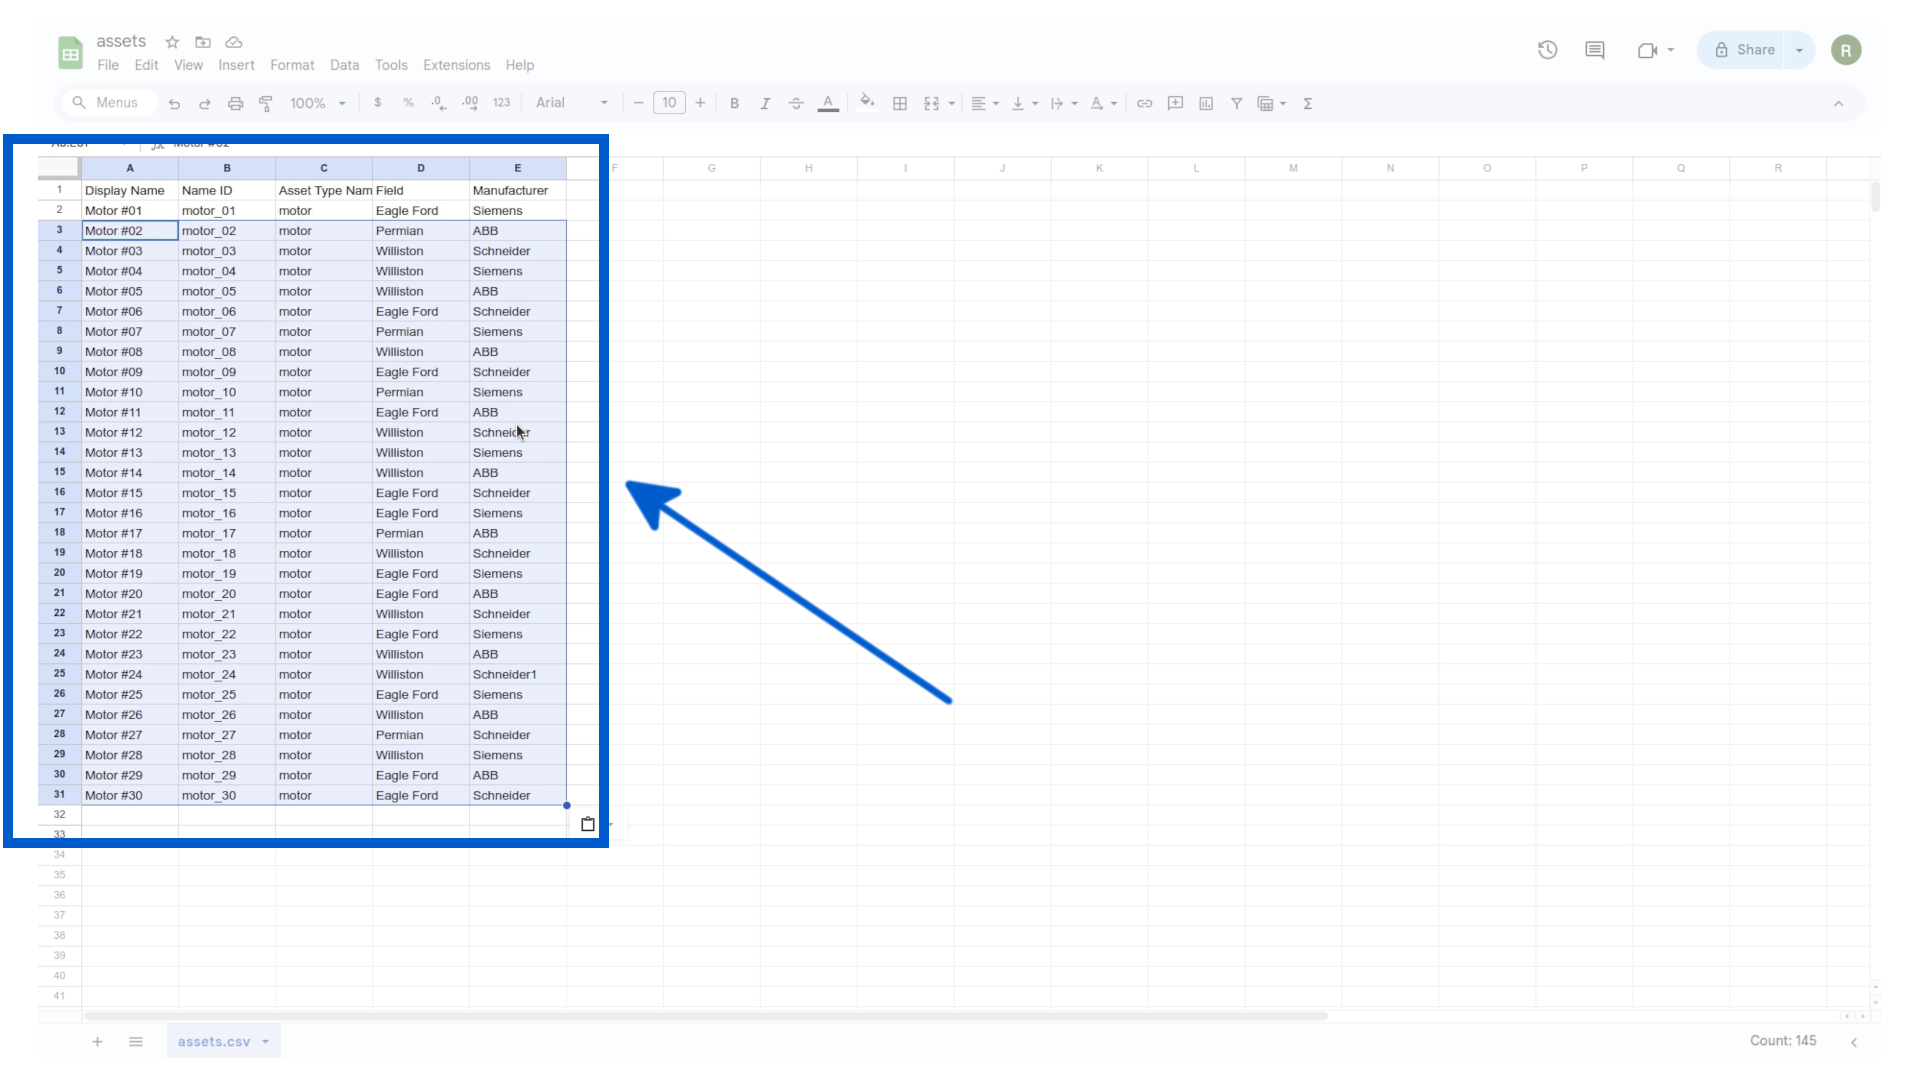
The template provides the three mandatory columns: Display Name, Name ID, and Asset Type Name ID. You can add optional metadata columns like Field and Manufacturer.
Each row represents one asset.
Simply add all your assets and save the file.
Back in the Kelvin UI, drag and drop the file into the upload area of the popup and click Next.
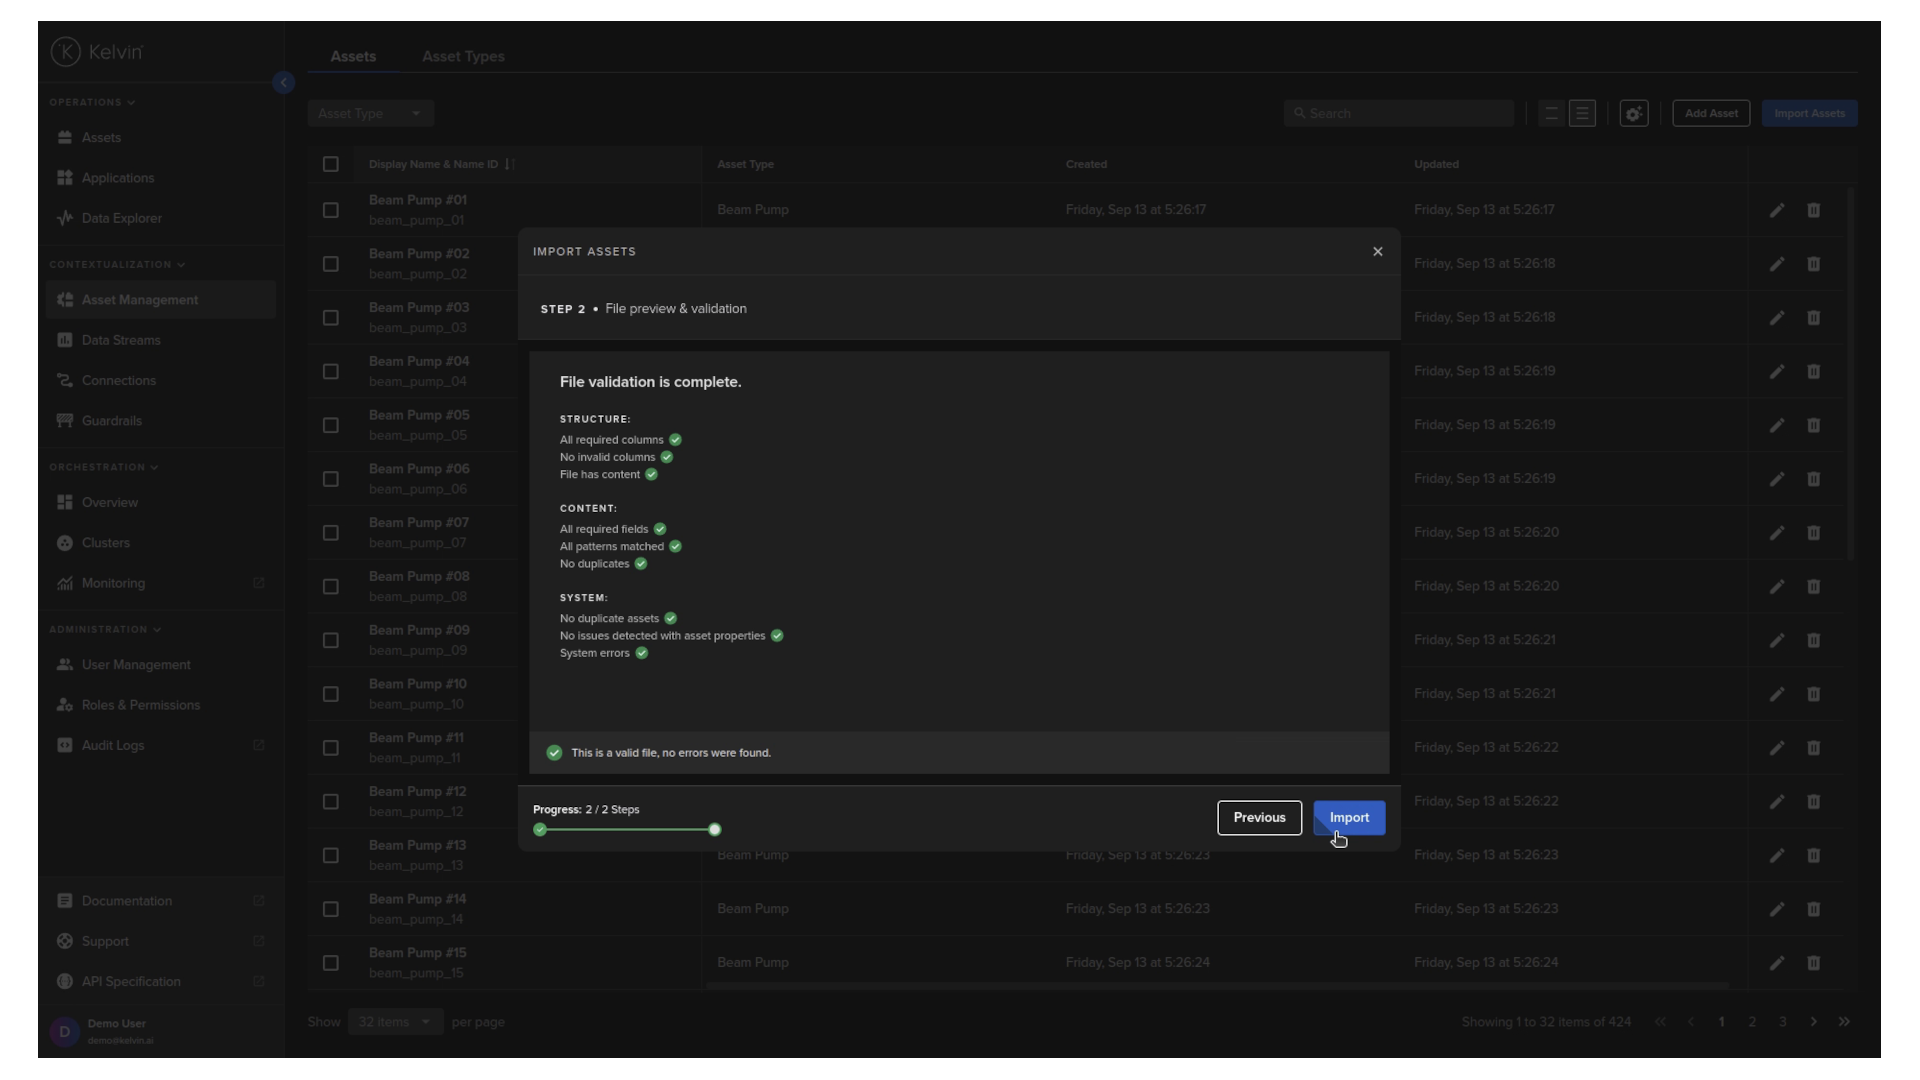
Kelvin will then check and validate your file. It will highlight any errors that are found.
In our case everything looks good, so we can click on the Import button.
Congratulations. Your assets are now imported into the Kelvin Platform.
2. Import your Data Streams
Now we will repeat a similar process with importing your Data Streams.
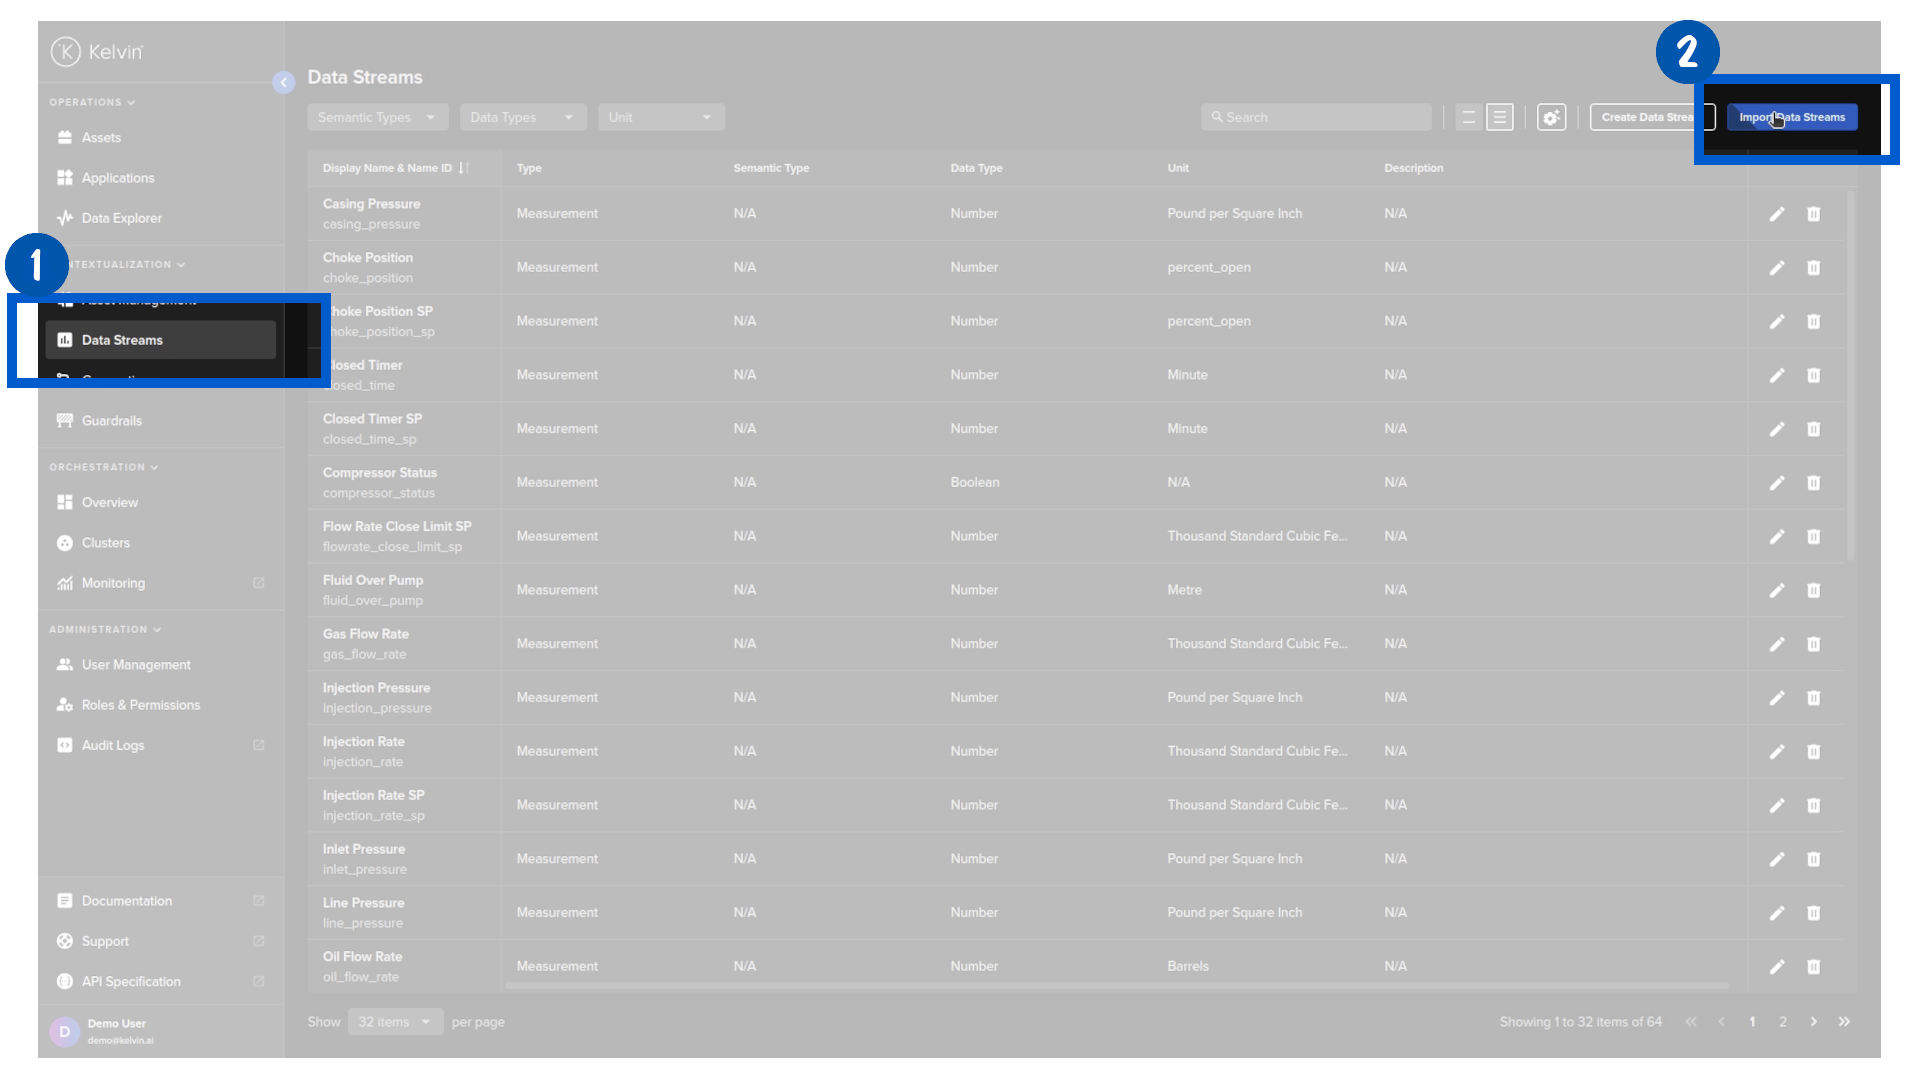
Head over to Data Streams section and click the Import Data Streams button.
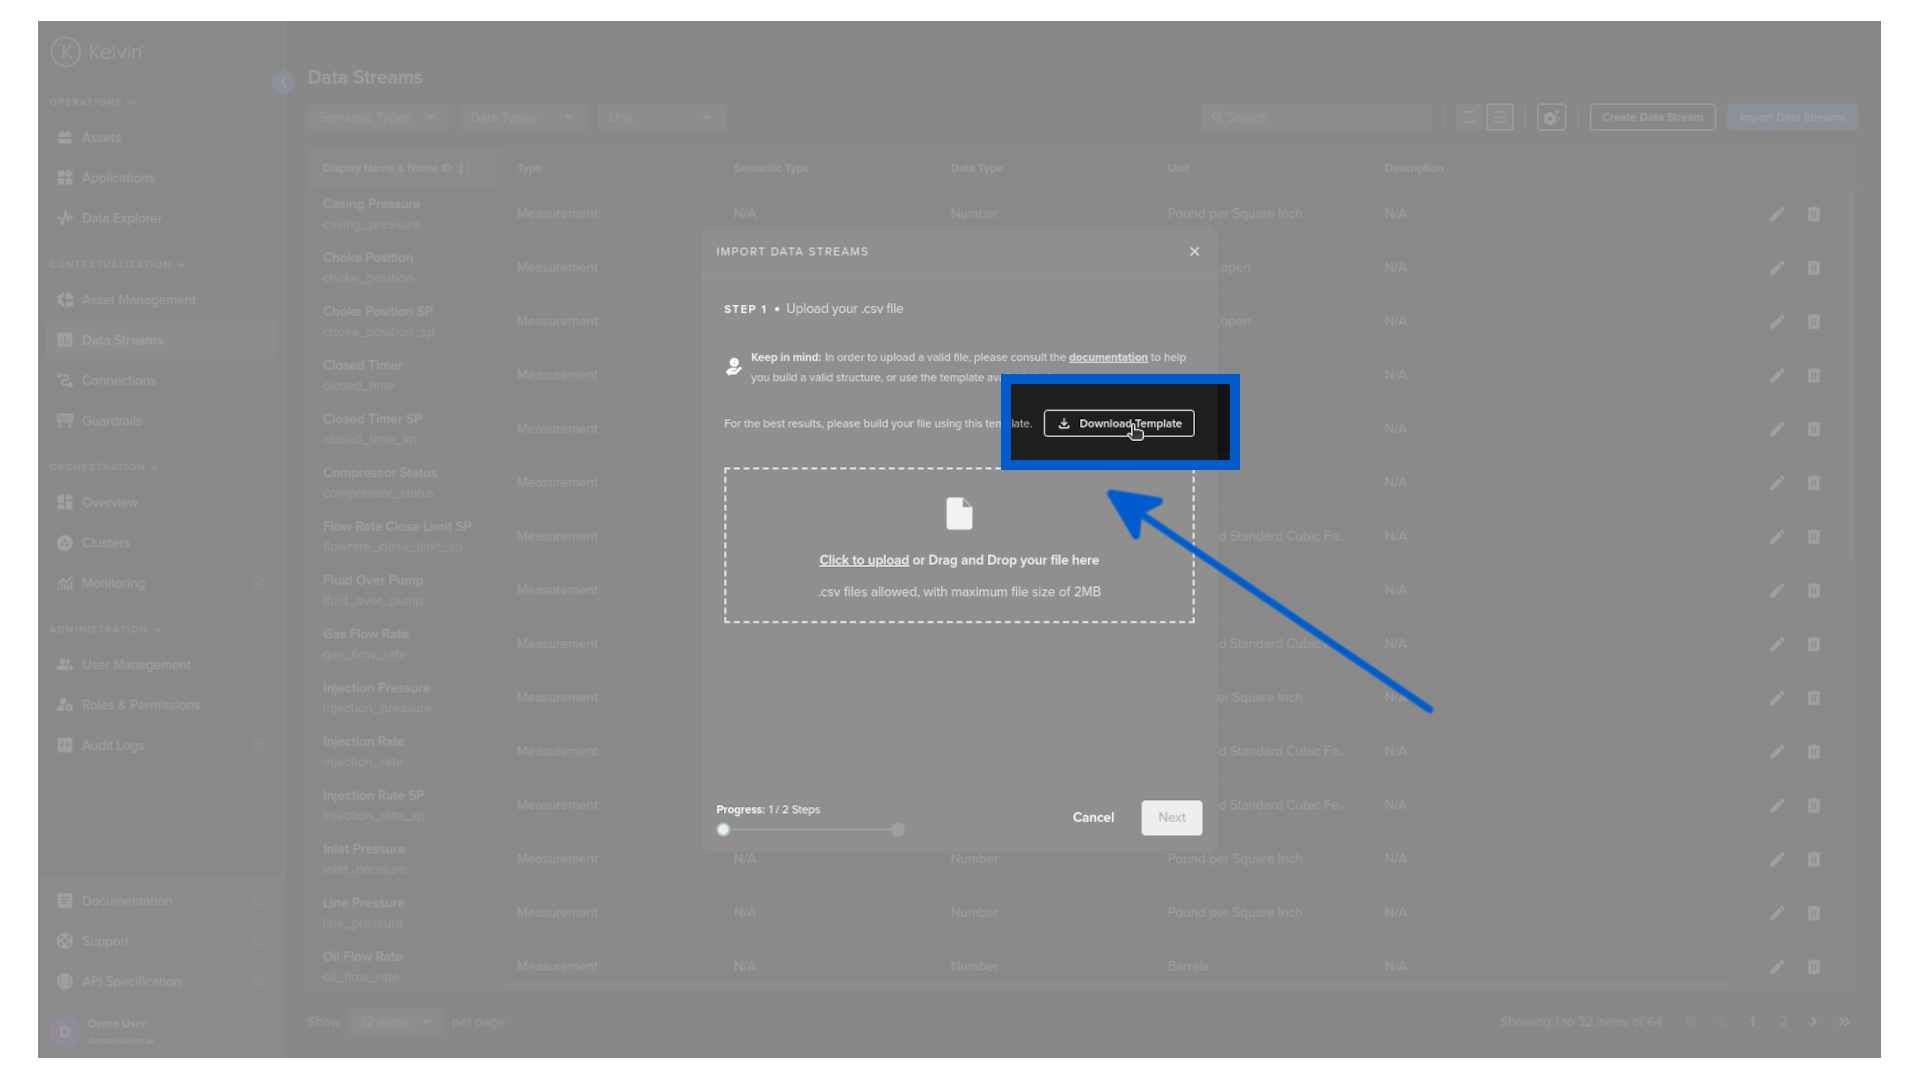
In the popup, you will have the option to download the sample template that gives you the structure you need to follow. Go ahead and click on the Download Template button and save the file.
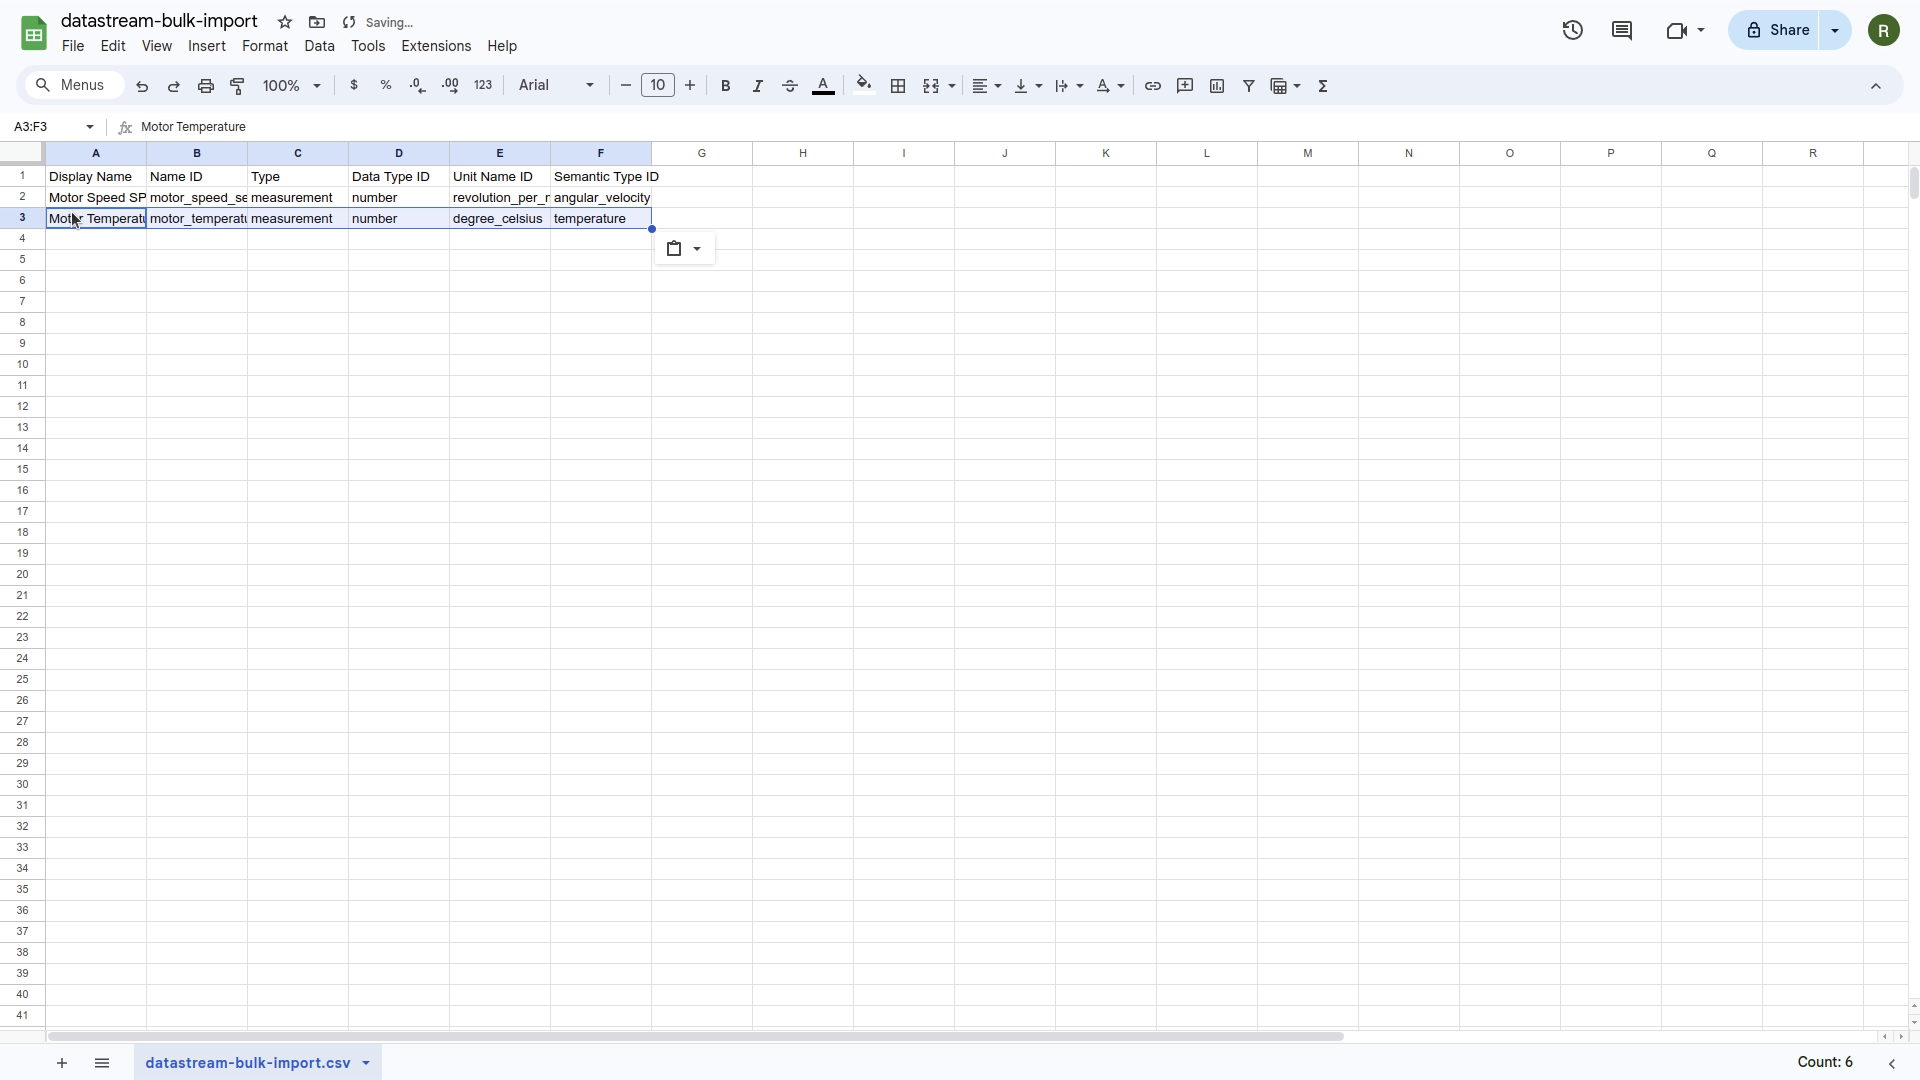
When we open the template, you will see six columns with fields like Display Name, Name and Unit.
Each row represents one data stream. For our demo we will fill in two types of data streams and save the file.
Back in the Kelvin UI, drag and drop the file into the upload area of the popup and click Next.
The system will validate the file for mistakes. If everything checks out, click on the Import button.
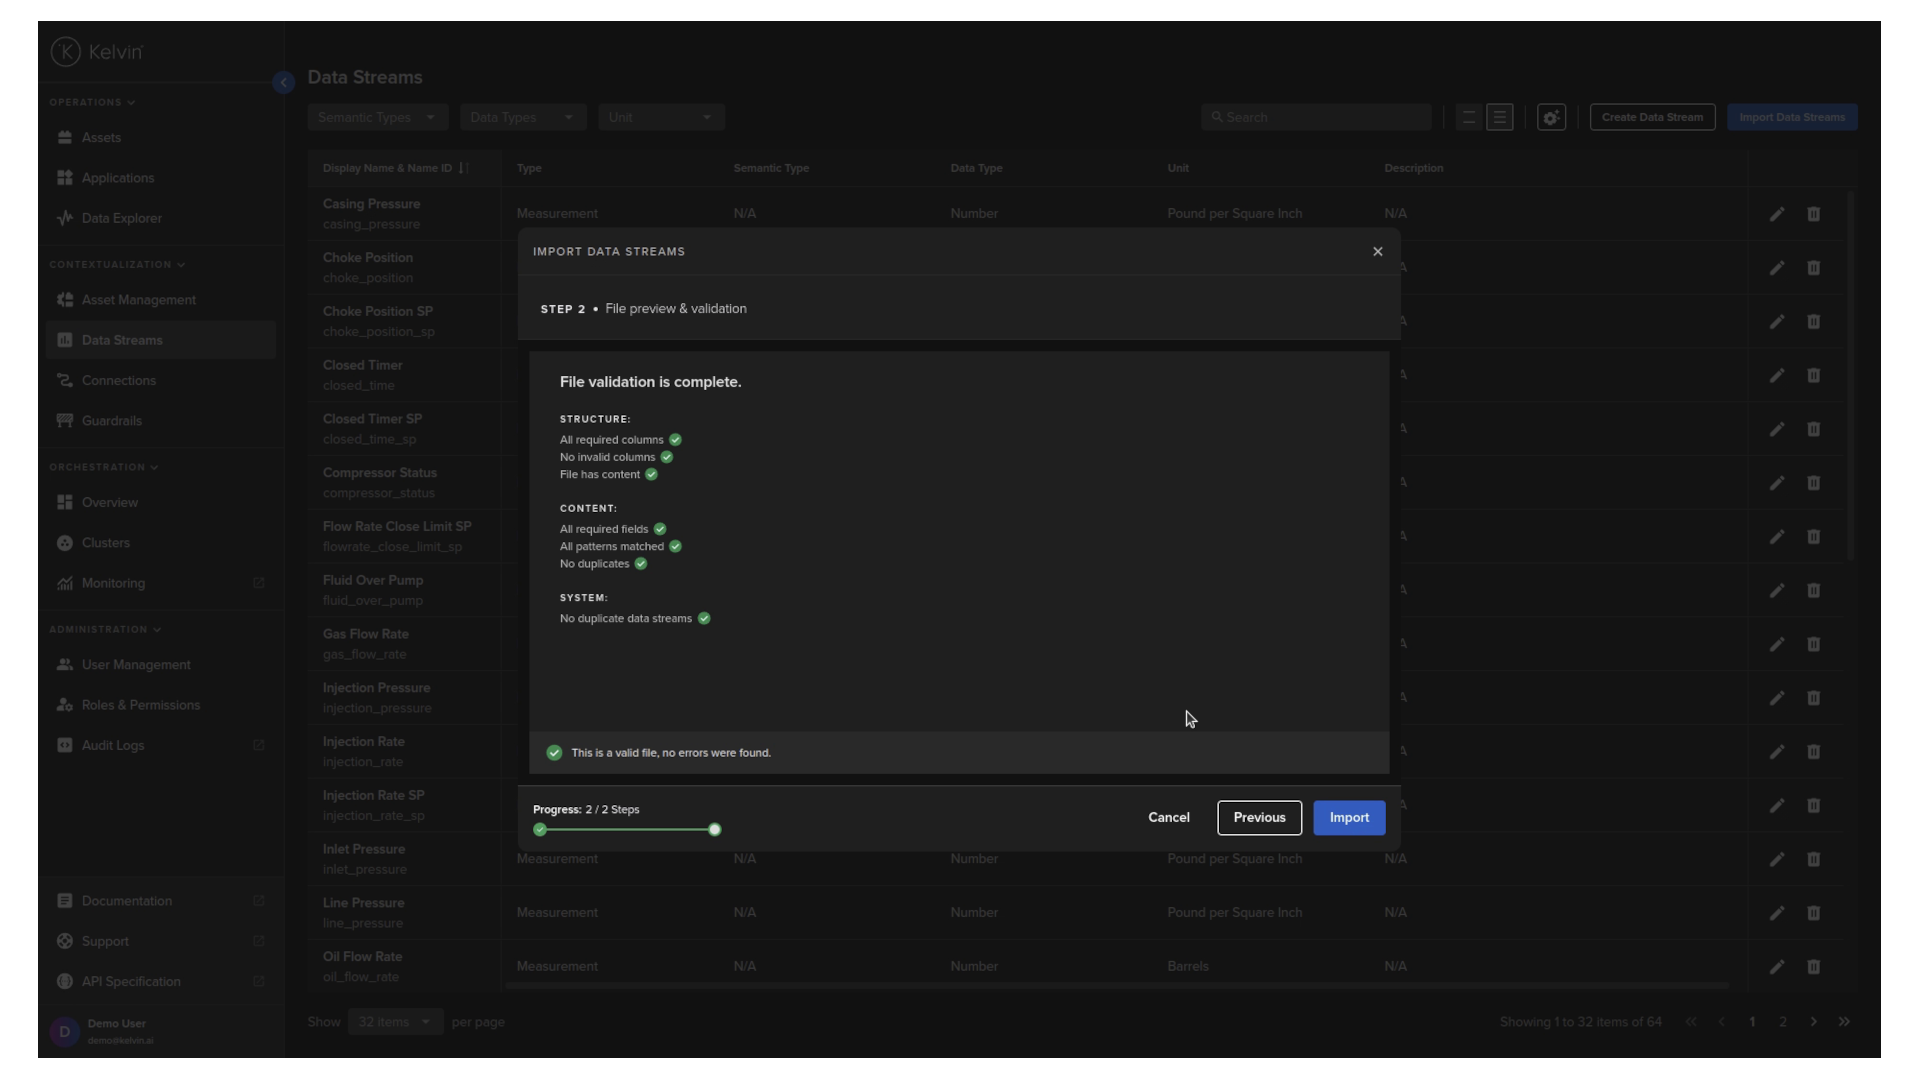
Congratulations, your data streams have been imported.
3. Connect and Stream Data
With your assets and data streams configured, you can now test your applications by establishing a connection that reads data from a CSV file and streams it directly to your apps.
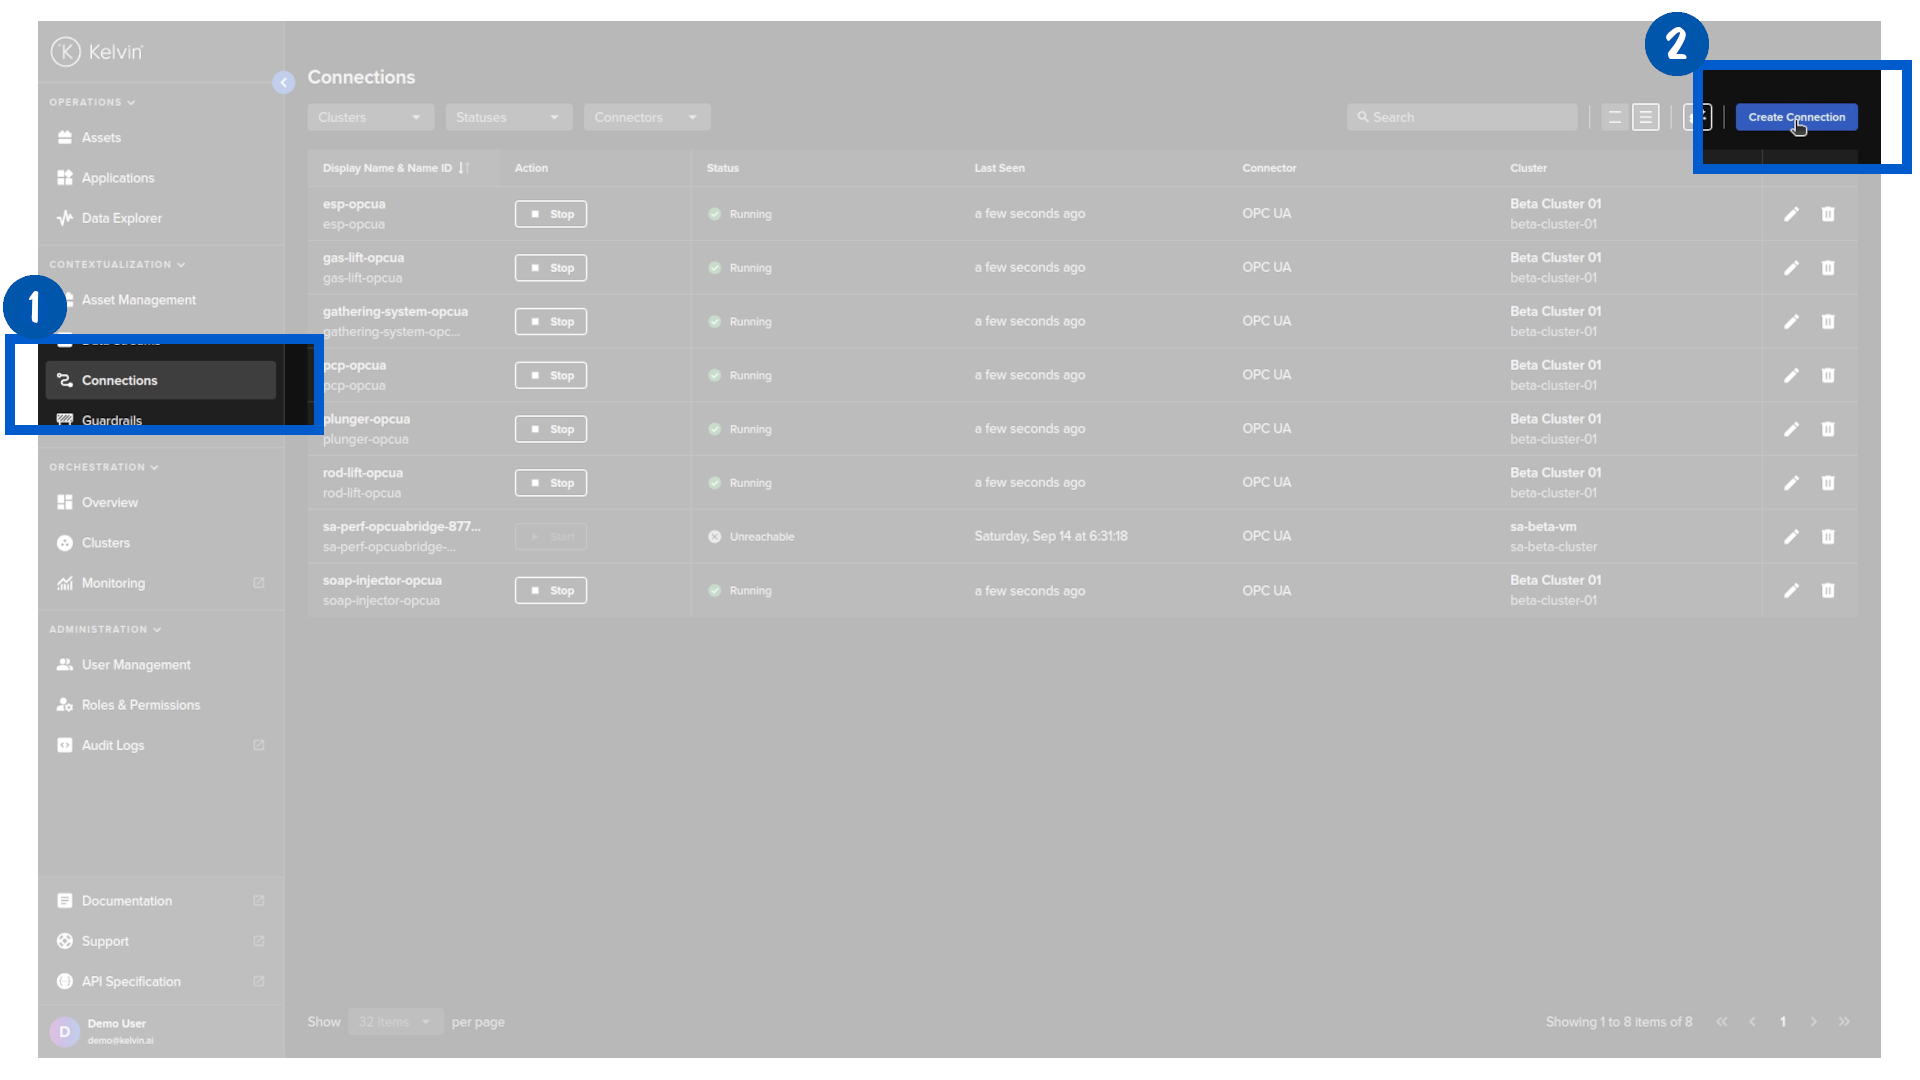
To do this we go to the Connections section and click on the Create Connection button.
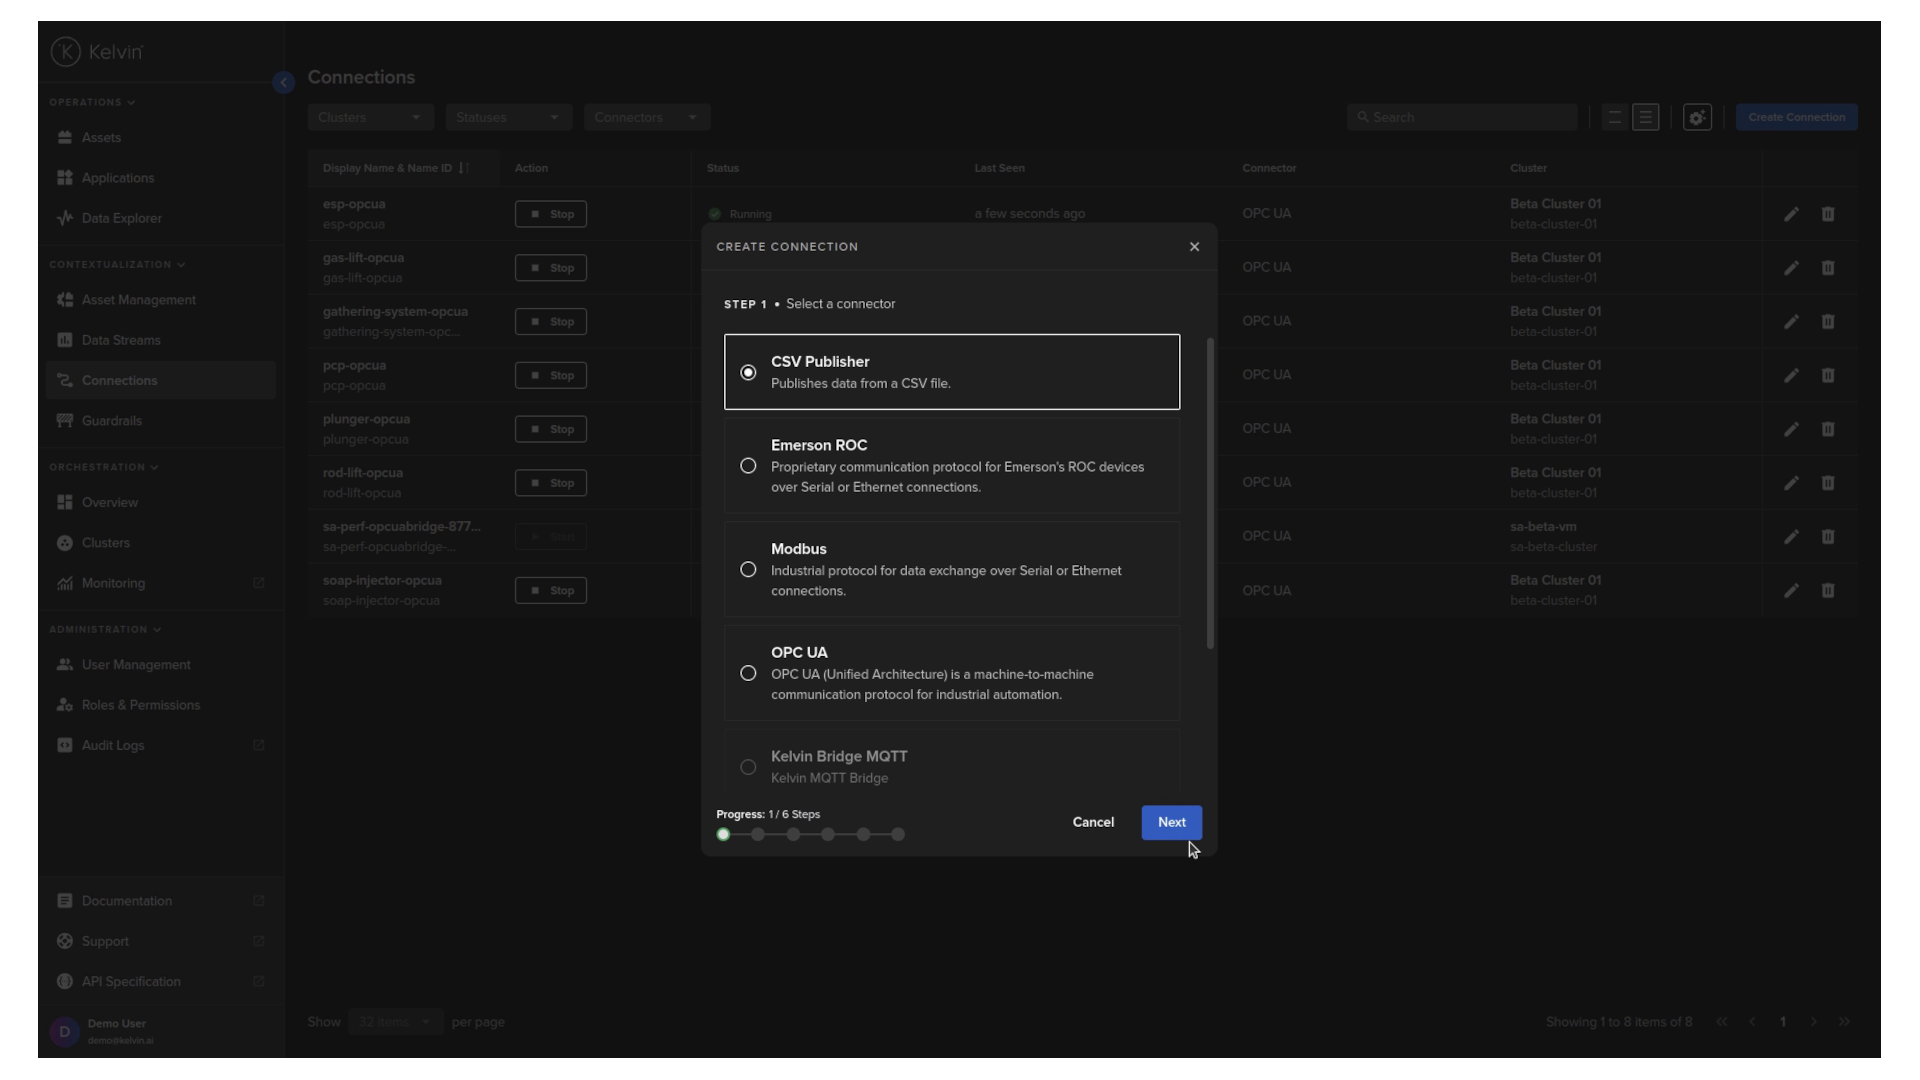
Select the CSV Publisher option and click next.
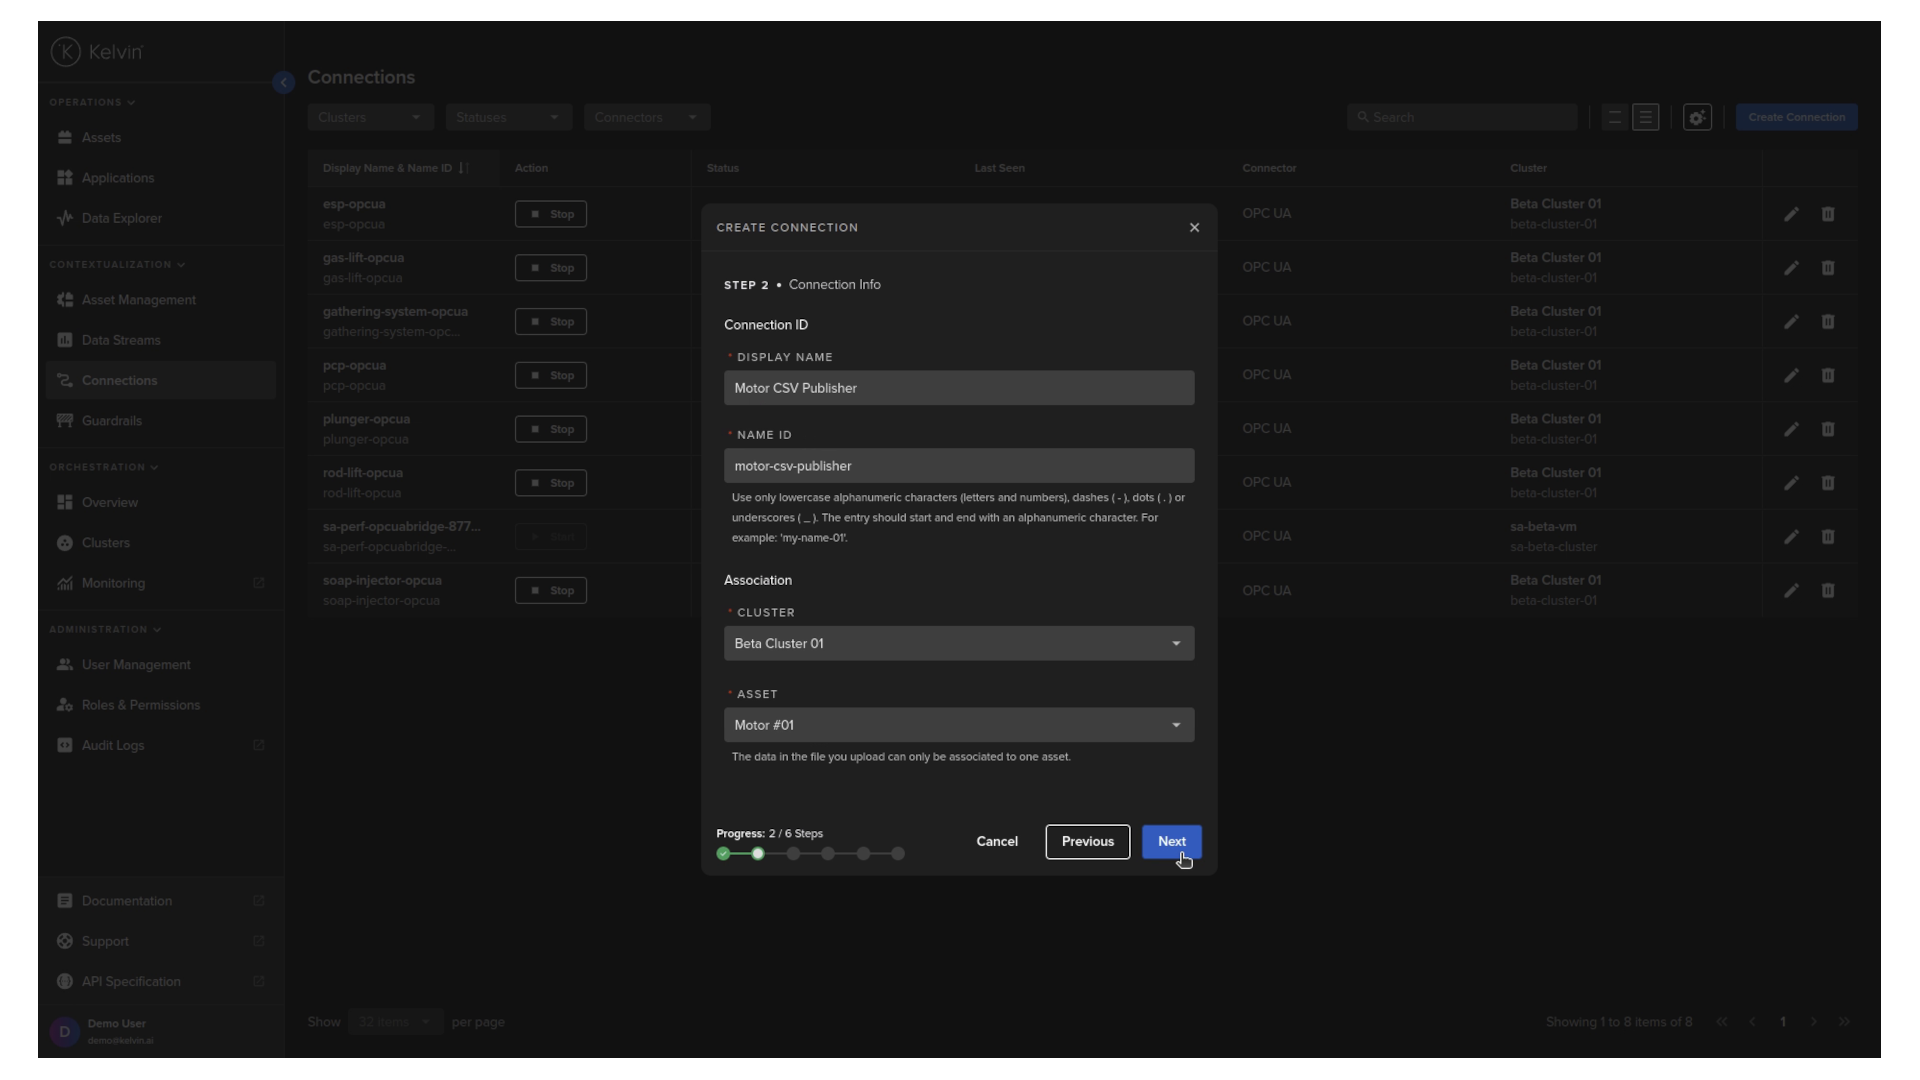
Give your CSV publisher connection a name, select the cluster where to deploy and link it to an asset, then click Next.
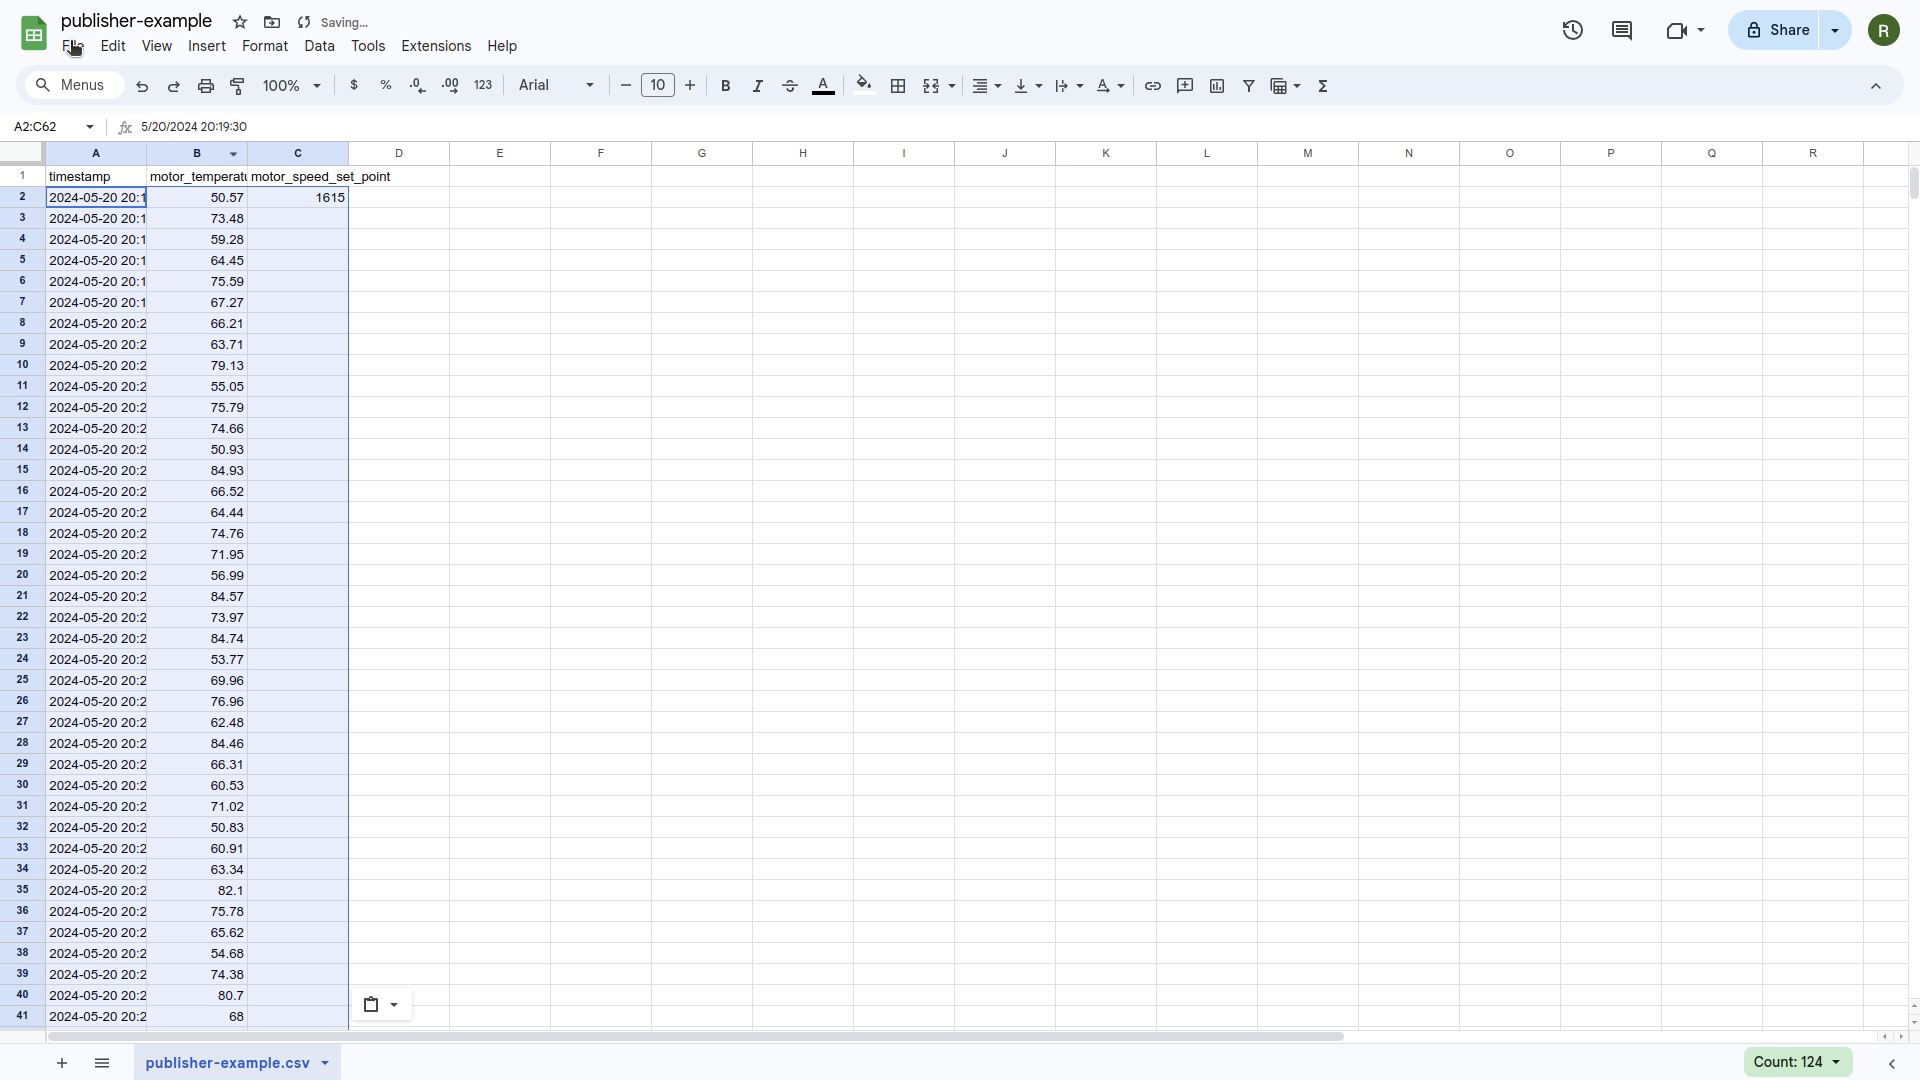
Now you can now download the time series template.
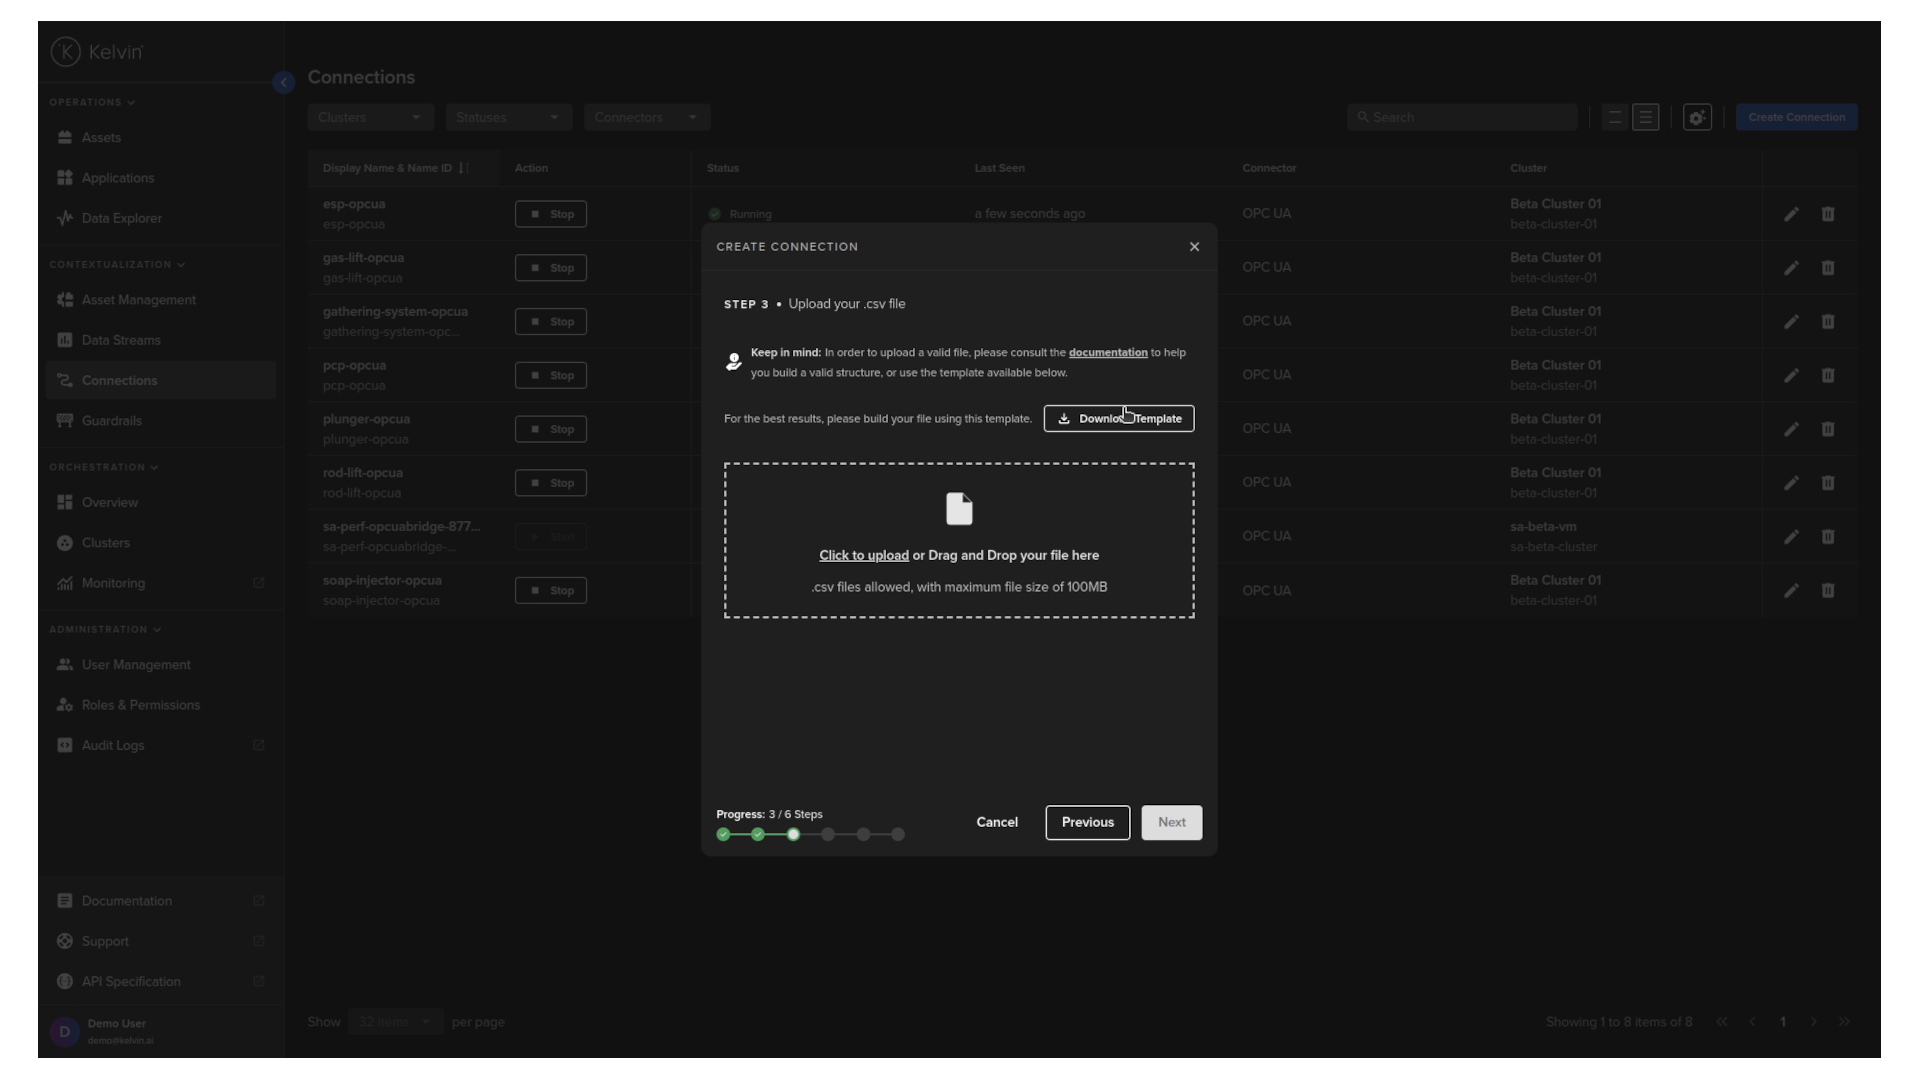
Add your data stream names in the header, and the time series data into the rows of this csv file. This is the data that will be streamed to the asset selected in the previous step. Then save the file.
To upload it, we can continue from where we downloaded the template by dragging and dropping our updated template data to the upload box then click next.
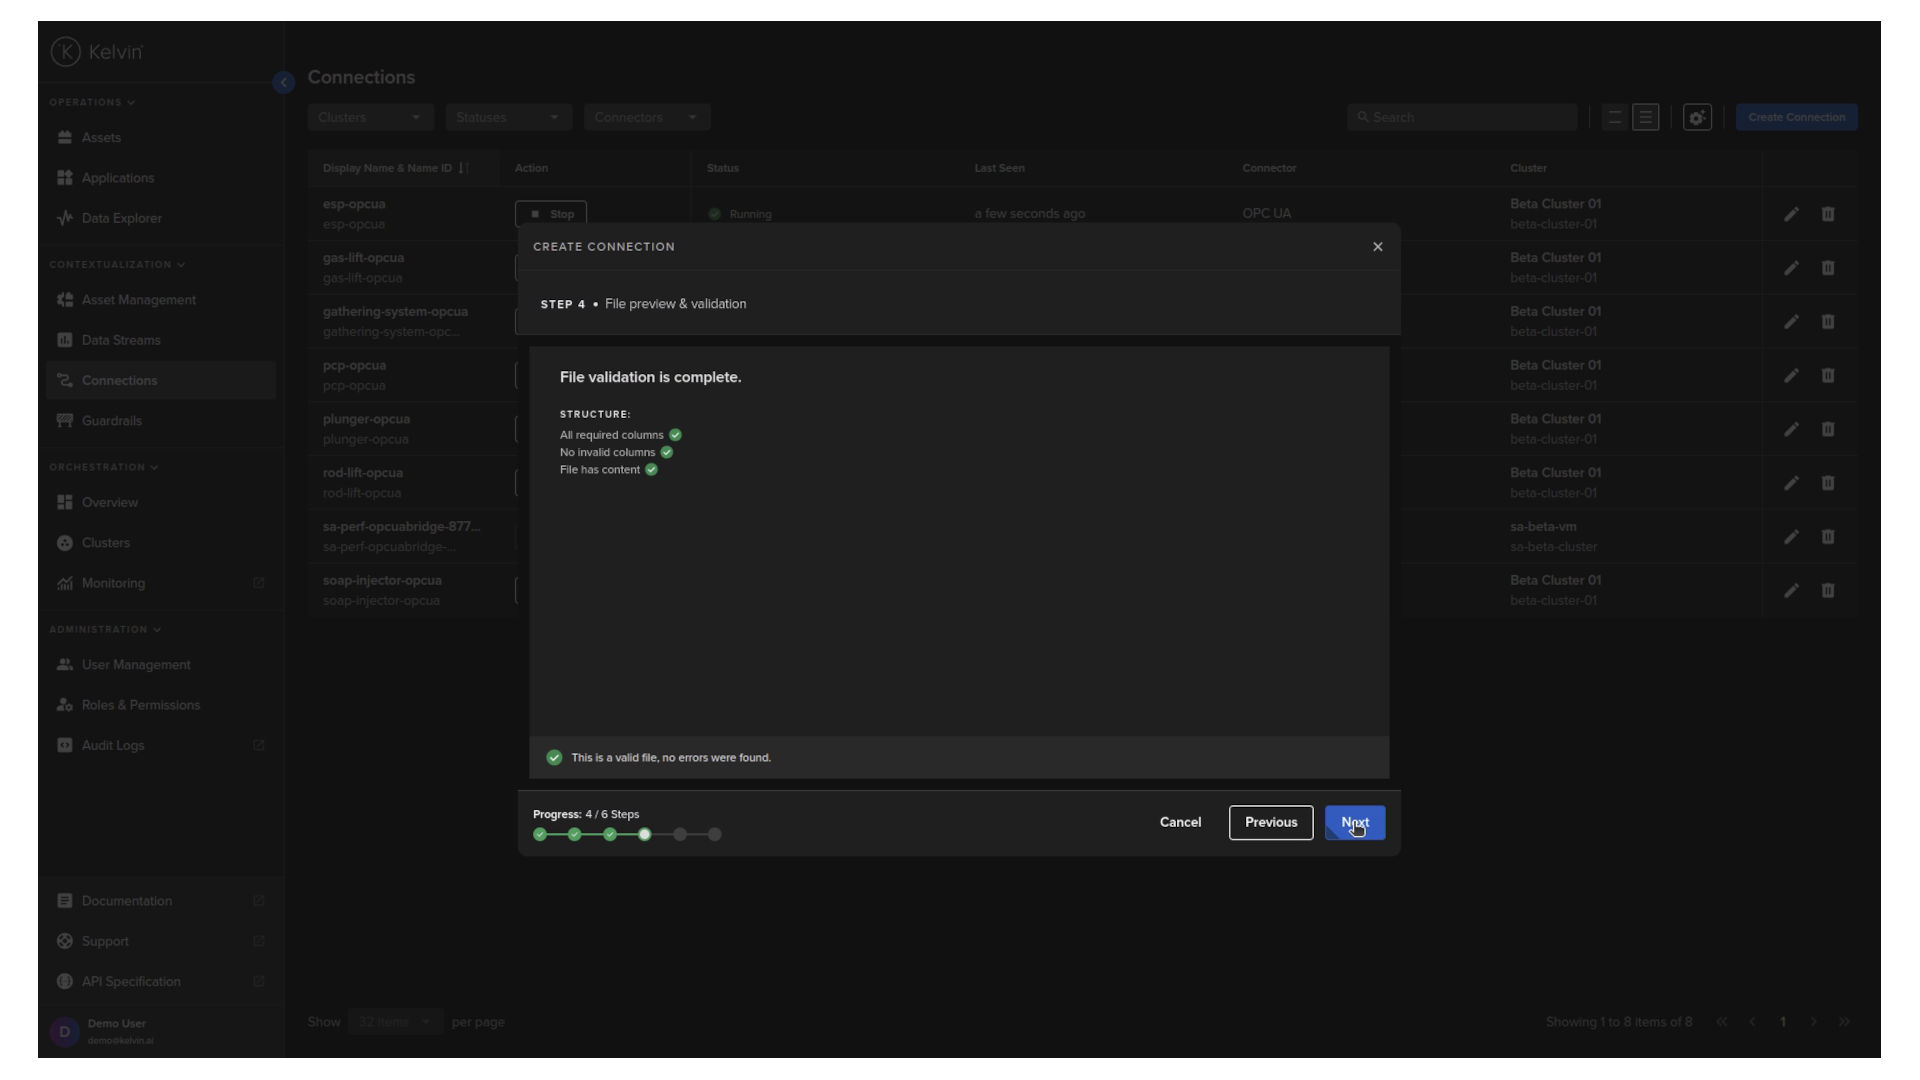
The file will then be validated. Click next when done.
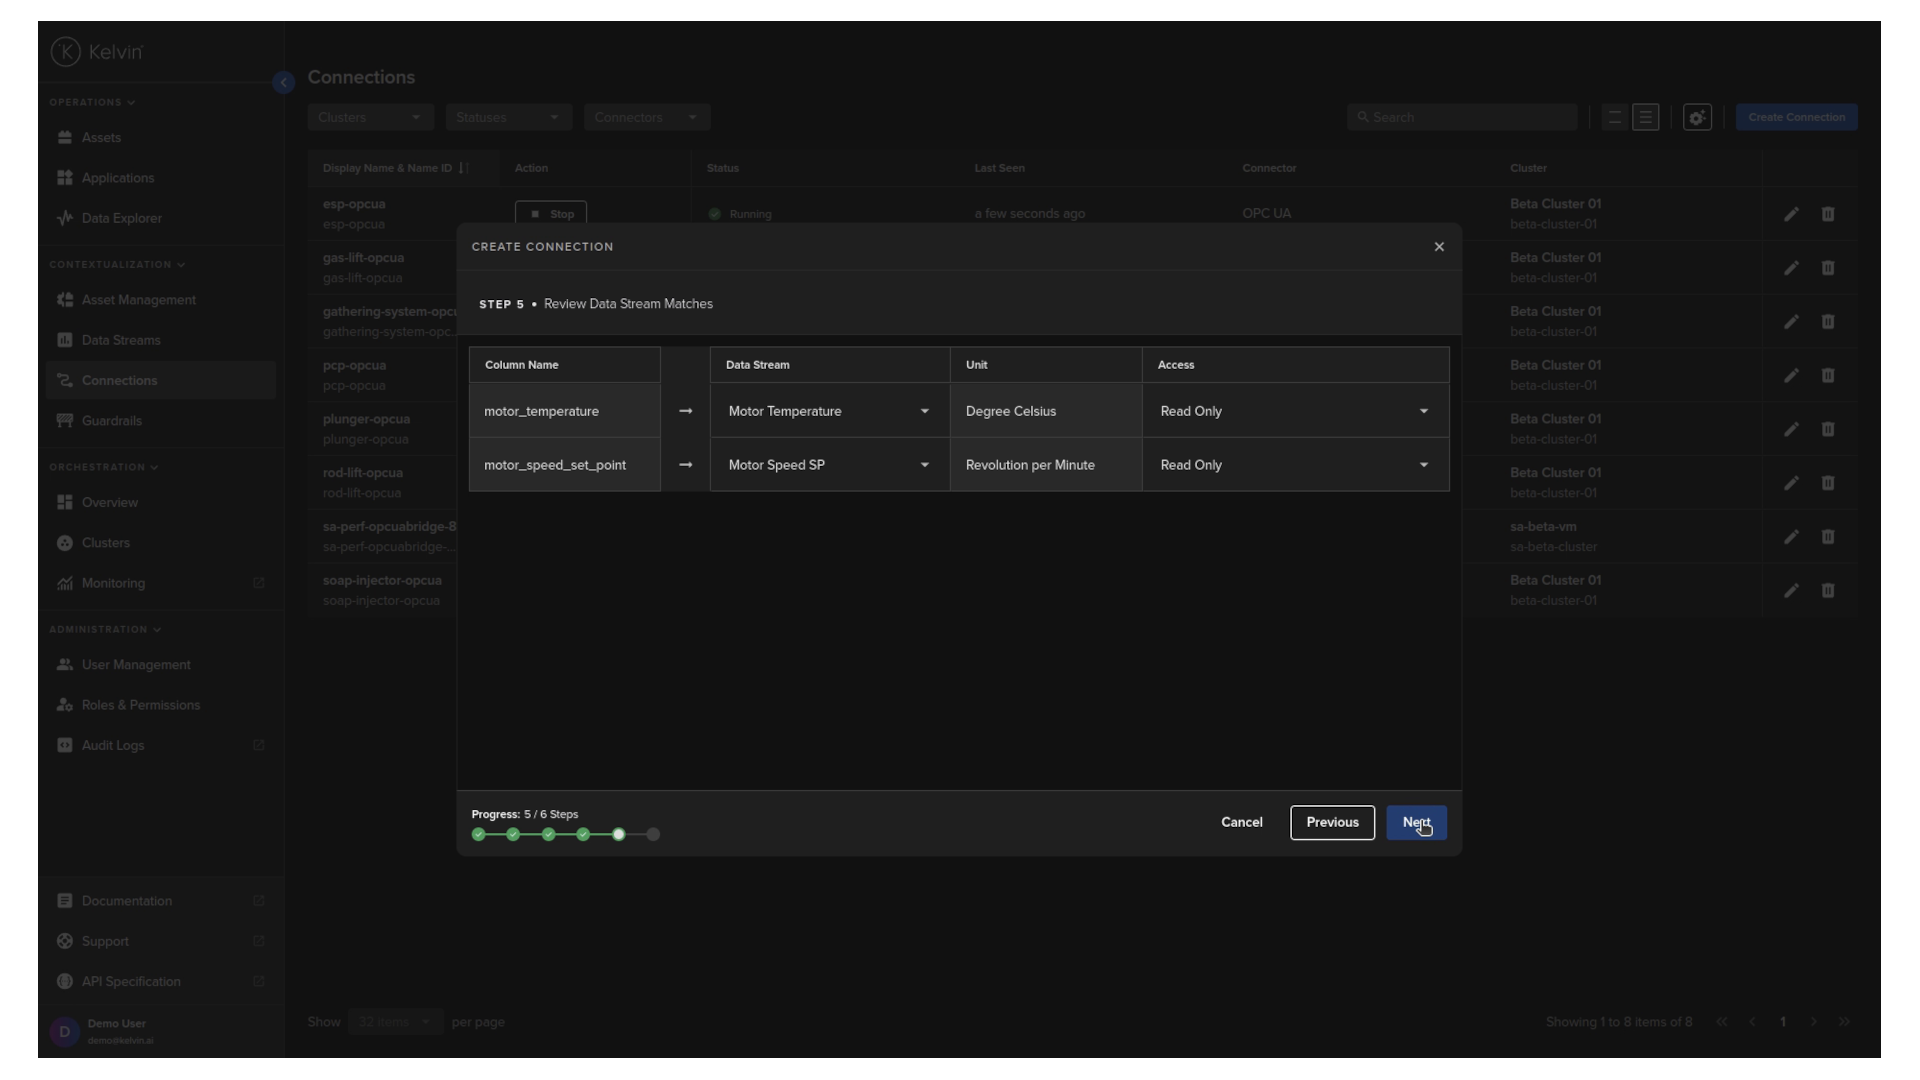
You can now review the connection between the column names and the data stream names. If needed, you can change the connections then click next
Now you can select how the time series data will be published. We will keep the defaults which will loop to the beginning of the time series once it reaches the end and we will follow the timestamps and not deliver at a fixed interval.
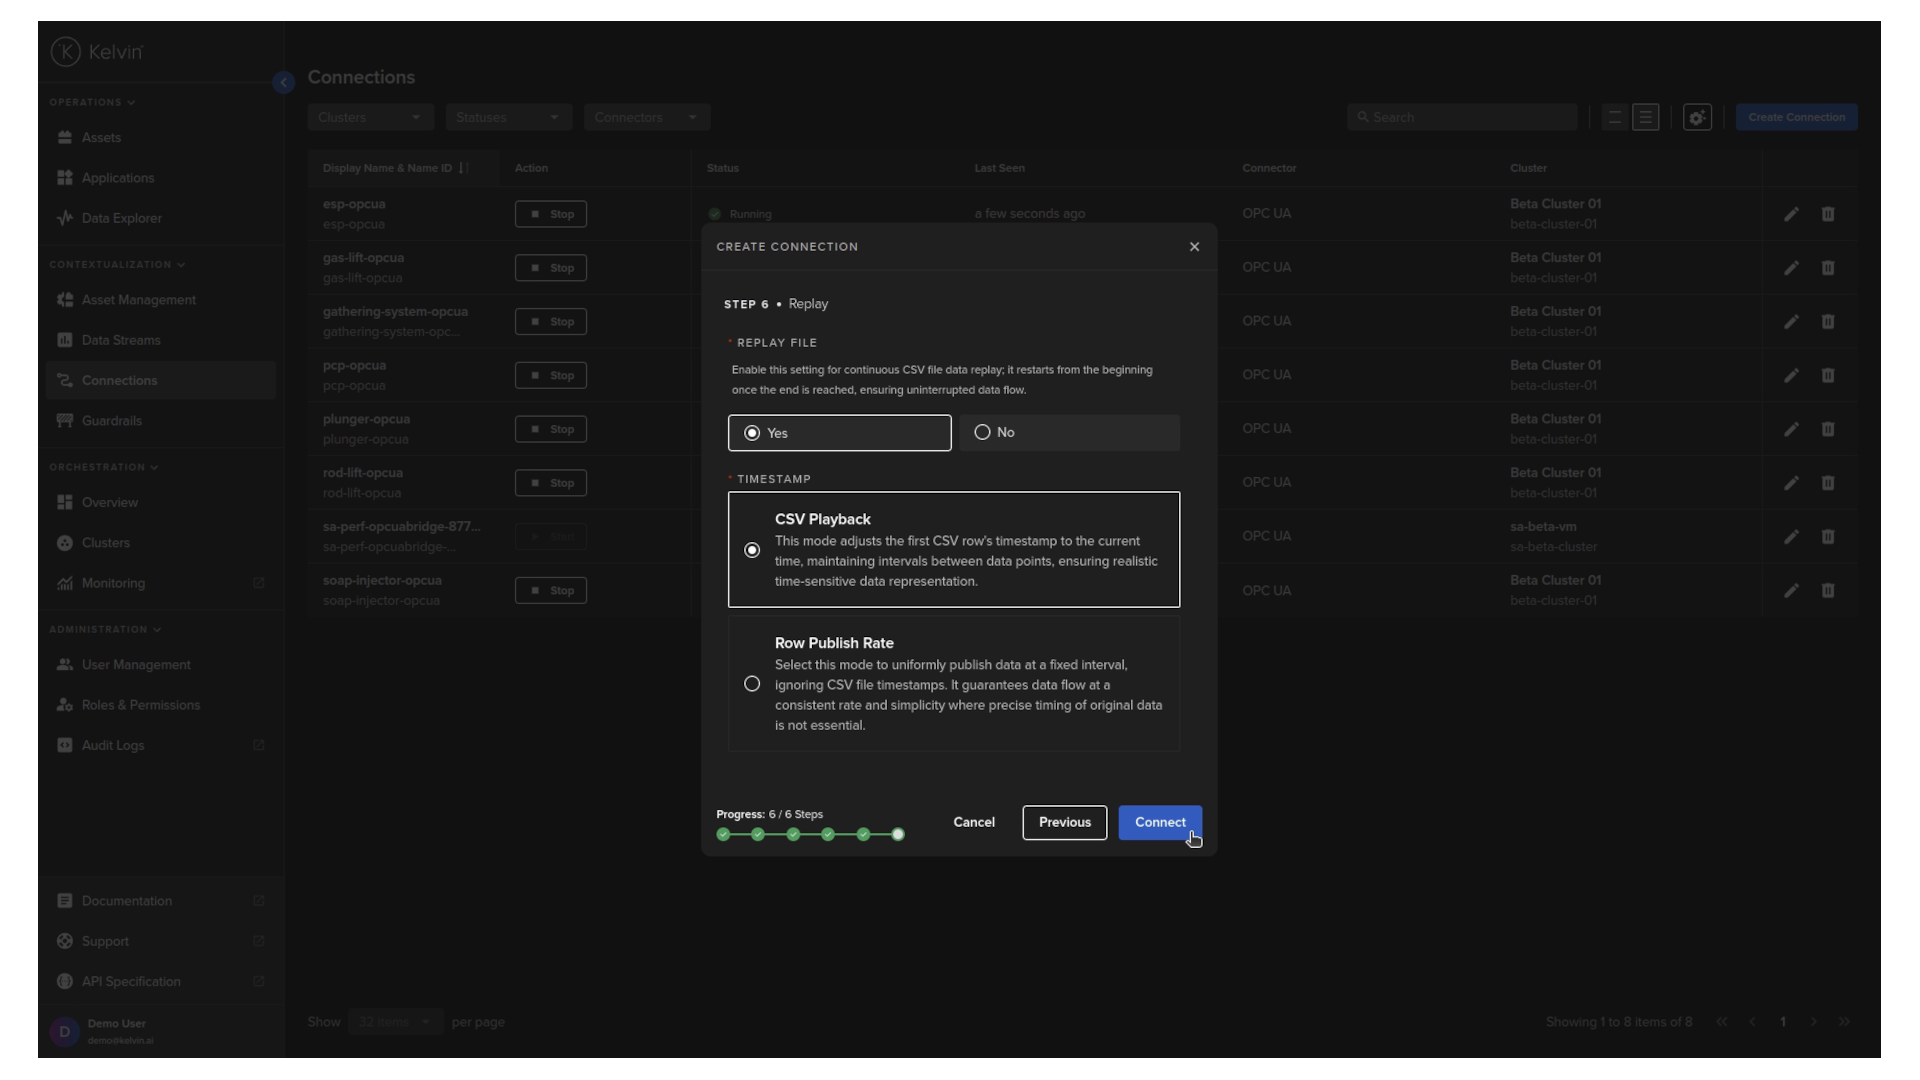
When ready, click Connect.
And that is it, the connection will be deployed to your cluster and start publishing the time series data to your asset data stream pairs.It will take about a minute for the connection to deploy and start running at the edge. So we will skip one minute ahead.
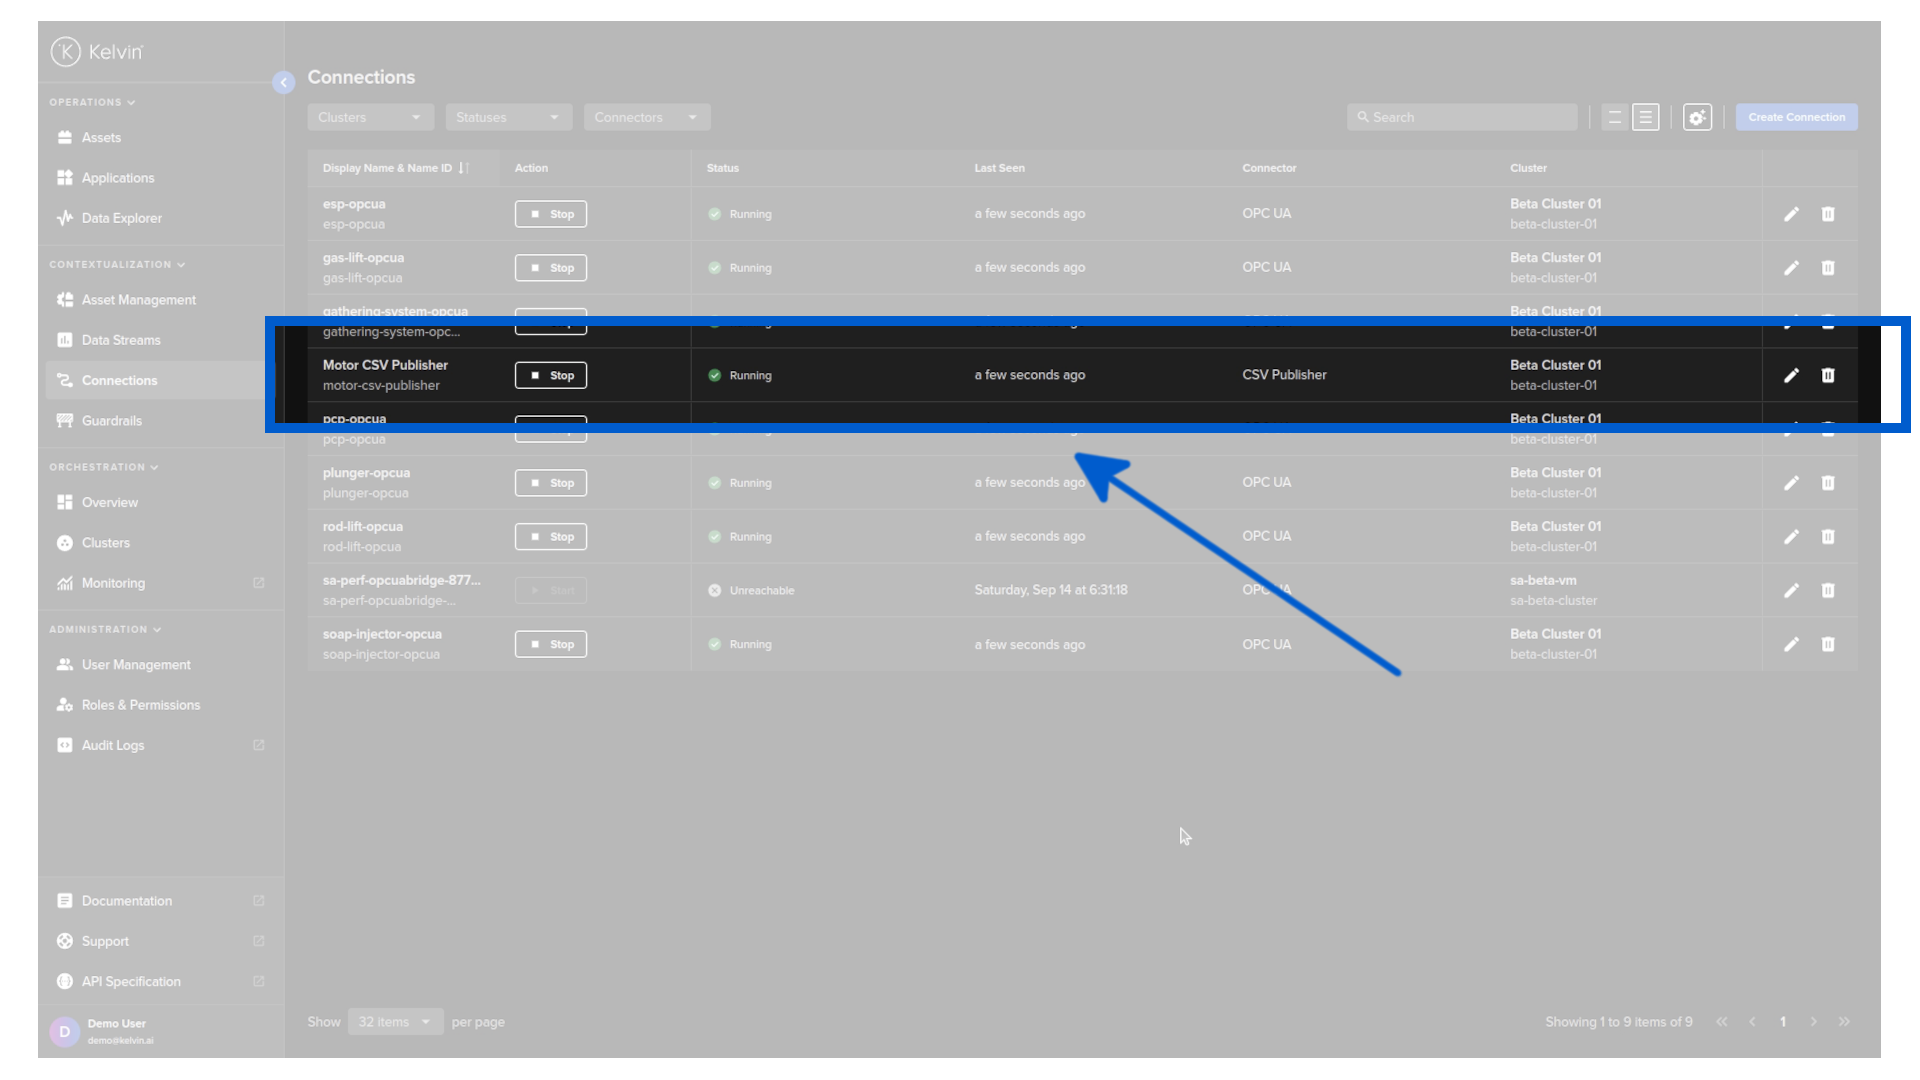
You can now view the incoming data by clicking on connections and click the connection name we just created.You will then see a list of assets data stream pairs and their last value.
If you have followed this in the video tutorial you will see have setup the Kelvin Platform and started streaming edge data in this tutorial with three simple steps in under six minutes.