View Assets Details
On this page you will learn about accessing and understanding the Asset Details Page in Kelvin UI.
Overview
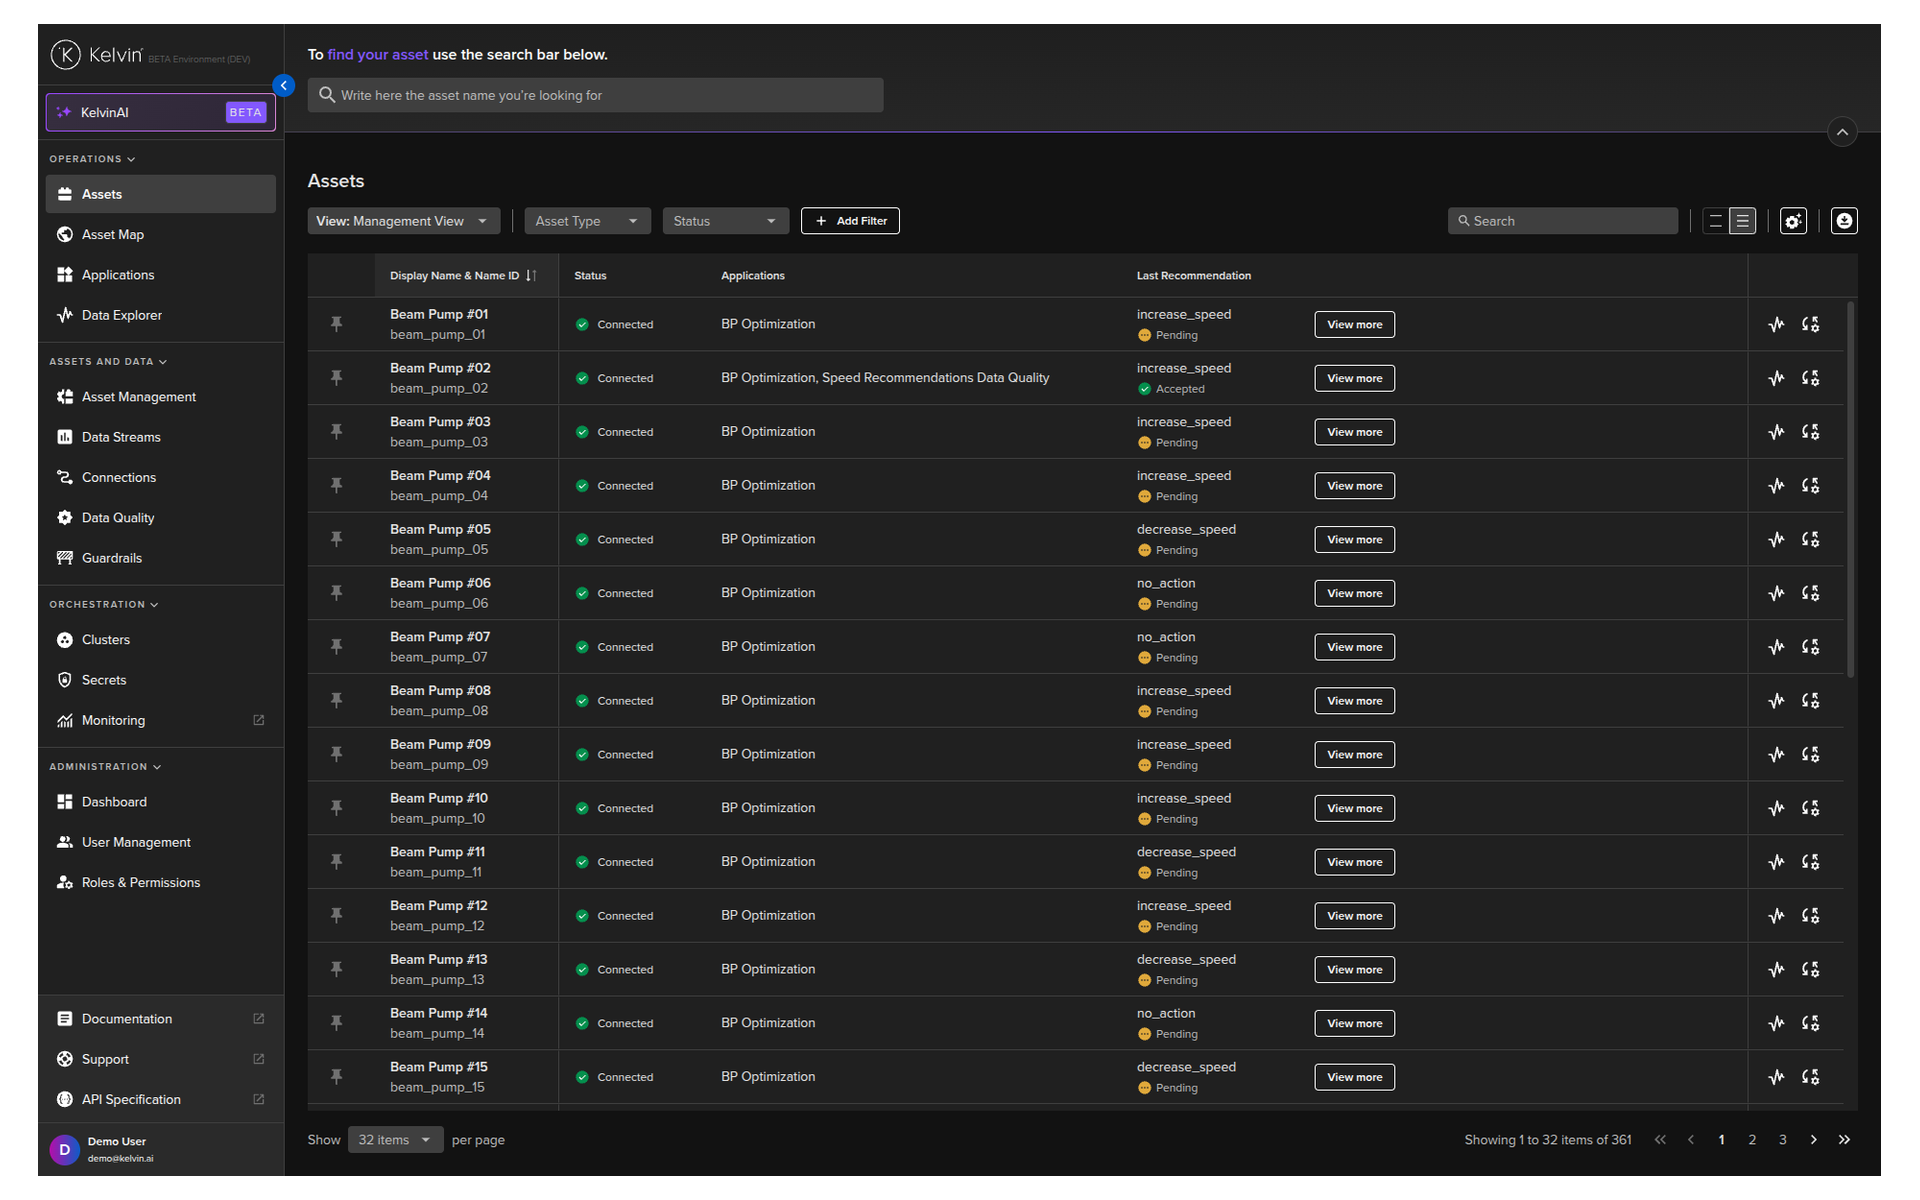
The Assets page is the first page you will see when you log into the Kelvin UI. You can also go there by clicking on the Asset option in the left sidebar.
Here you have a list of all Assets registered in Kelvin. From here you can see the Assets and associated information.
When you click on an Asset and then click on the Applications Tab you will see an overview with all the details about the Asset for each Application.
Note
In our example we only have one Kelvin SmartApp™ associated with this Asset, so you see the Kelvin SmartApp™ name in the tab bar.
If there are multiple Applications, then the tab will say Applications and in this tab will be a sub-tab with each Kelvin SmartApp™'s name.
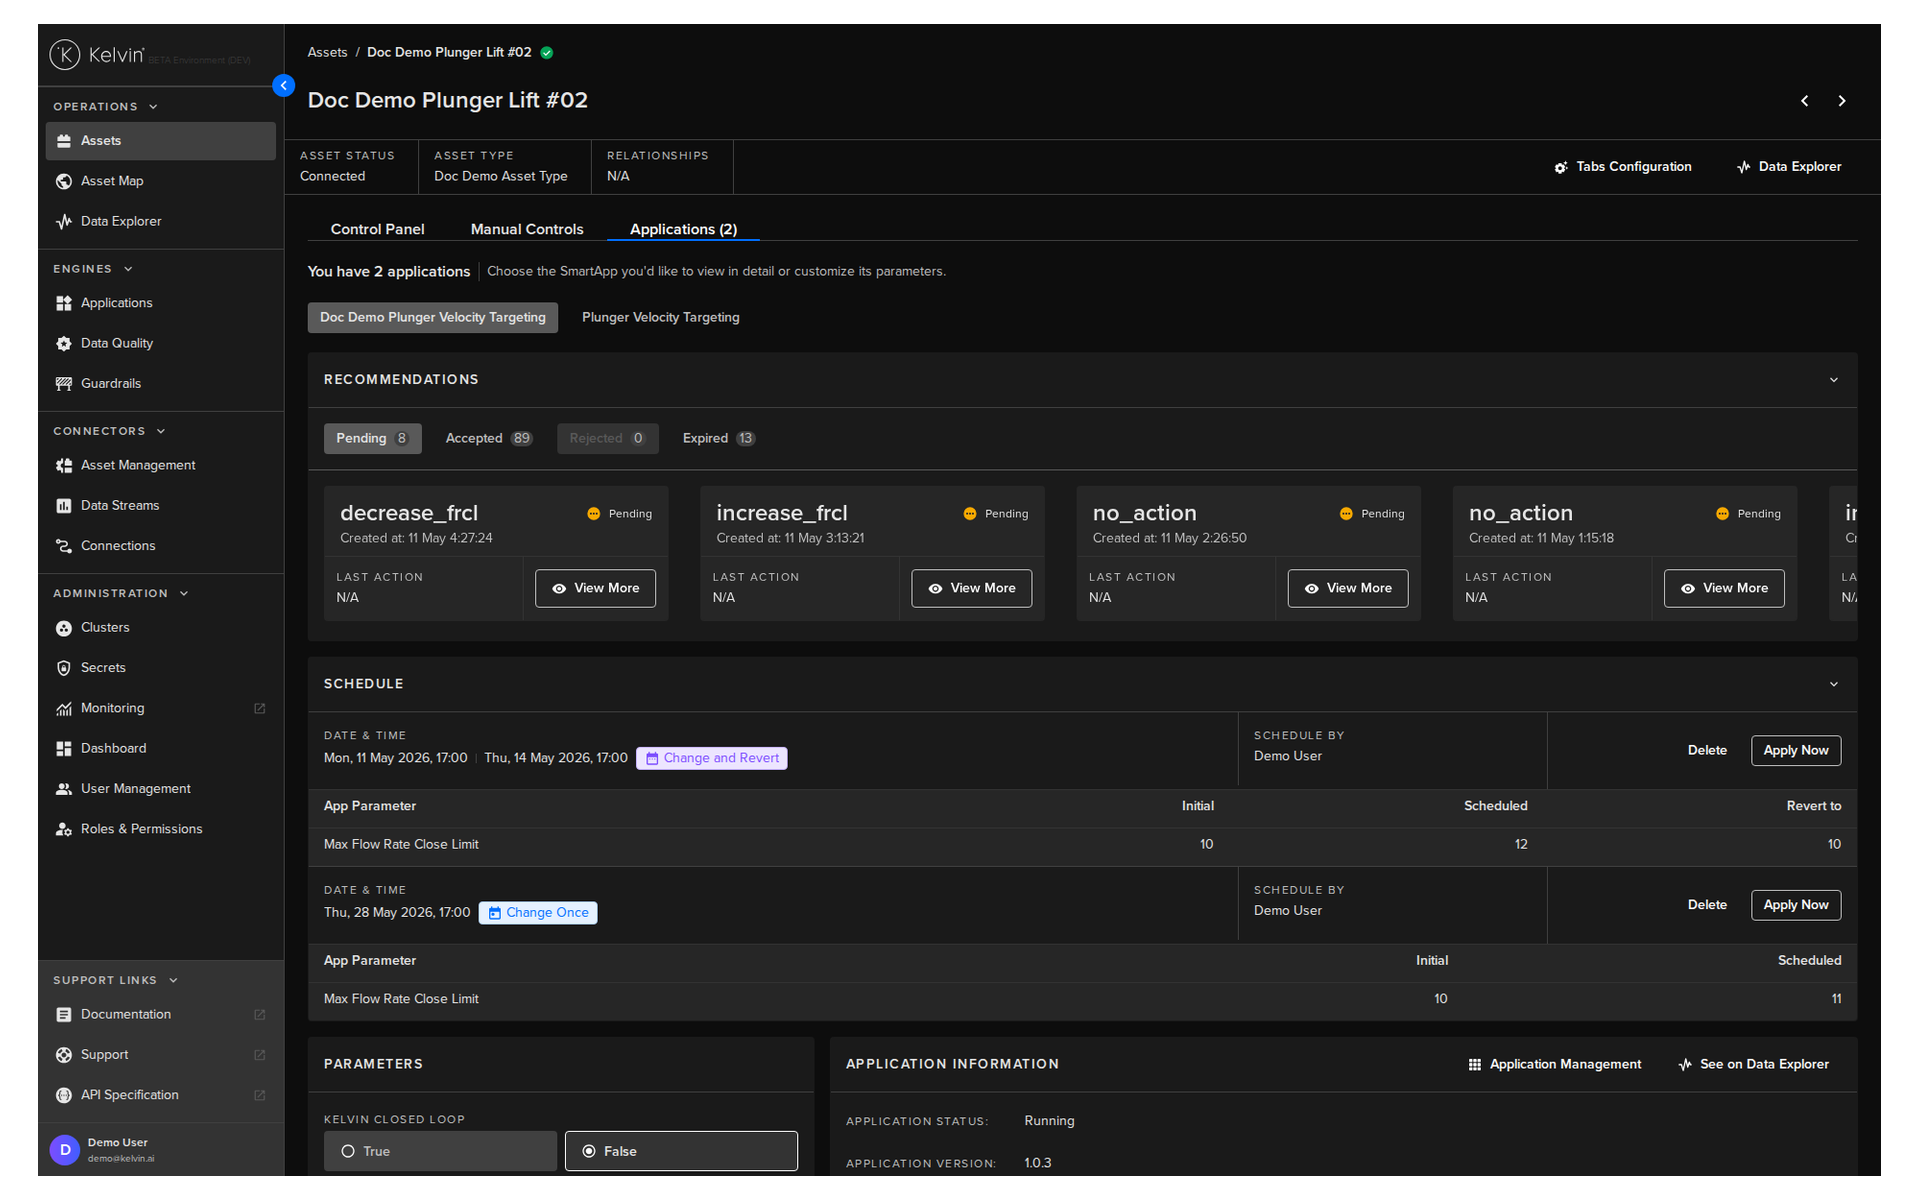
On this tab, the Production Engineers will be able to perform most of the operational tasks required in managing the Assets including;
- See the status of an Asset
- See the Recommendations and its status for each Kelvin SmartApp™
- View all details about an Asset in each Kelvin SmartApp™ that it is associated with
- Change the App Parameter values for any Kelvin SmartApps™
- Set and Manage App Parameter change Schedules
Status and Links
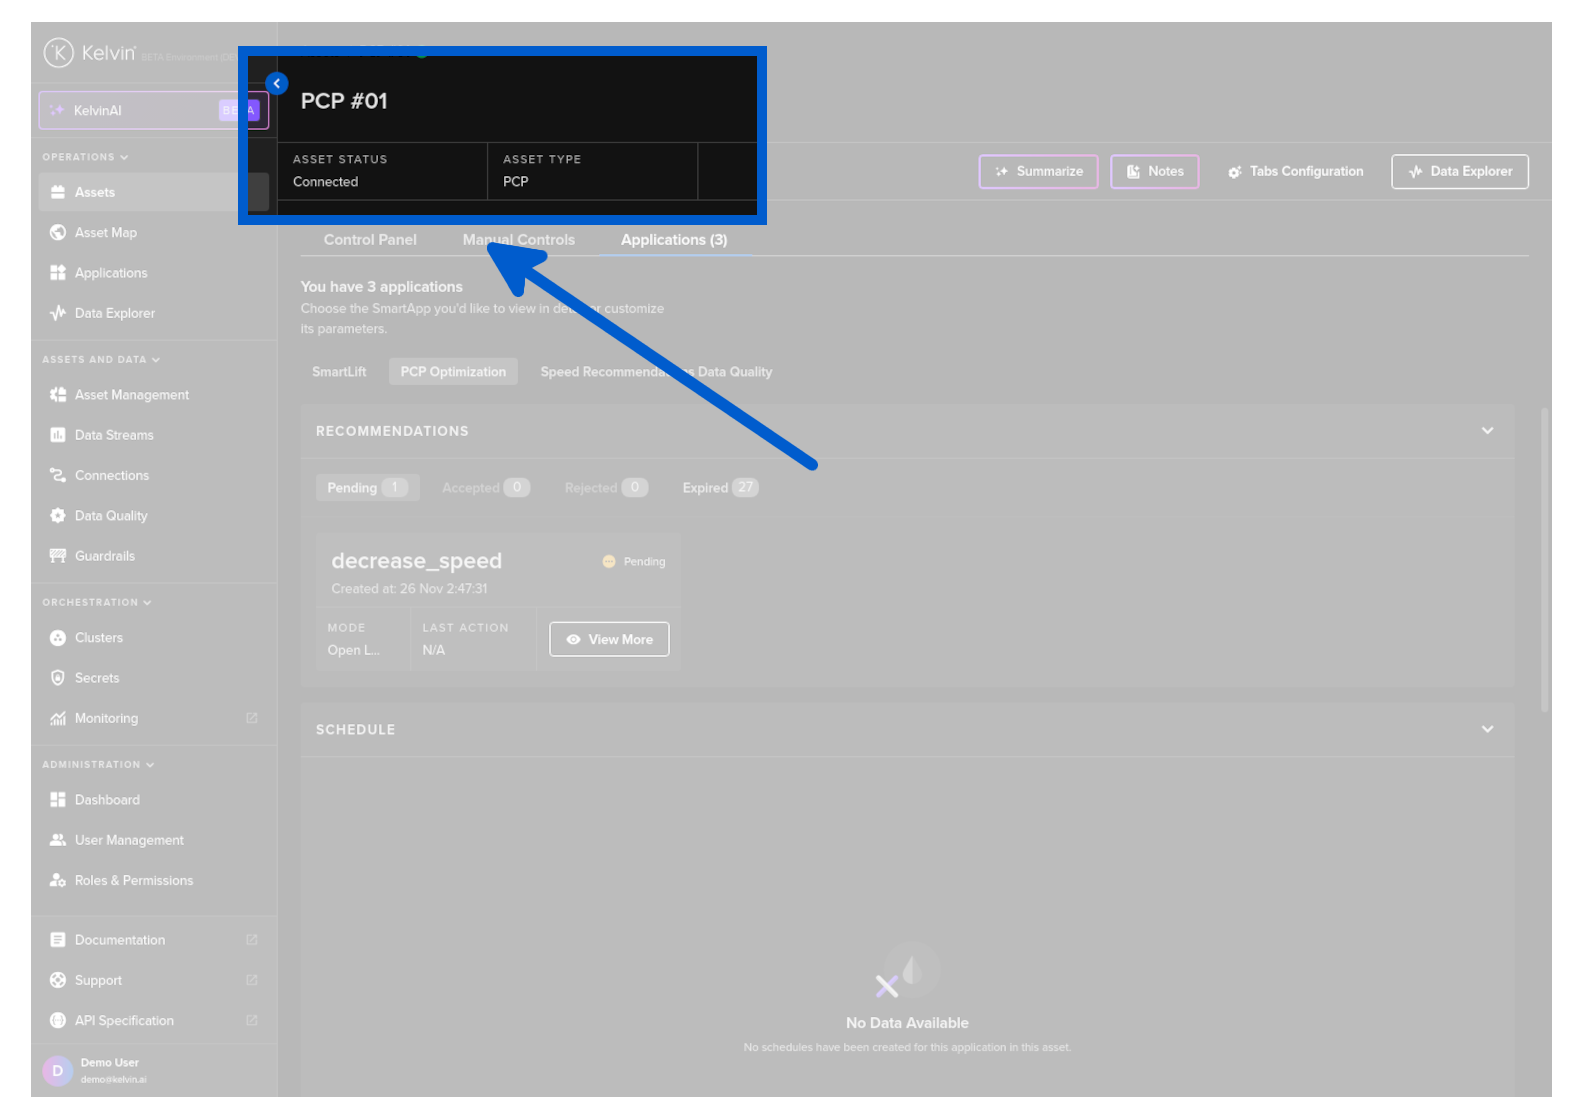
At the top you have the Asset status, the ability to switch between Assets and links to Manual Controls and Data Explorer.
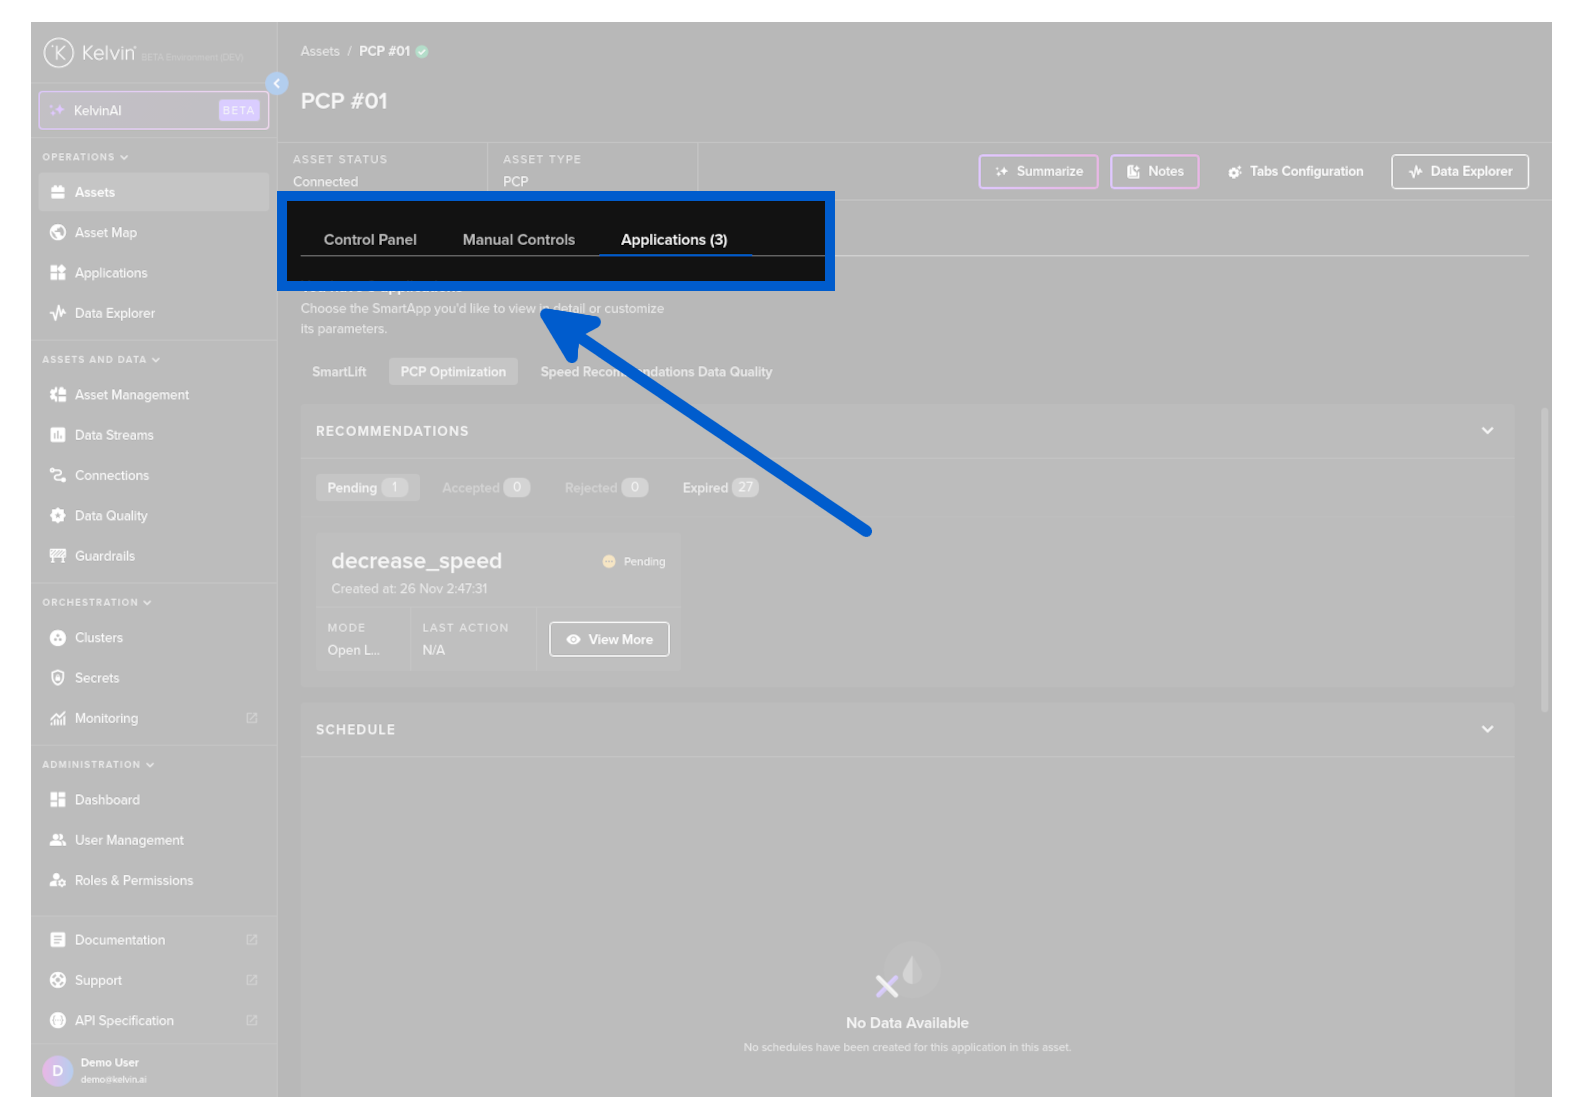
The tabs have all the information and actions for the Asset.
Currently there are three tabs;
- Control Panel: This is a customizable area where you can setup your dashboard for your Assets.
- Manual Controls: This is where you can change any of the Data Stream values that are Read/Write (this is declared in Connections). Read-only values are still be viewed in here.
- Applications or Name of Application: This is where you can manage the App Parameters, schedules and recommendations for each Application associated with the Asset. If there is only one Application, then the name will be shown in the tab instead of the word Applications.
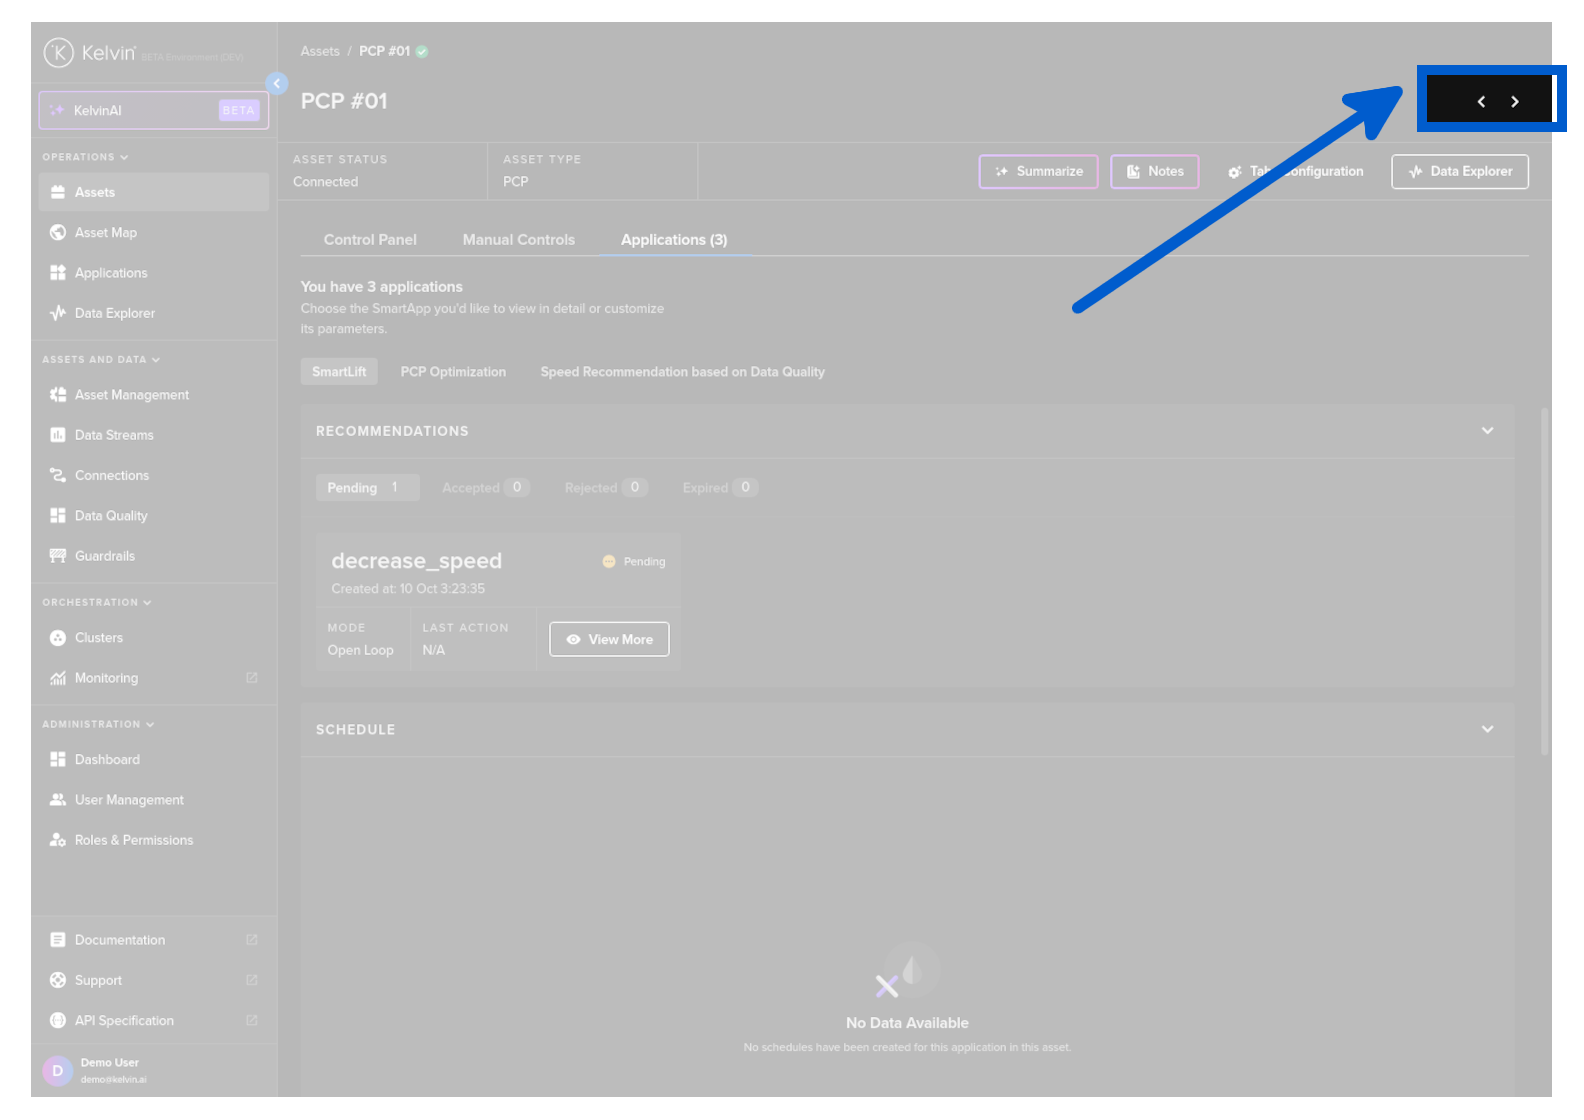
At the top right hand corner you have two buttons to move quickly between the Assets.
Kelvin UI intelligently remembers your search results from the Assets Overview page and will rotate through your Assets that are in the search results ONLY. This allows you to quickly move between the Assets that matter the most to you at that time.
If you want to view other Assets you will need to return to the Assets page and update or clear the search box
At the top you can see the status of the Asset.
| Title | Description |
|---|---|
| Asset Status | This tells you if Kelvin SmartApps™ processing the Asset is connected to the Kelvin Cloud. If it is not connected, then Kelvin SmartApps™ has no access to the Data Streams for its inputs and outputs. |
| Asset Type | This is a group classification for Assets. It has no affect on the operations of the Asset and is used to group similar Assets together for easy viewing. |
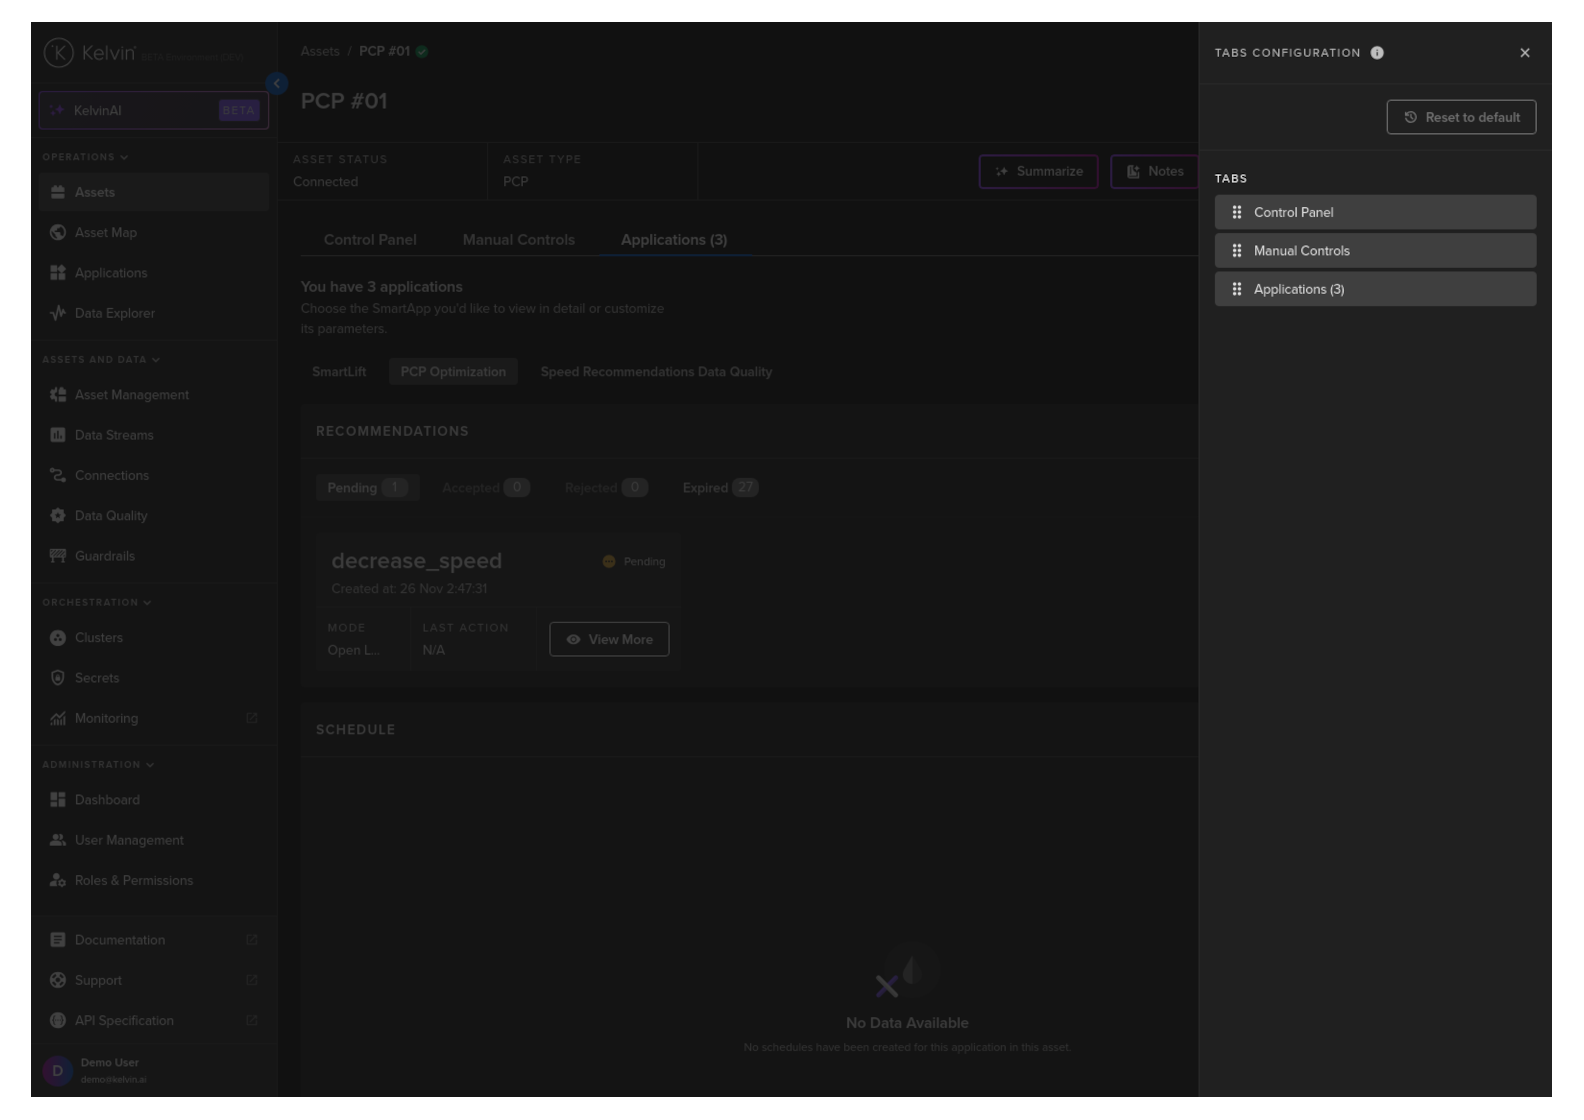
You have full flexibility to customize the tabs for the Asset to optimize your workflow process.
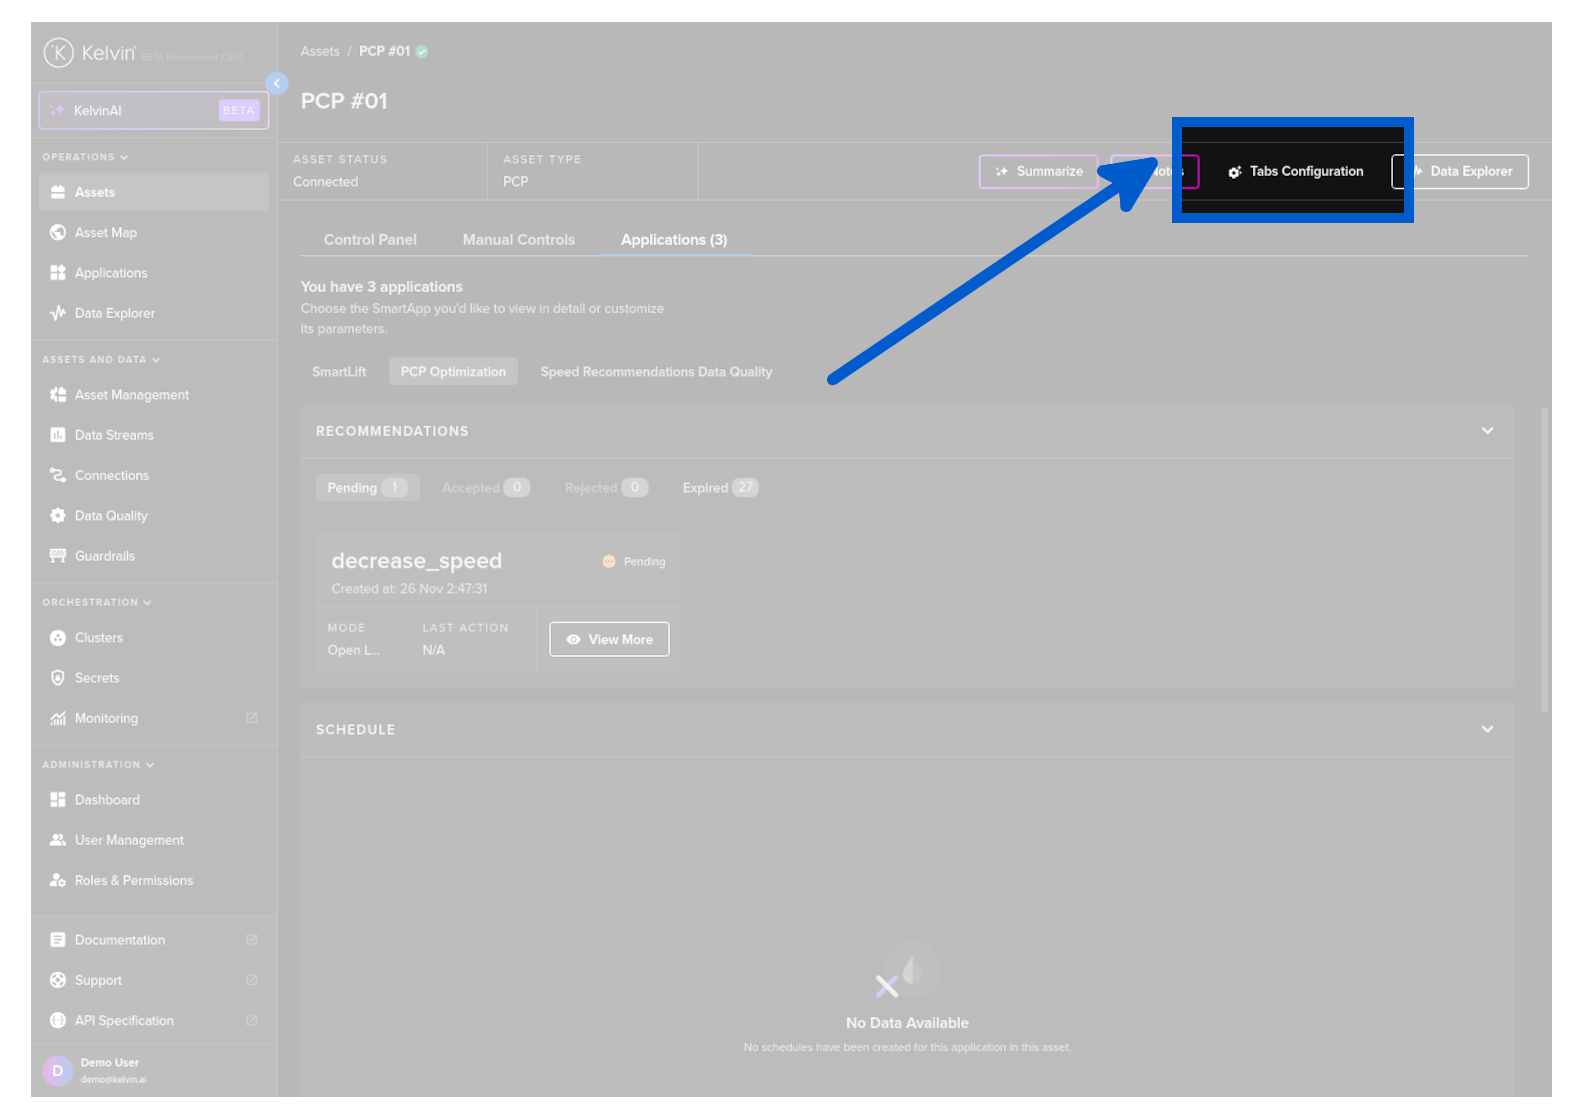
When you click on the button, the options will appear on the side where you can order the tabs to suit your workflow.
This button will take you to the Data Explorer and pre-populate the Asset into the filters selection.
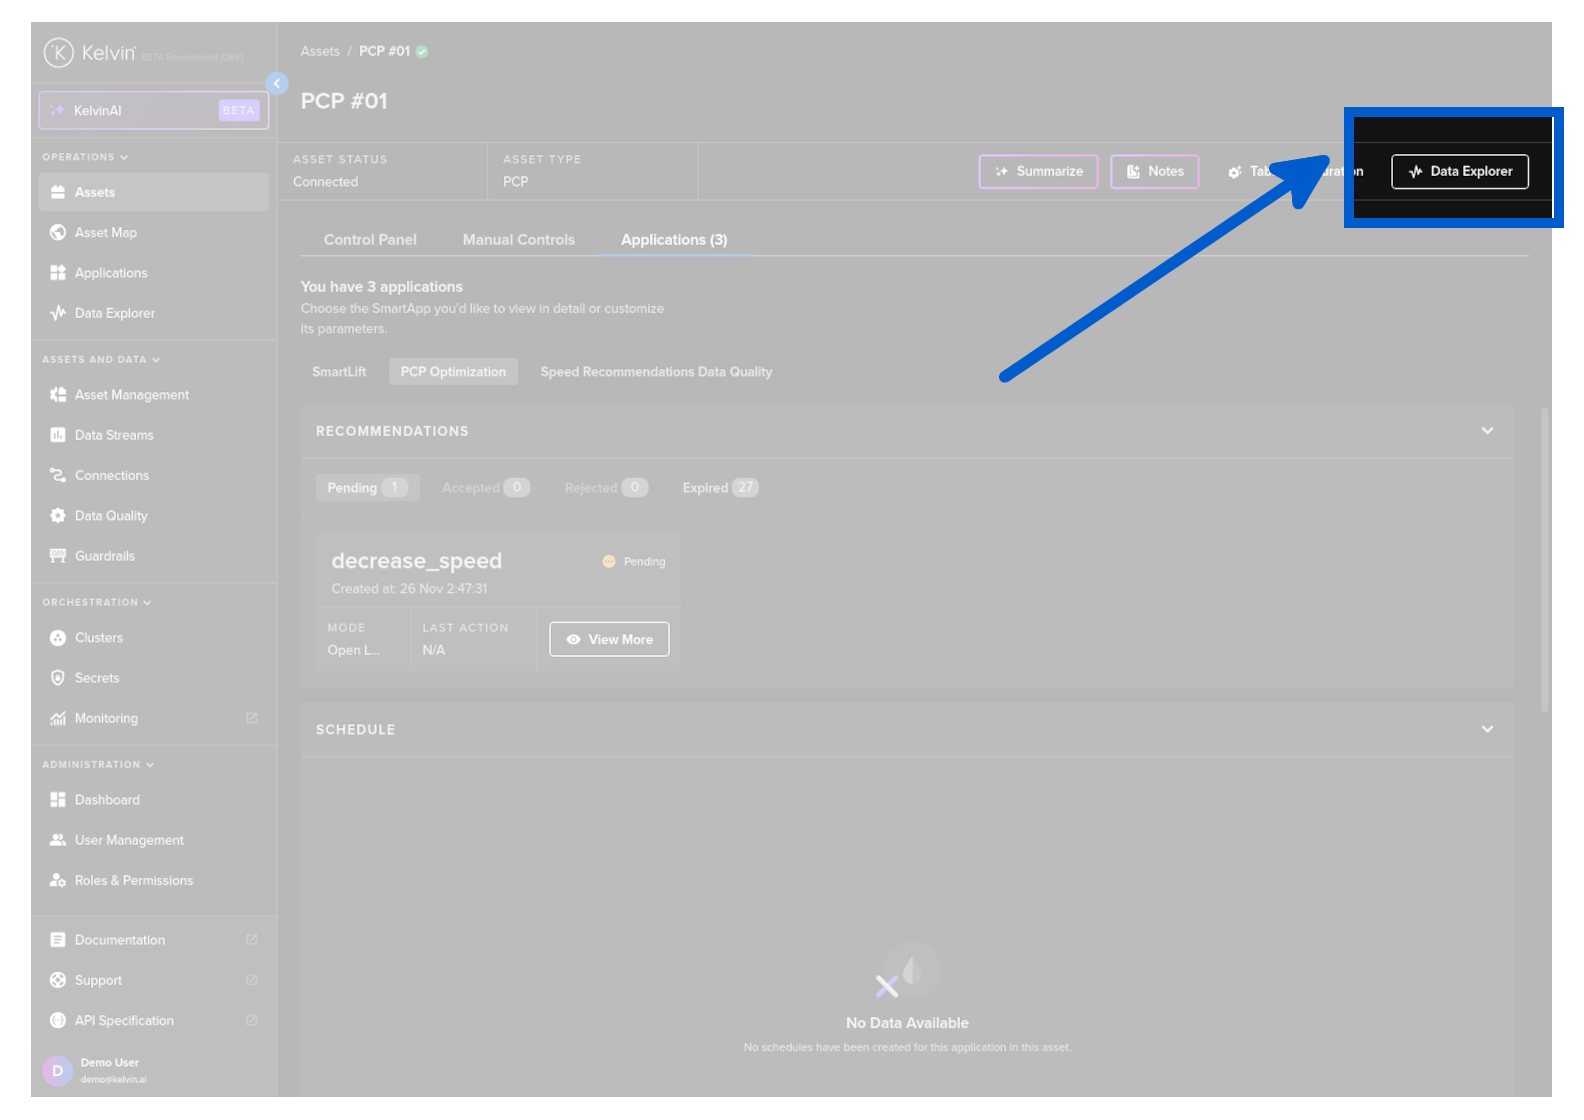
In Data Explorer you can see the historical graphical data about one or more Assets and all the Data Streams associated with the asset.
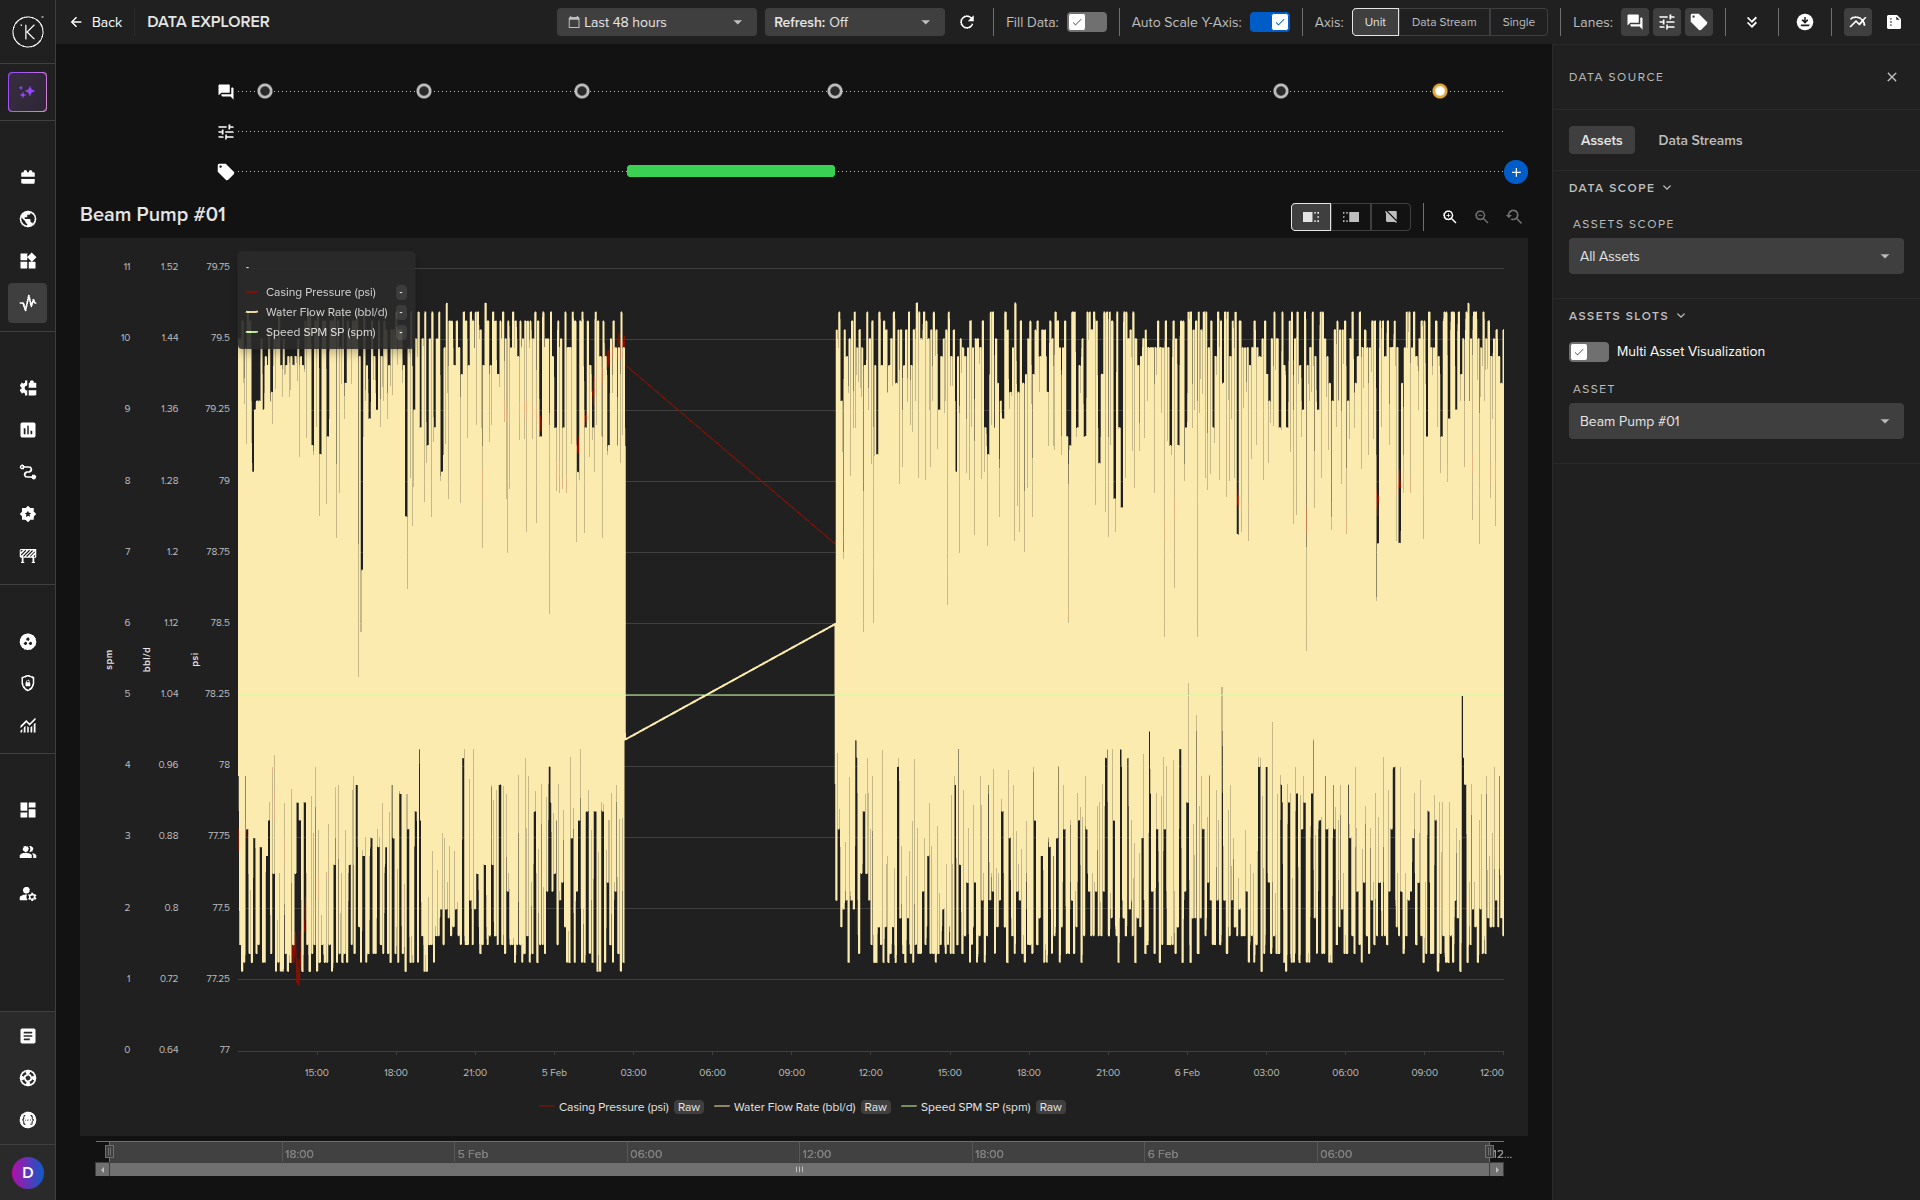
The Data Explorer is tightly integrated with the Kelvin and gives many additional features to the standard graphs including;
- Reference to time when a control change was performed on a Data Stream
- Reference when a Recommendation was activated
- Easily change timezone to see what time events happened according to your location
- Filter which Assets and Data Streams to view - even data that is not related to this Asset.
- Select the Y axis to be either all Data Streams on one axis value range, one axis value range per Data Stream or one axis value range per type (e.g. for temperature, vibrations, etc)
- Independent Y-Axis Zoom controls when displaying multiple y-axis value ranges.
- Multi-chart (up to four) to deeper analysis of multiple Assets together.
To learn all the details and features of the Data Explorer, check out the Data Explorer documentation page in Operations Tools.
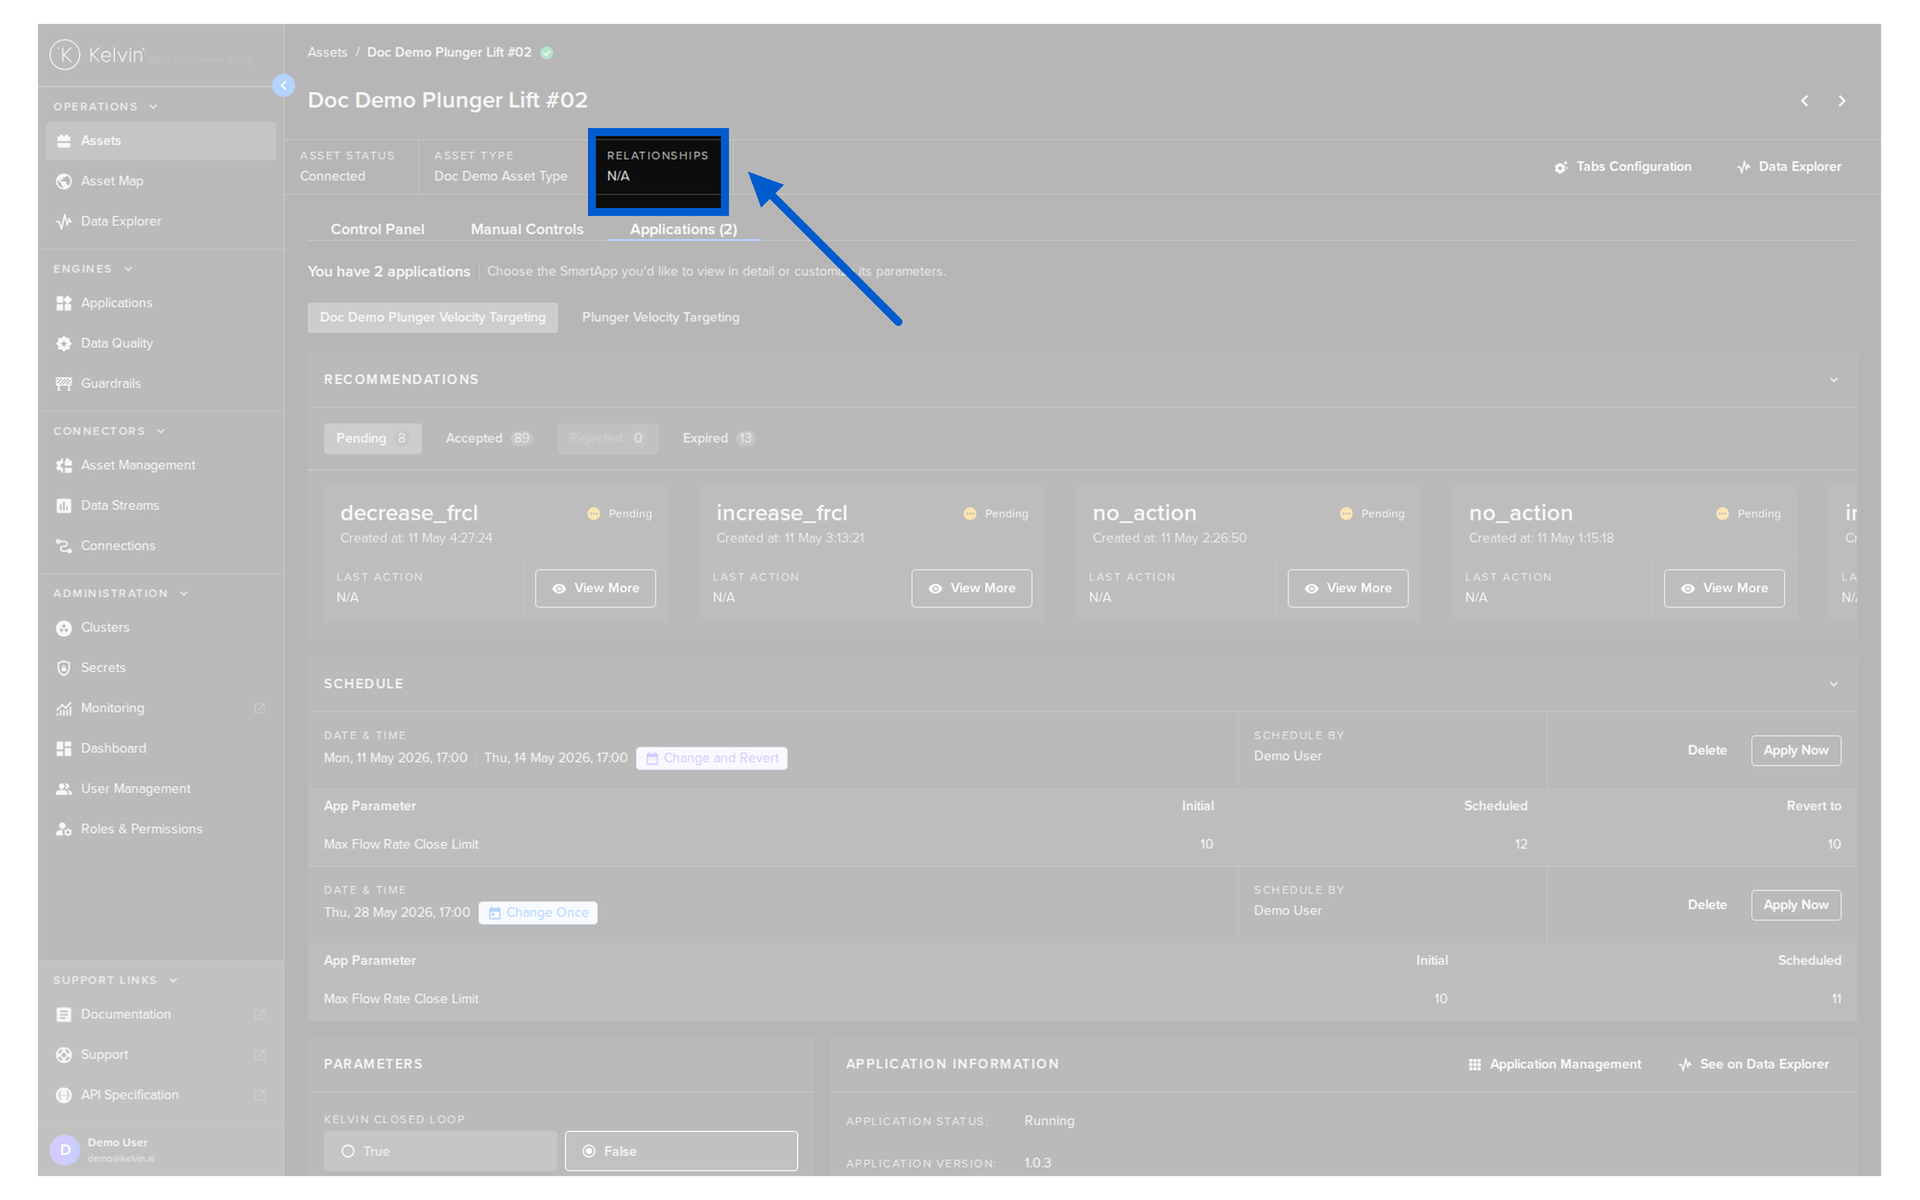
Relationships
Assets can be connected to other related Assets using the relationships property. When an Asset has relationships configured, they are visible in the Asset Status section of the Asset Details page.
Hovering over the relationships indicator displays a tooltip listing all related Assets. Each Asset name in the tooltip is a clickable link that navigates directly to that Asset's details page.
To learn how to configure relationships between Assets, see the Asset Relationships documentation.