Asset Maps Overview
On this page you will learn the general concepts of Asset Maps.
Advanced Geospatial Visualization for Asset Management
Asset Maps enables precise geospatial visualization and analysis of both stationary and dynamic assets. This tool is designed for real-time insights and operational clarity.
Try our Kelvin Map demo yourself !
Key Features
Geolocation Mapping with Network Links
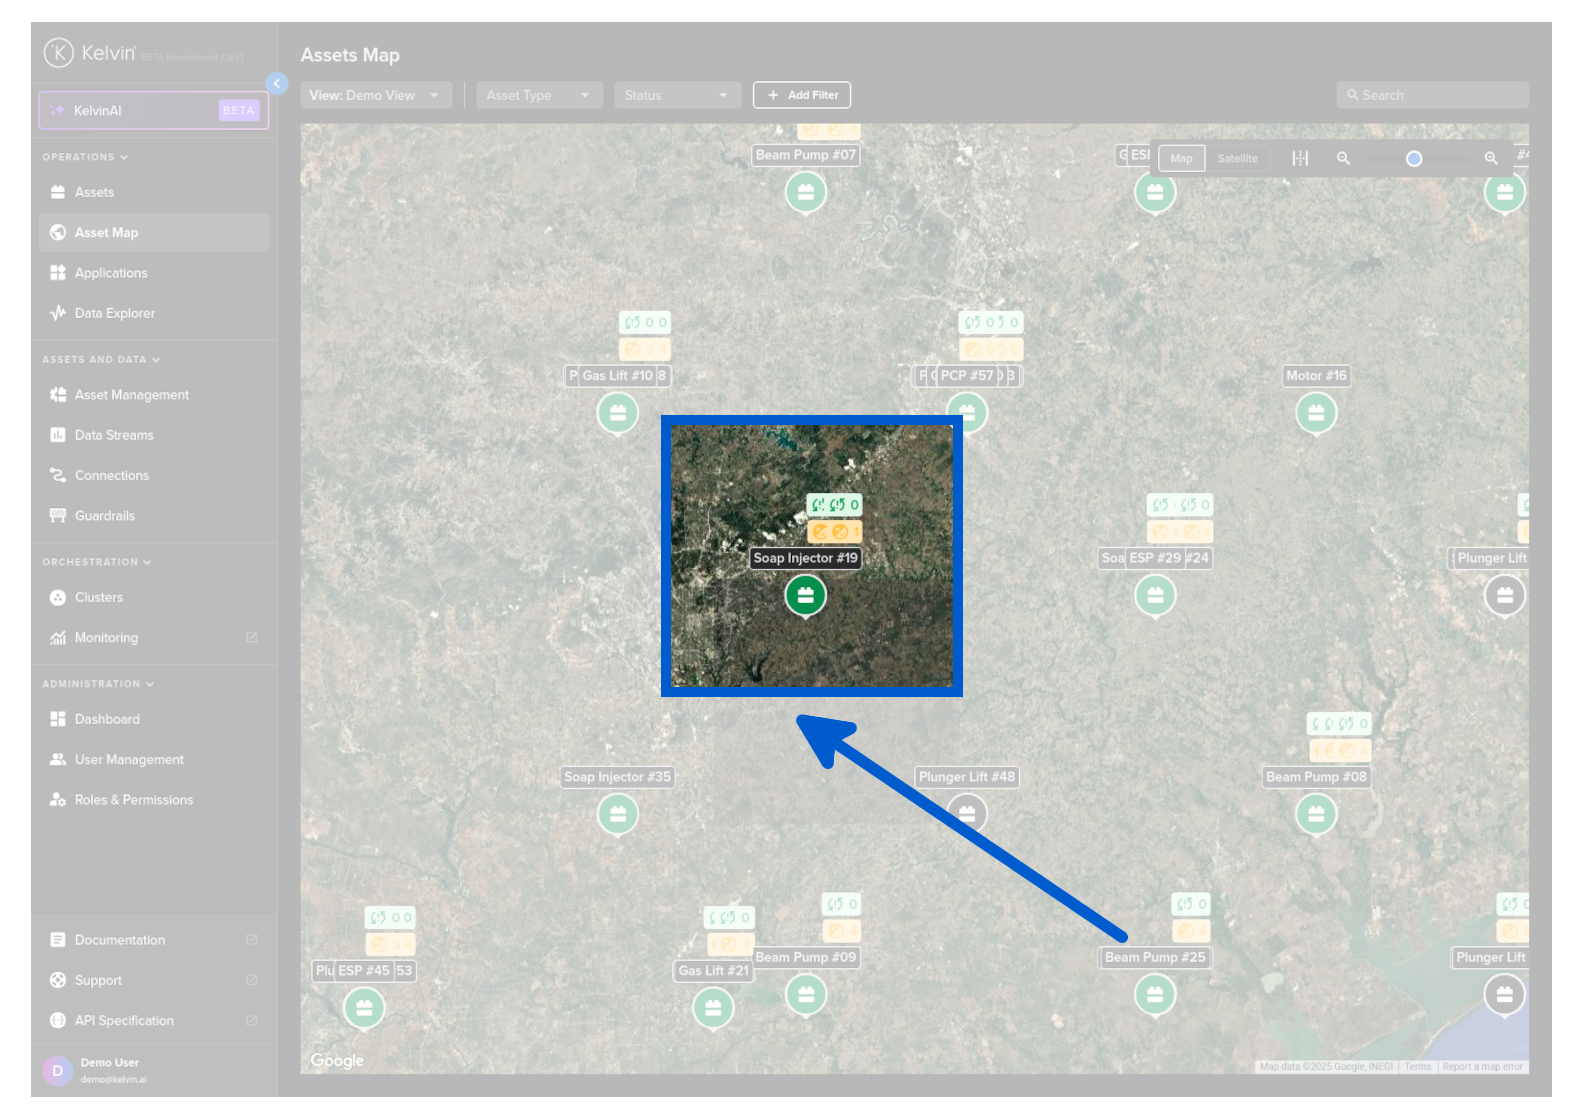
Asset Maps displays precise geolocations of assets, with visual connections between related entities. Whether you are monitoring static infrastructures like oil wells or tracking mobile fleets such as delivery trucks, the platform provides actionable spatial context.
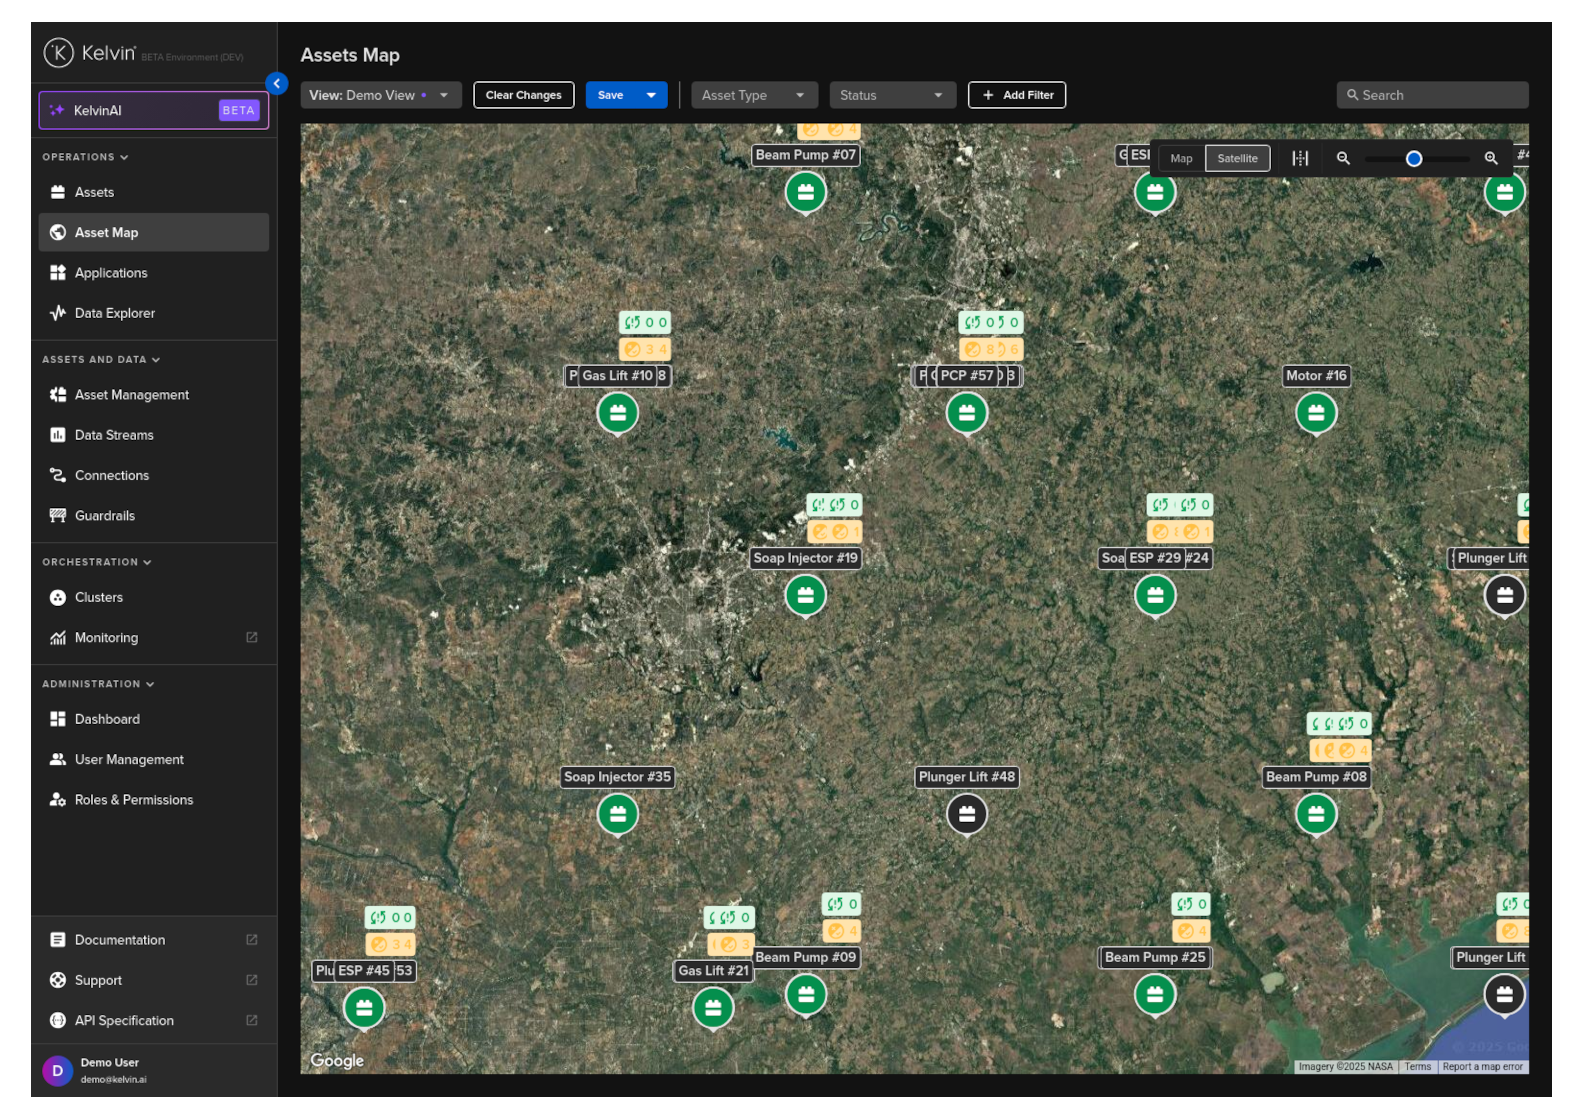
This feature uses Google Maps engine so you can also use some of the standard features such as satellite view, mouse zoom in and out, etc. like using Google Maps in a browser.
Key Metrics
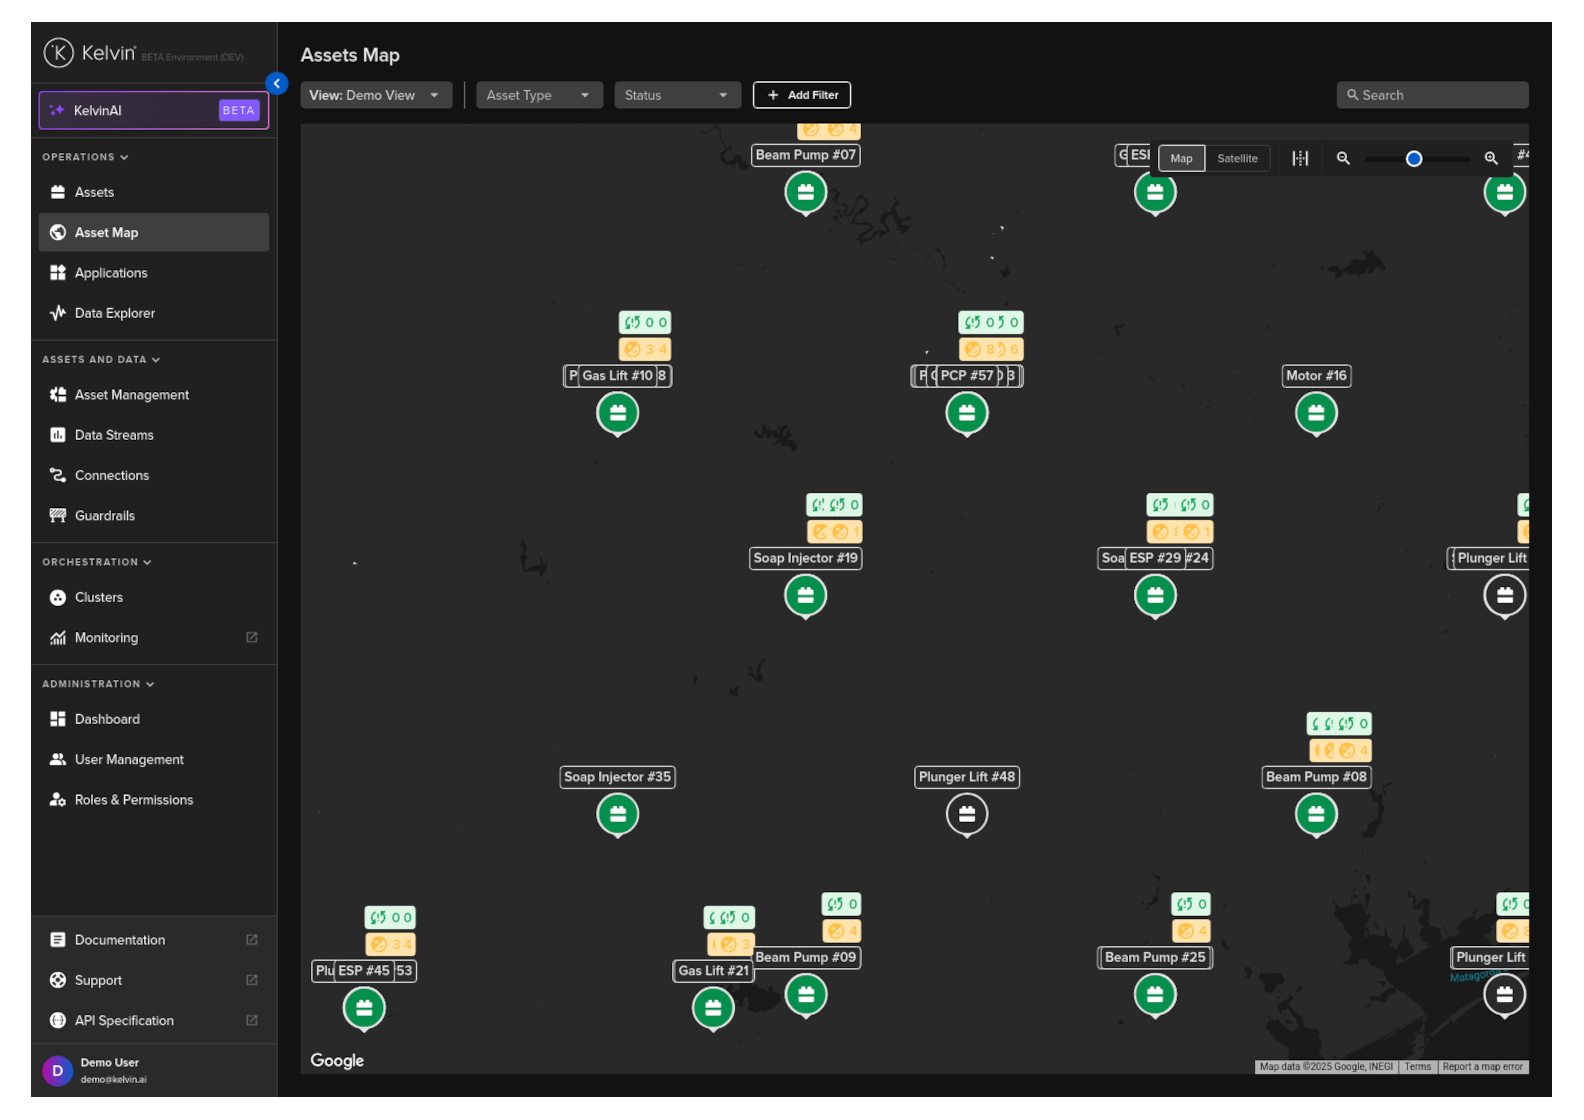
On the map you will see where your Assets are currently located.
With each Asset you will also see key metrics tagged with the asset pin on the map.
Details
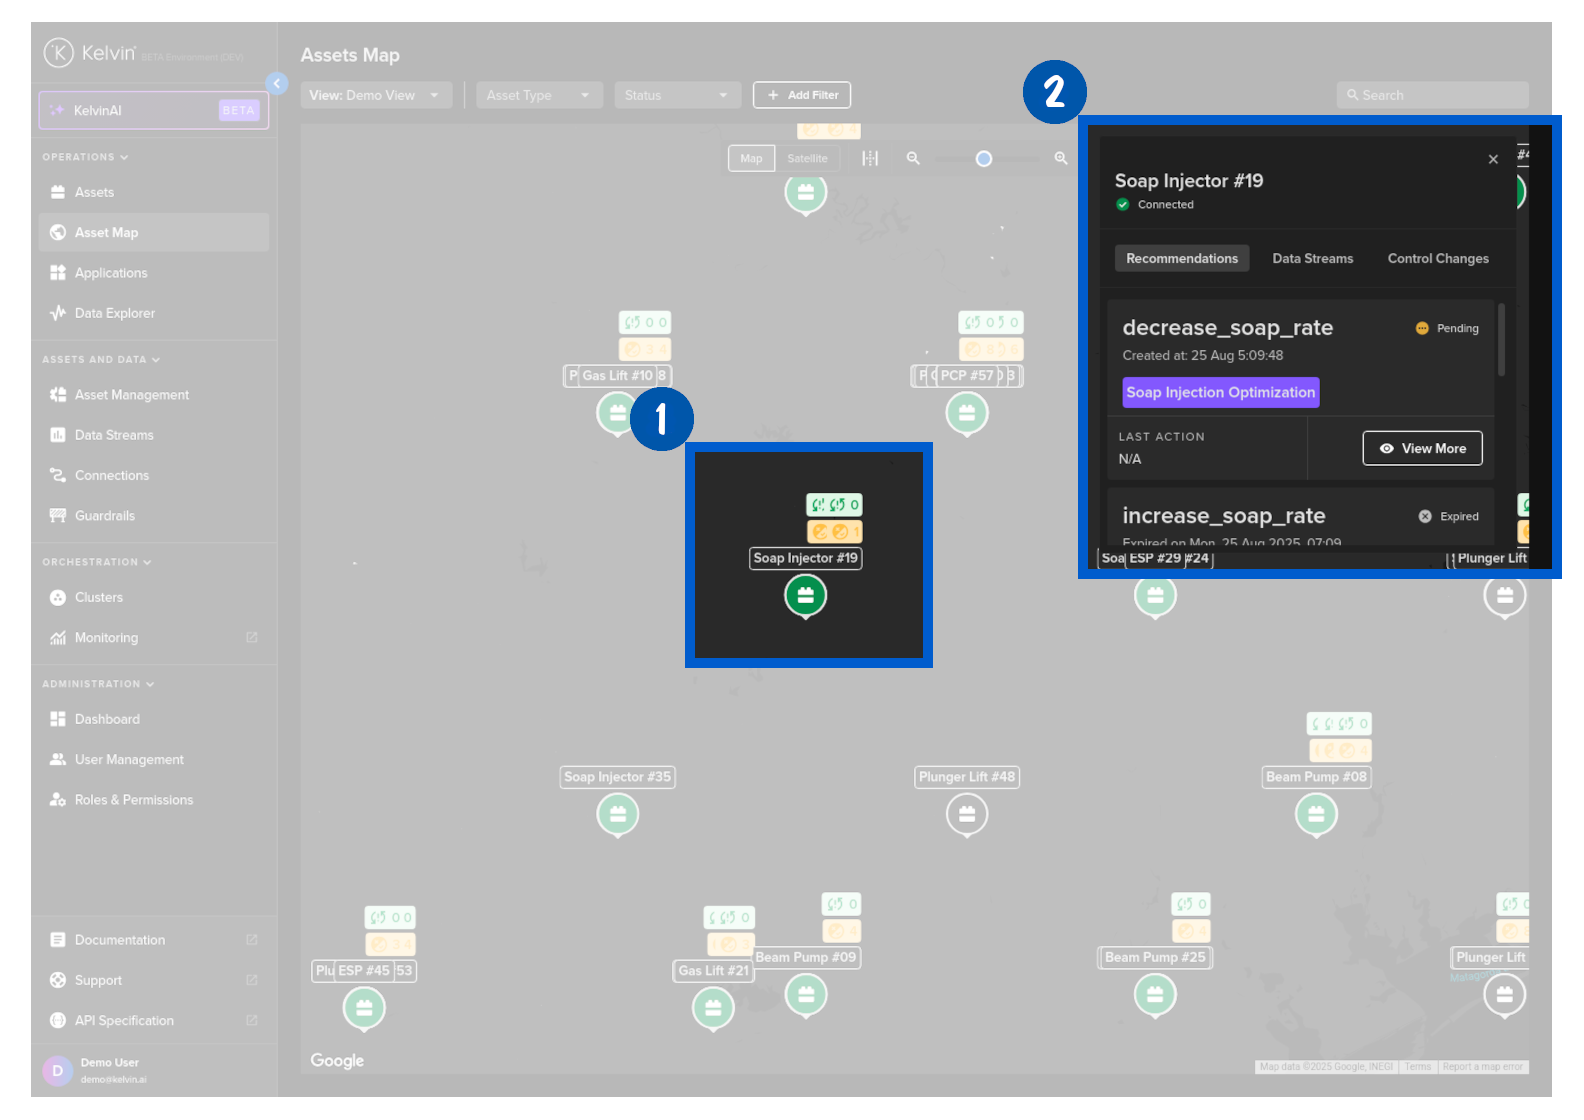
You can also see more details with each asset on a popup.
Benefits for Technical Users
Enhanced Geospatial Context: Integrates spatial data with operational metrics to provide a holistic view of asset networks.
Streamlined Analysis: Supports efficient monitoring and analysis by combining geospatial mapping with structured data views.
Versatility Across Applications: Applicable to a range of use cases, from static infrastructure monitoring to dynamic fleet tracking.