Applications Tab
The Data Streams for an Asset can be and controlled by one or more Applications.
In the Applications tab, you can view and manage all the information from all the Applications associated with this Asset.
Note
If there is only one Application associated with the Asset, then instead of the word Applications in the tab, it will just show the actual Application Name.
- View and take action on Recommendations
- View any App Parameter changes that are scheduled
- View and Change the App Parameters for the Asset
- View general information about the Application and some quick links.
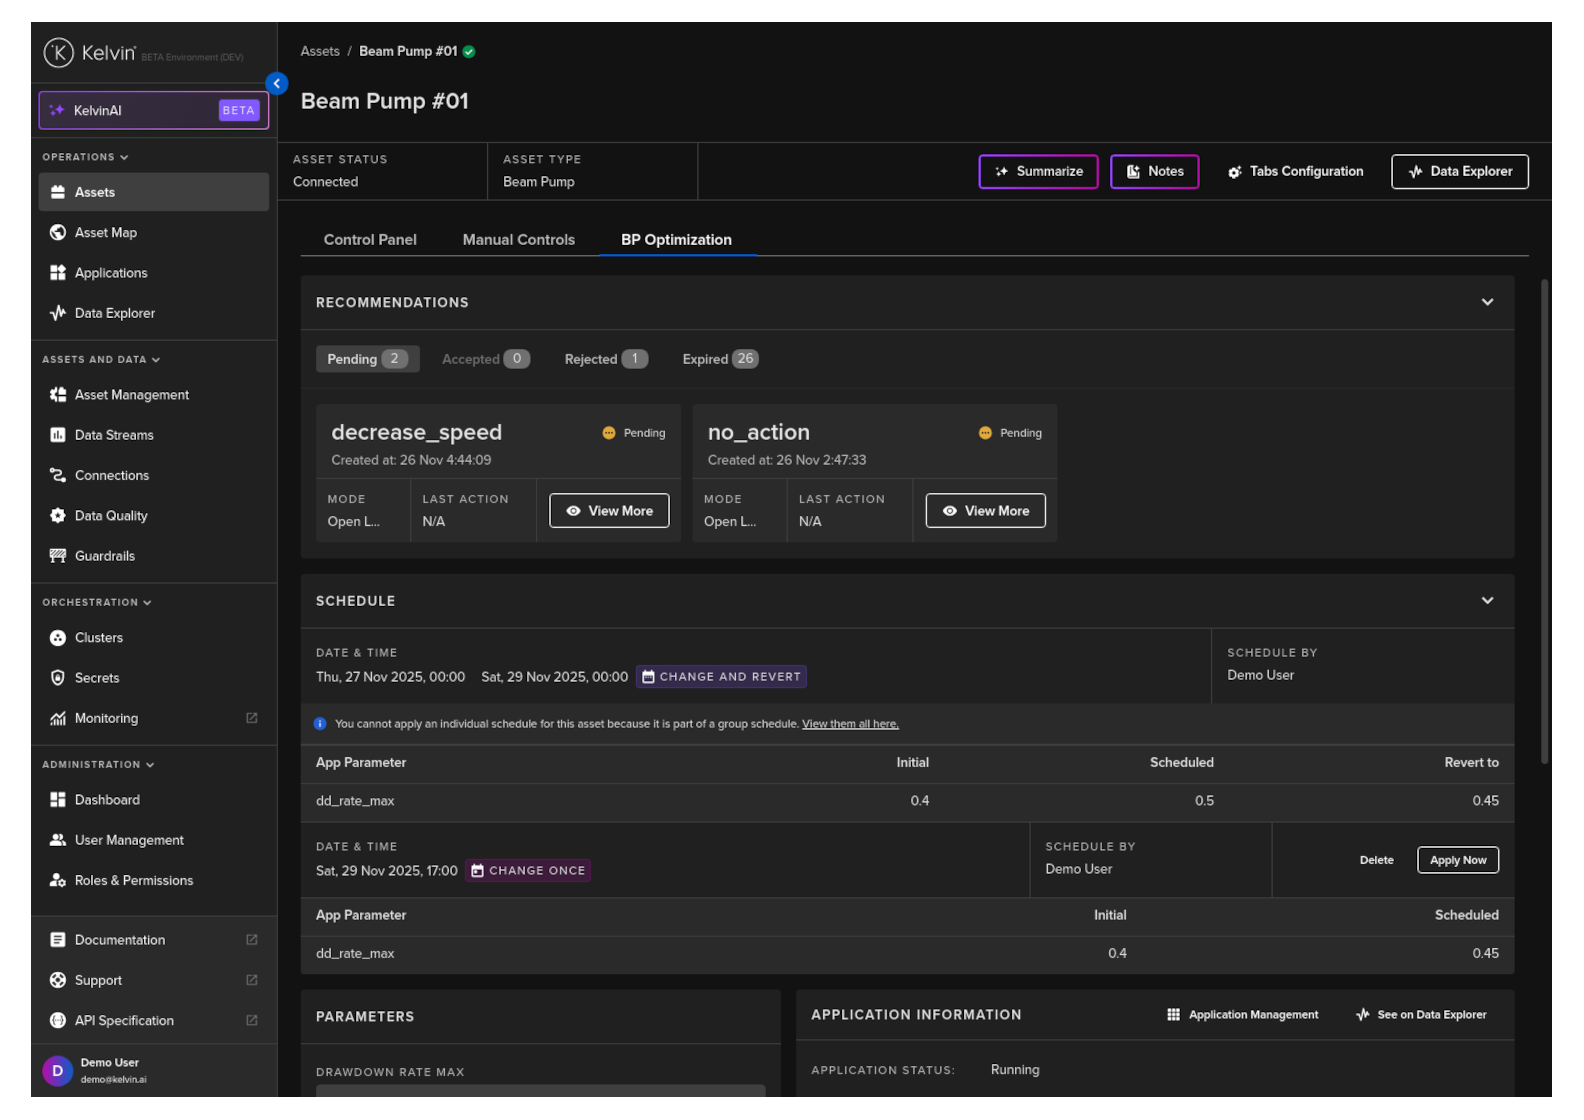
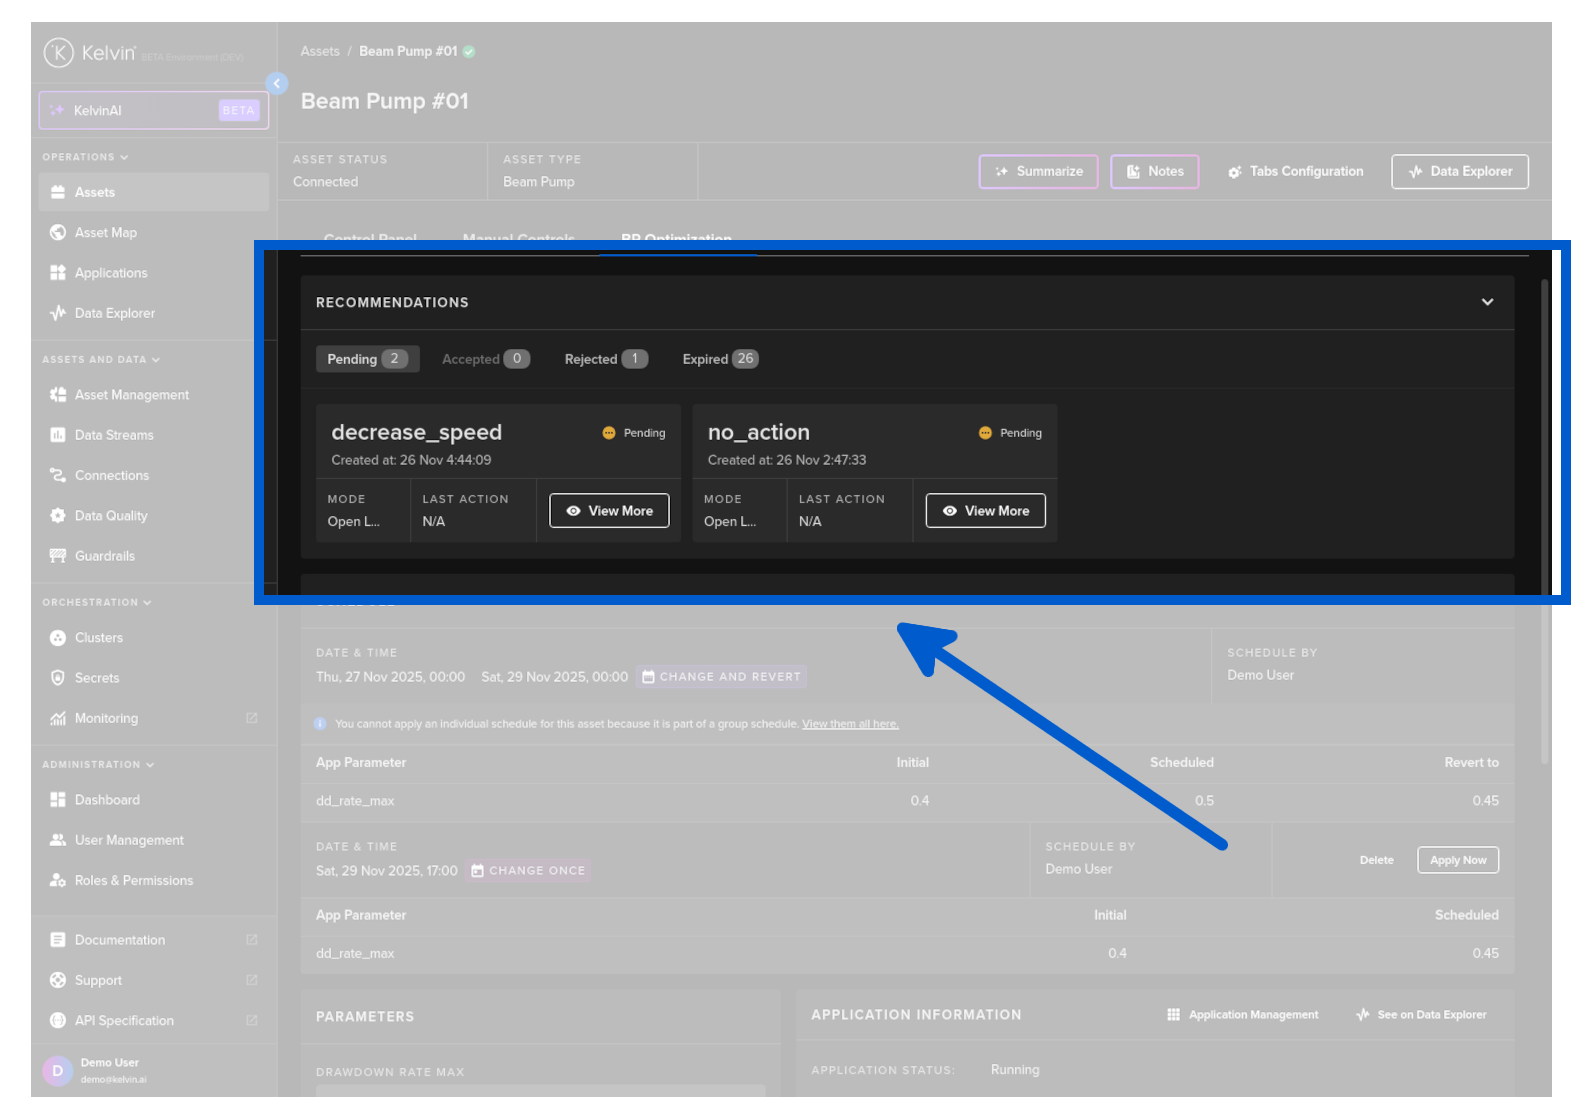
Recommendations
This is where you can see all the Recommendations. They are grouped into the four possible statuses; Pending, Accepted, Rejected, Expired. If there are Recommendations in each group then you will see the number of Recommendations in the group and you will be able to click on the text and a list of Recommendations in date/time order will be displayed.
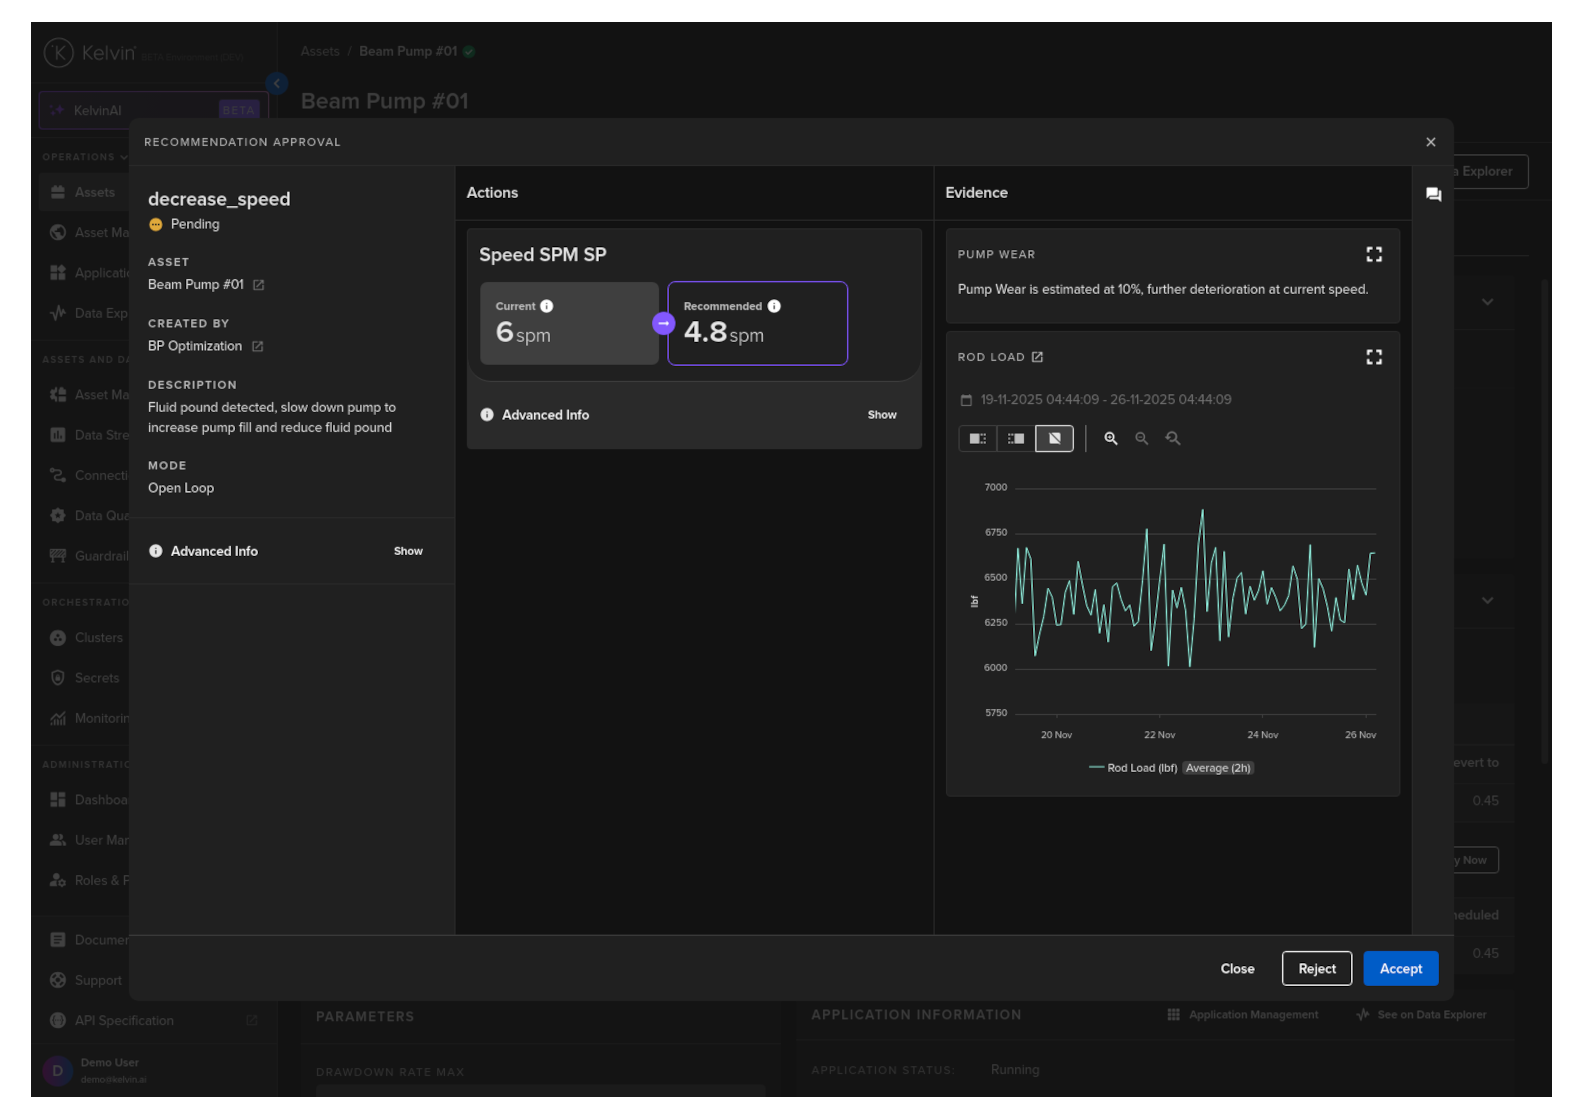
When you click on View More button you will see the standard Recommendation popup.
Note
You can also leave comments about the recommendation as a comment for other users to read or as a note for future reference.
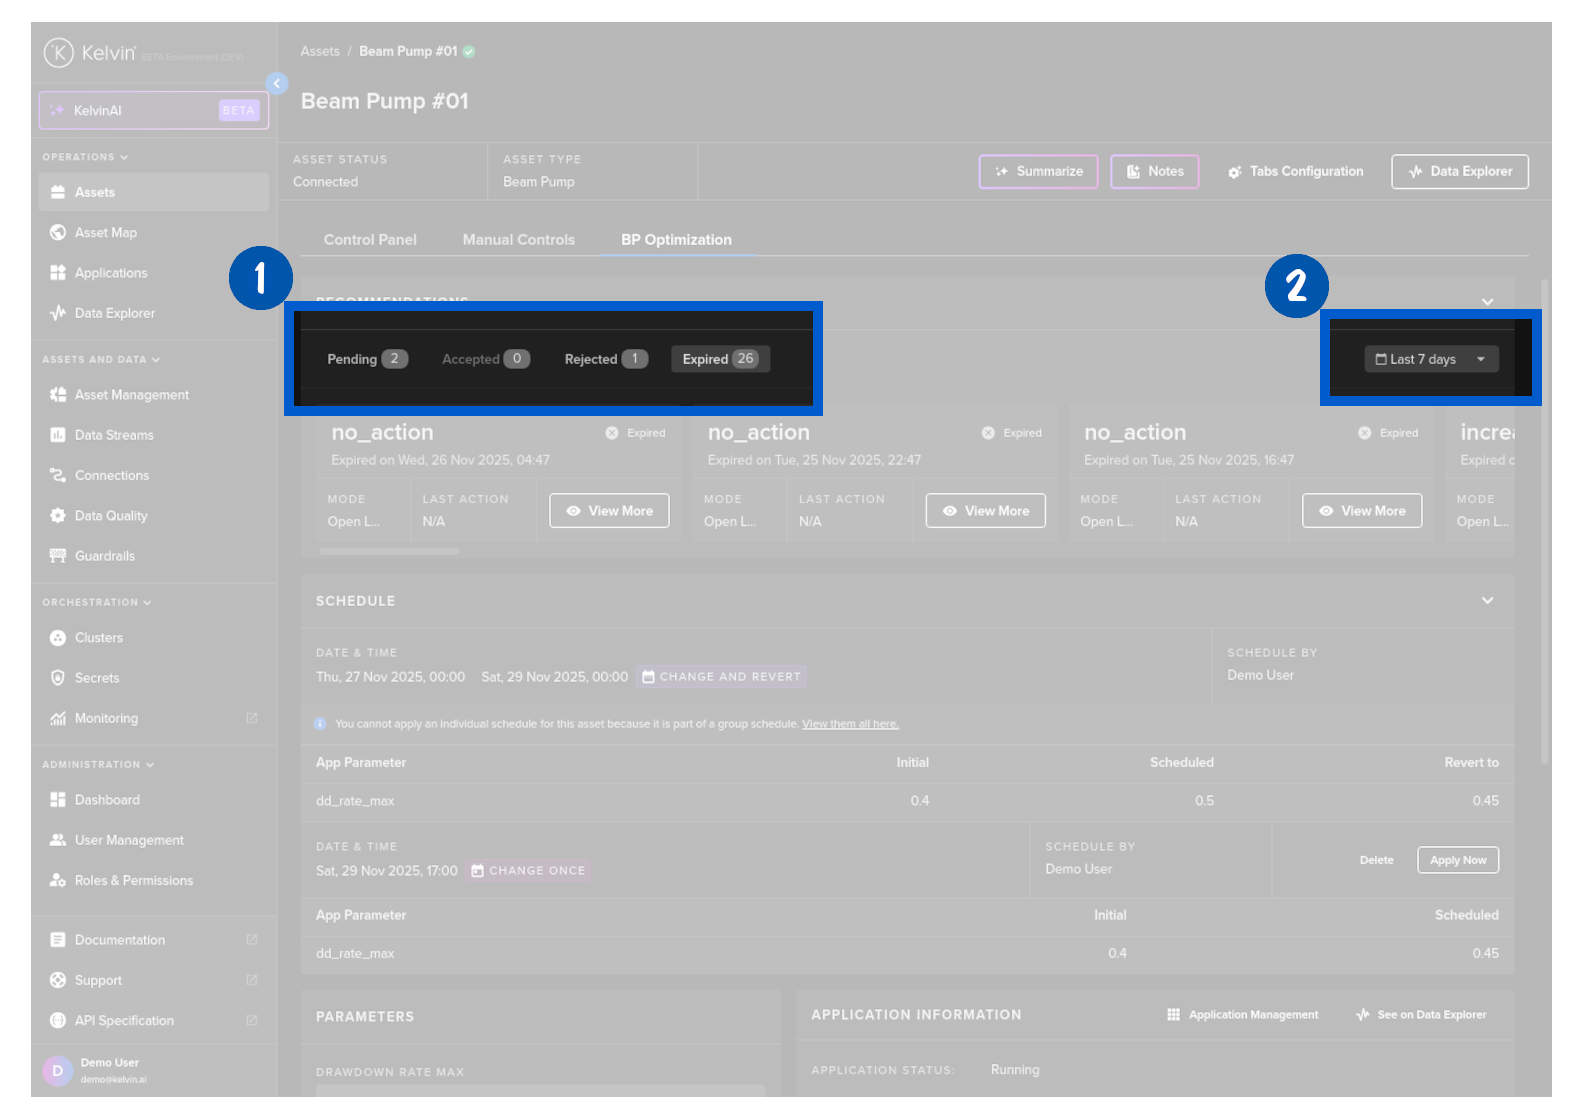
For the Pending status, you will see them all regardless of the age of the Recommendation. Normally Recommendations will have an expire date so will automatically convert to Expired after some time, though it is possible to have a Recommendation remain open indefinitely until a Operations Engineers takes a decision.
For the other three statuses, Accepted, Rejected and Expired, you can select the time range to view up to a maximum of the past 7 days. Anything older will not be shown here.
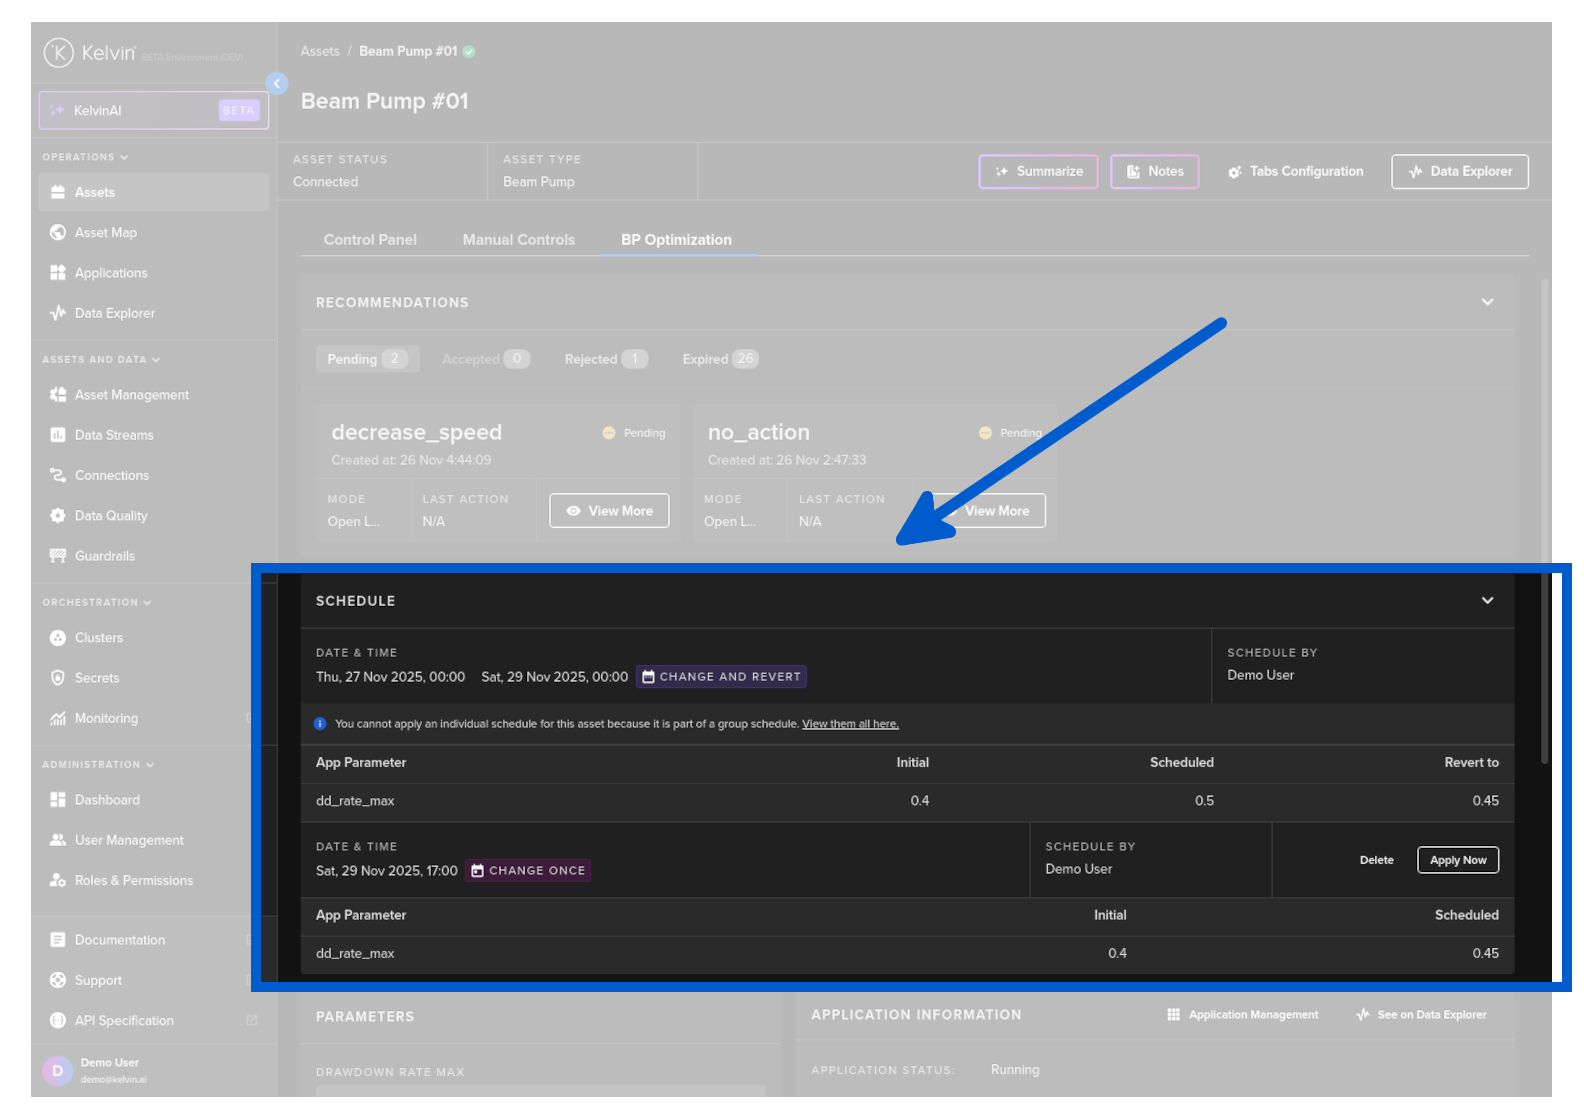
Schedule
This is where you can see all the Schedules that are queued for automated Parameter changes.
Only schedules planned to be implemented in the future are shown here. All schedules that have already implemented or canceled will not be shown here.
If the schedule only has one Asset to change, then you will be able to apply the schedule immediately from this screen.
Schedules with multiple Assets to update can only be updated by going to the Applications page and viewing the Schedules tab.
Schedules can be created lower down in the Parameters section when updating App Parameters. This is discussed in full detail in Schedules.
Parameters
In the Parameters section, you can update the parameters for this Asset in Kelvin SmartApps™. Changes are sent immediately to the edge. If the edge is offline, updates will be sent the next time the Cluster connects to the Kelvin Platform.
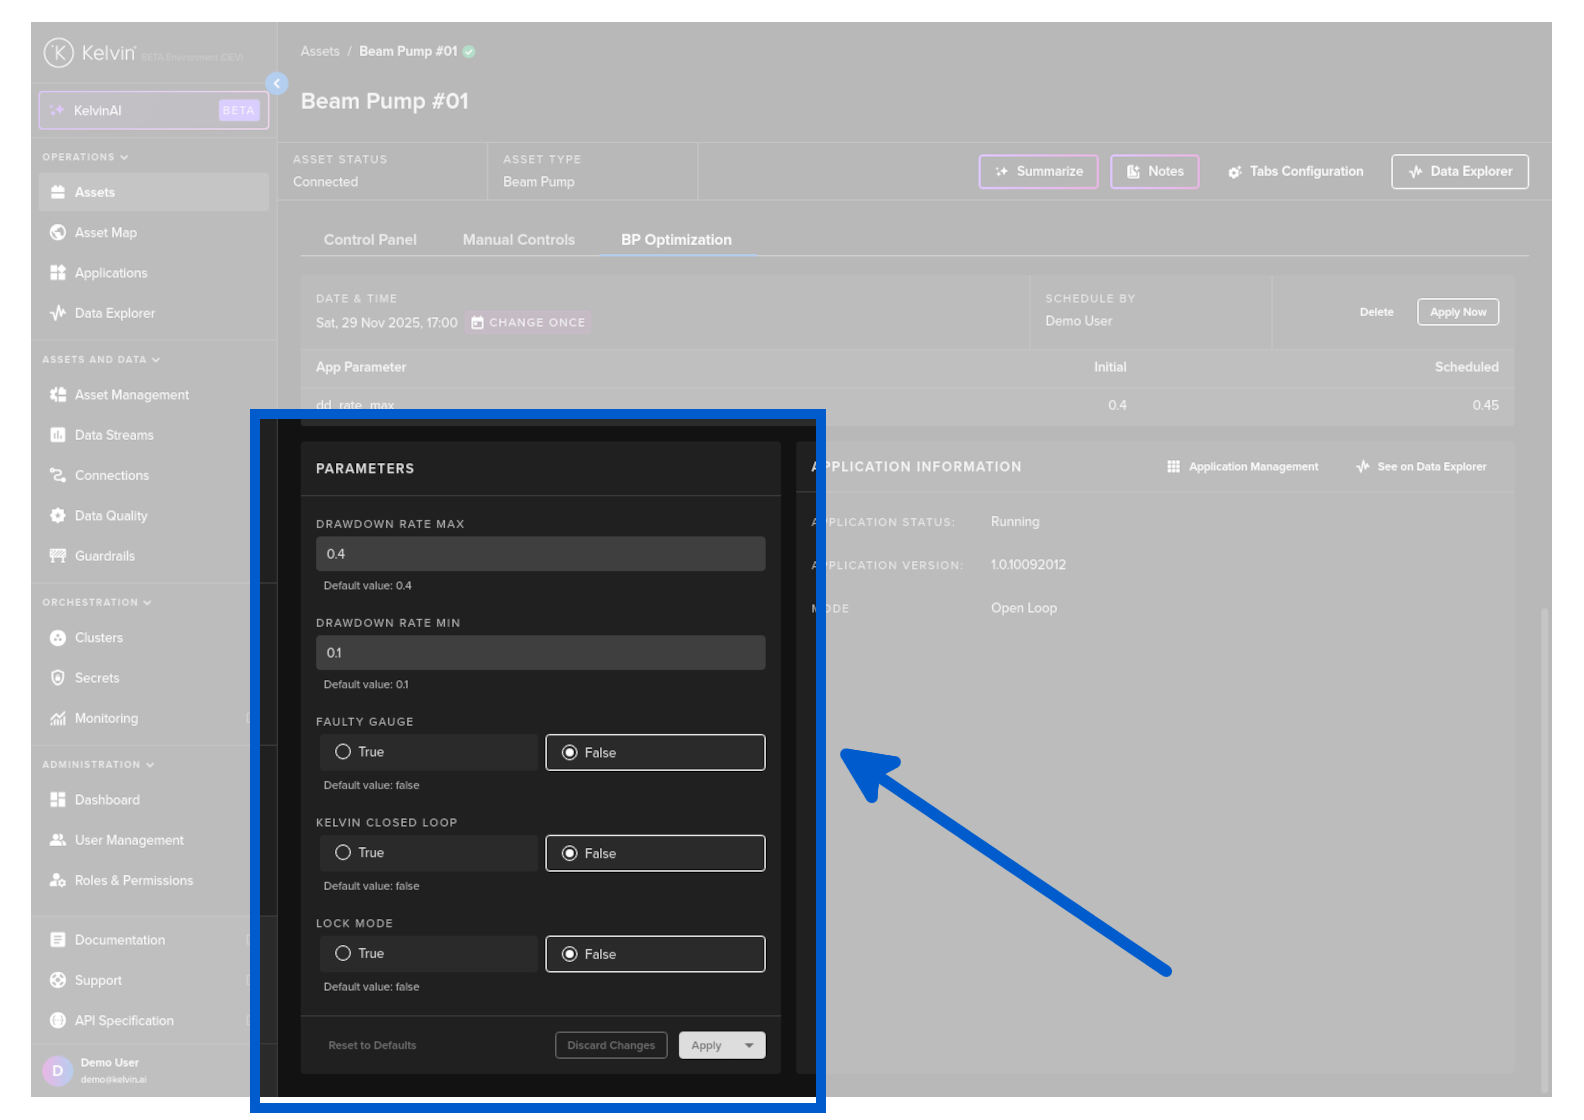
Schedules can also be created here when updating App Parameters. This is discussed in full detail in Schedules.
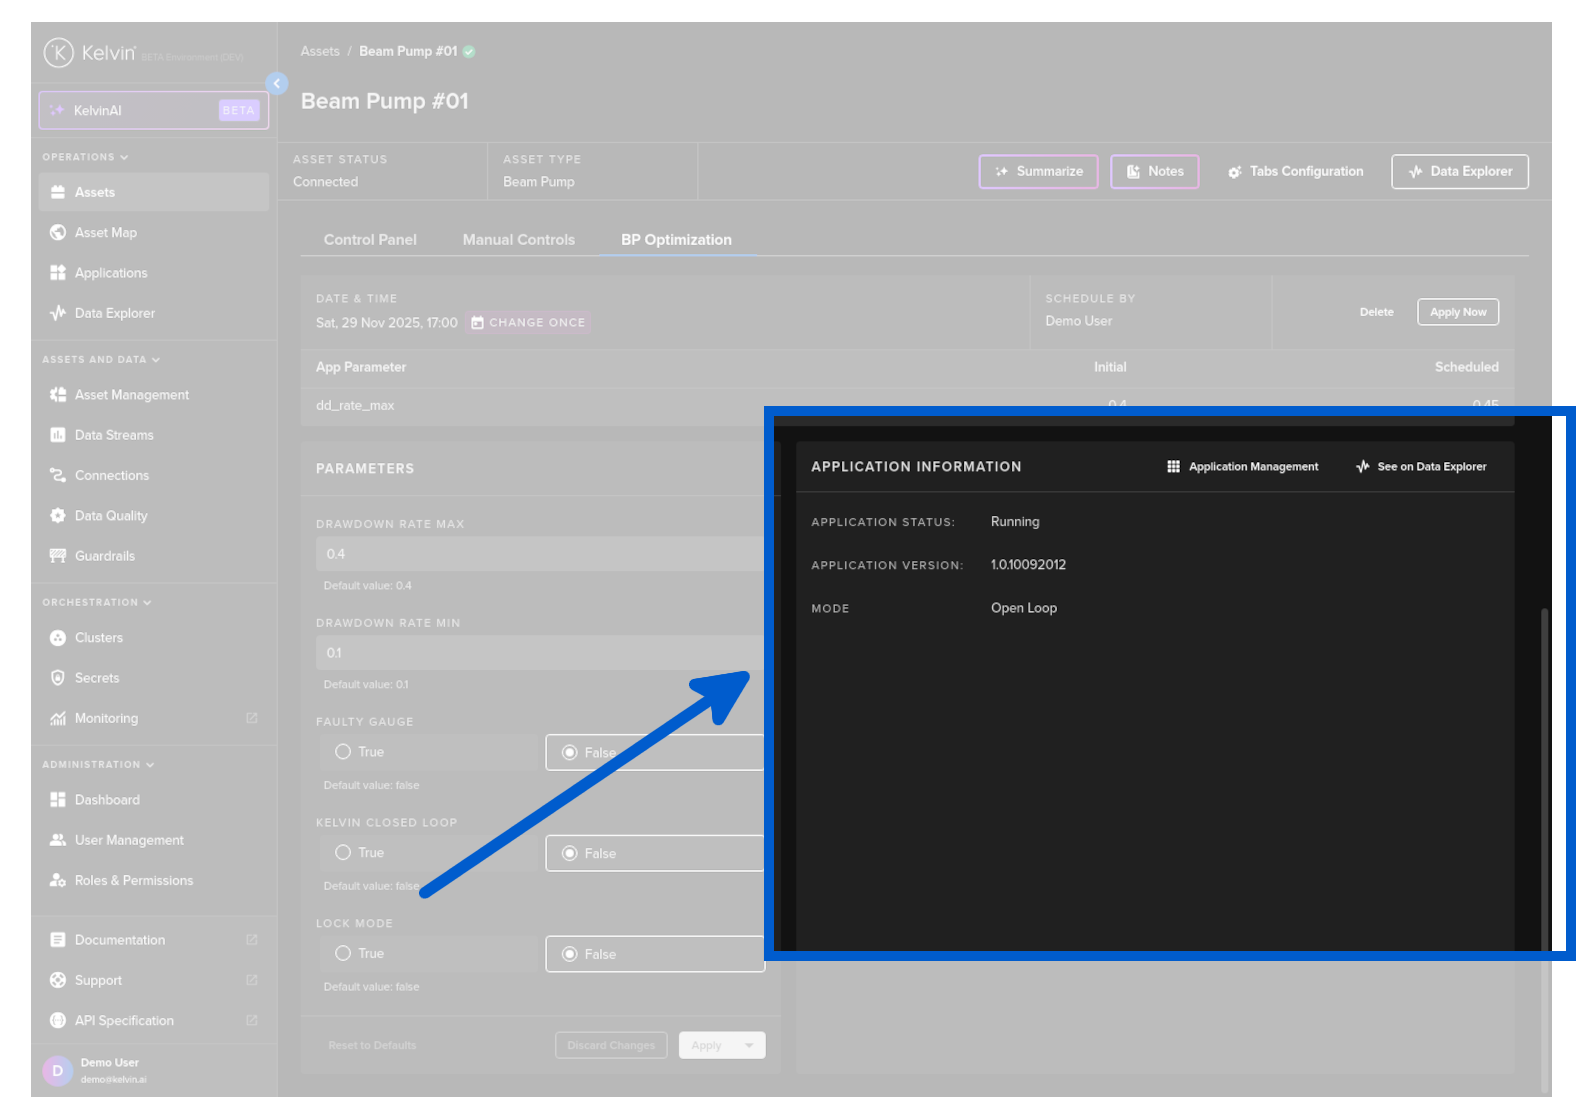
Application Information
This is the general information about Kelvin SmartApps™.
The mode in the information can be either direct or check (there will be options to modify these terms). This defines if Recommendations are automatically accepted (direct) or need to be accepted by the Operations Engineers (check). Direct will see the Control Changes in a Recommendation automatically initiated, relieving the Operations Engineers of the task to focus on the problematic assets which remain in check.
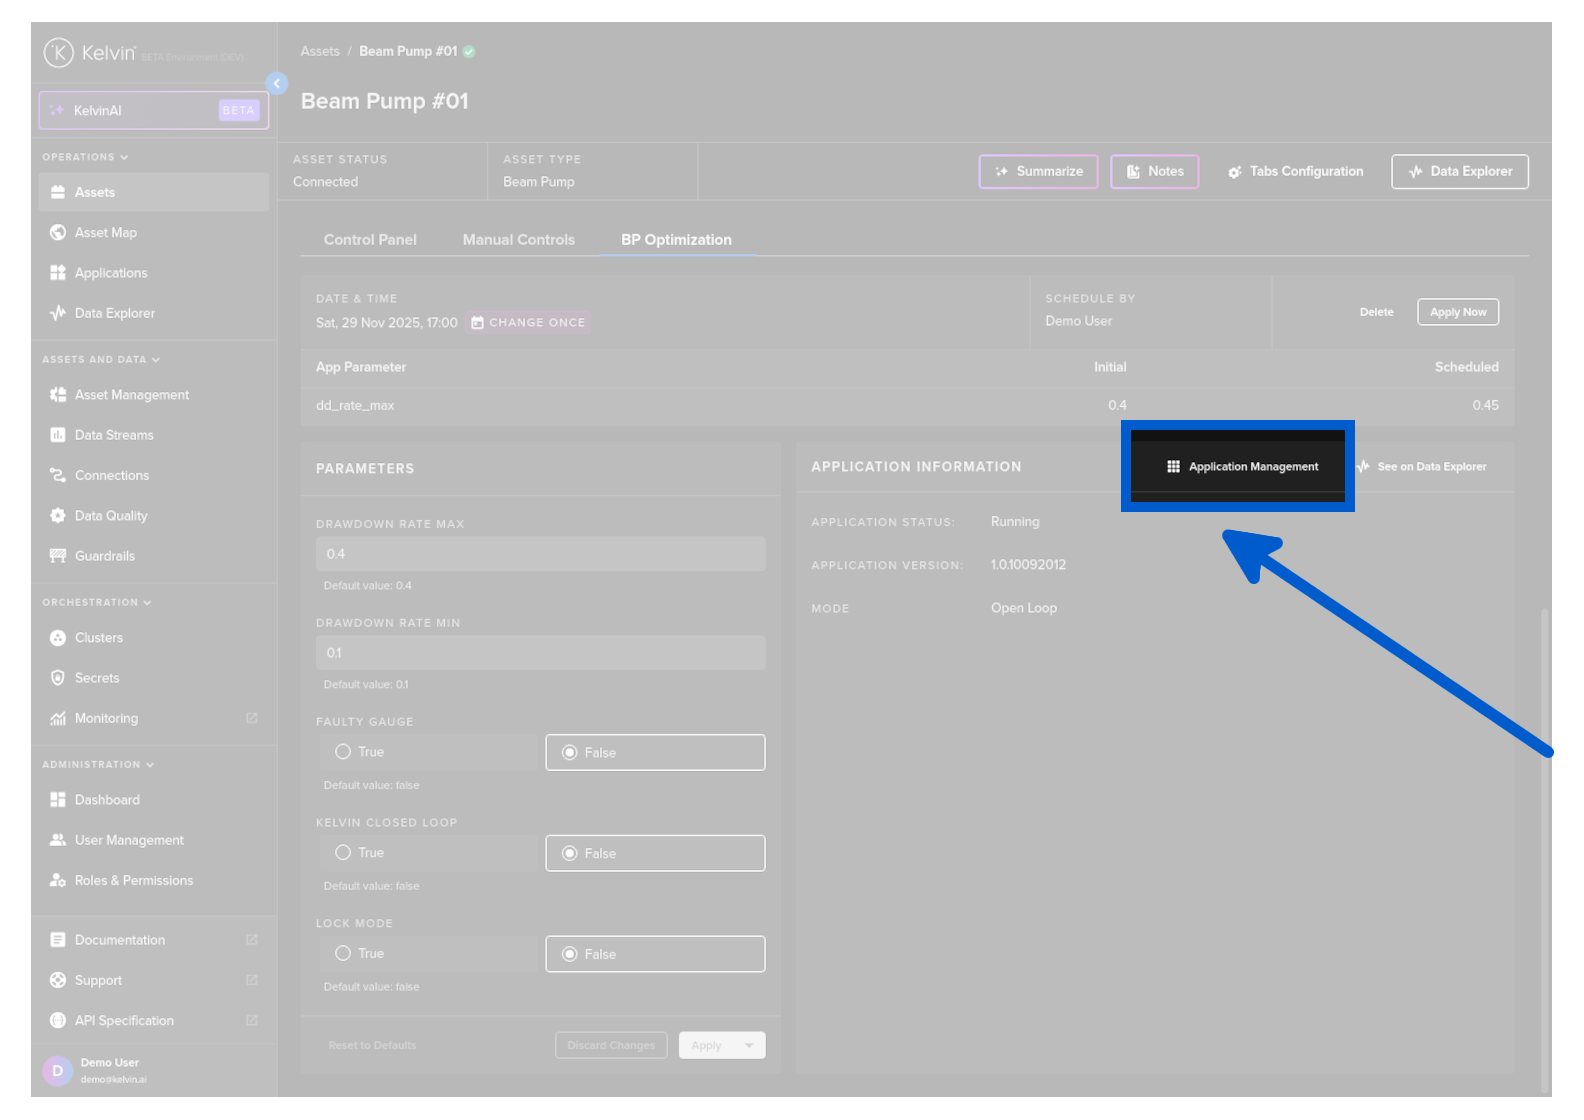
Application Management
This link will take you to the Kelvin SmartApp™ overview page.
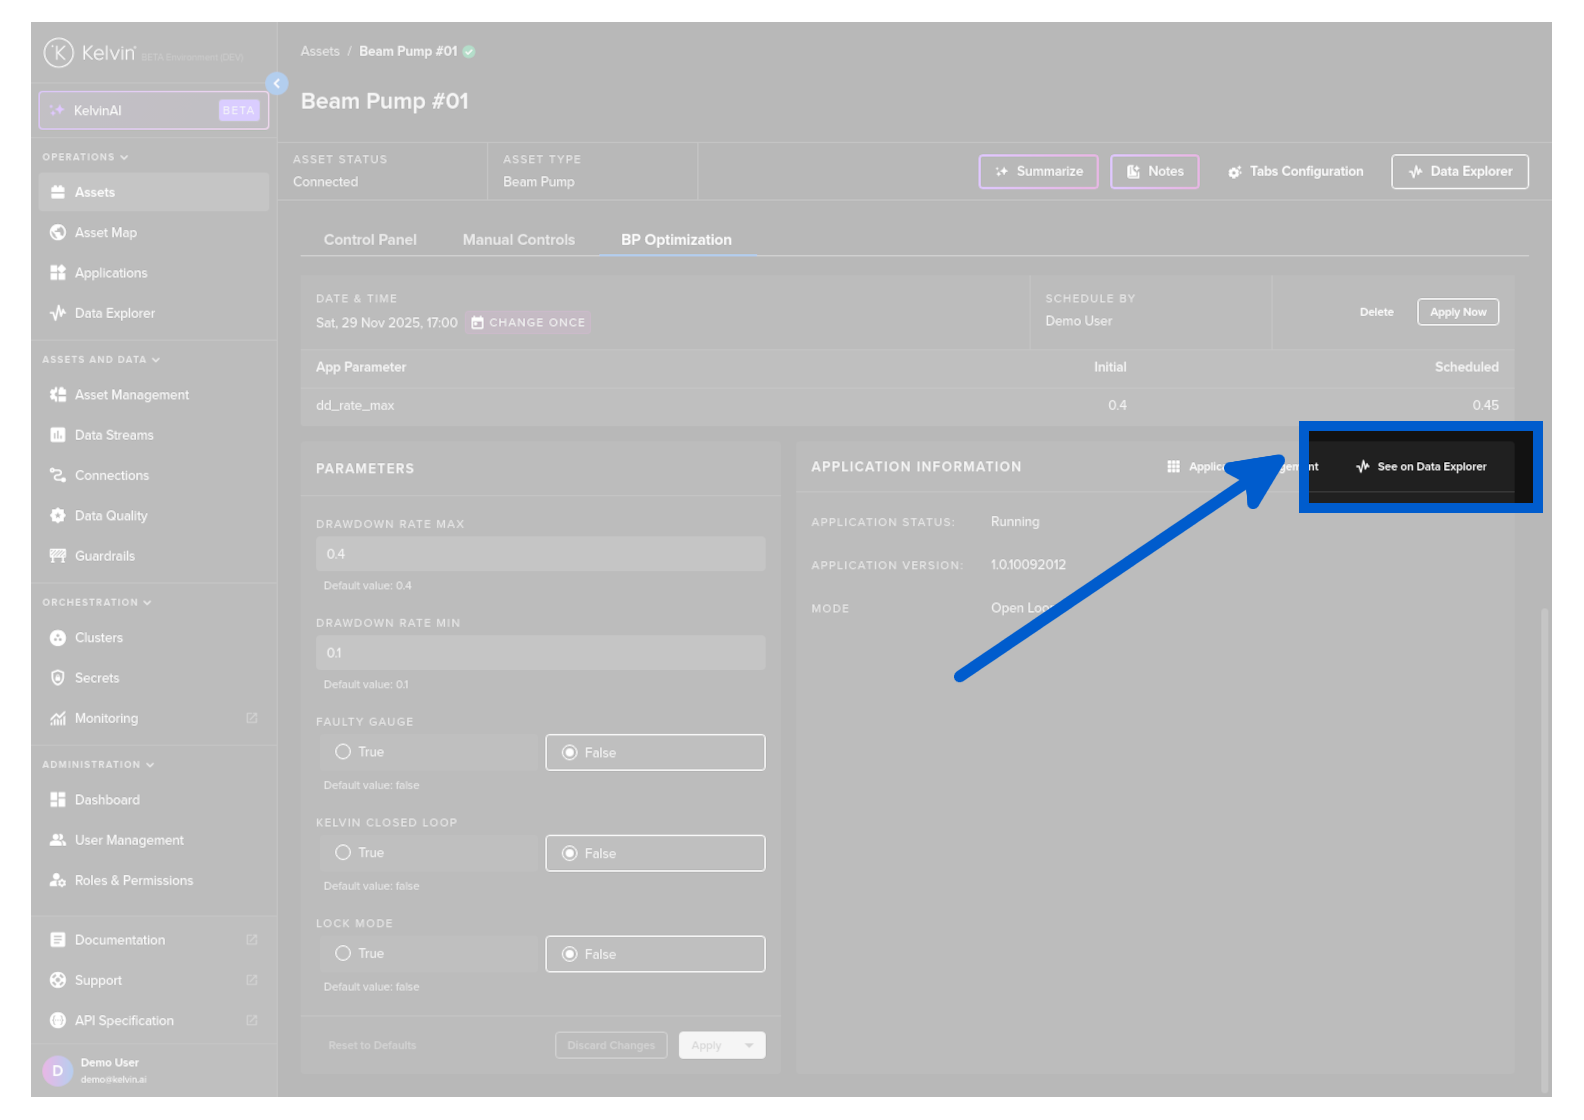
See on Data Explorer
This link will take you to the Data Explorer and pre-populate the current Asset in the first slot.
Do not confuse this with the Data Explorer button at the top right hand corner of the screen which is related to the Asset only and not to specific Kelvin SmartApps™.
In Data Explorer you can see the historical graphical data about one or more Assets and all the Data Streams associated with the asset.
The Data Explorer is tightly integrated with Kelvin features and gives many additional features to the standard graphs including;
- Reference to time when a control change was performed on a Data Stream
- Reference when a Recommendation was activated
- Easily change timezone to see what time events happened according to your location
- Filter which Assets and Data Streams to view - even data that is not related to this Asset.
- Select the Y axis to be either all Data Streams on one axis value range, one axis value range per Data Stream or one axis value range per type (e.g. for temperature, vibrations, etc)
- Independent Y-Axis Zoom controls when displaying multiple y-axis value ranges.
- Multi-chart (up to four) to deeper analysis of multiple Assets together.
To learn all the details and features of the Data Explorer, check out the Data Explorer documentation page in Operations Tools.