Control Changes in Data Explorer
On this page you will go through understanding the Control Change activity lane in the Data Explorer.
Overview
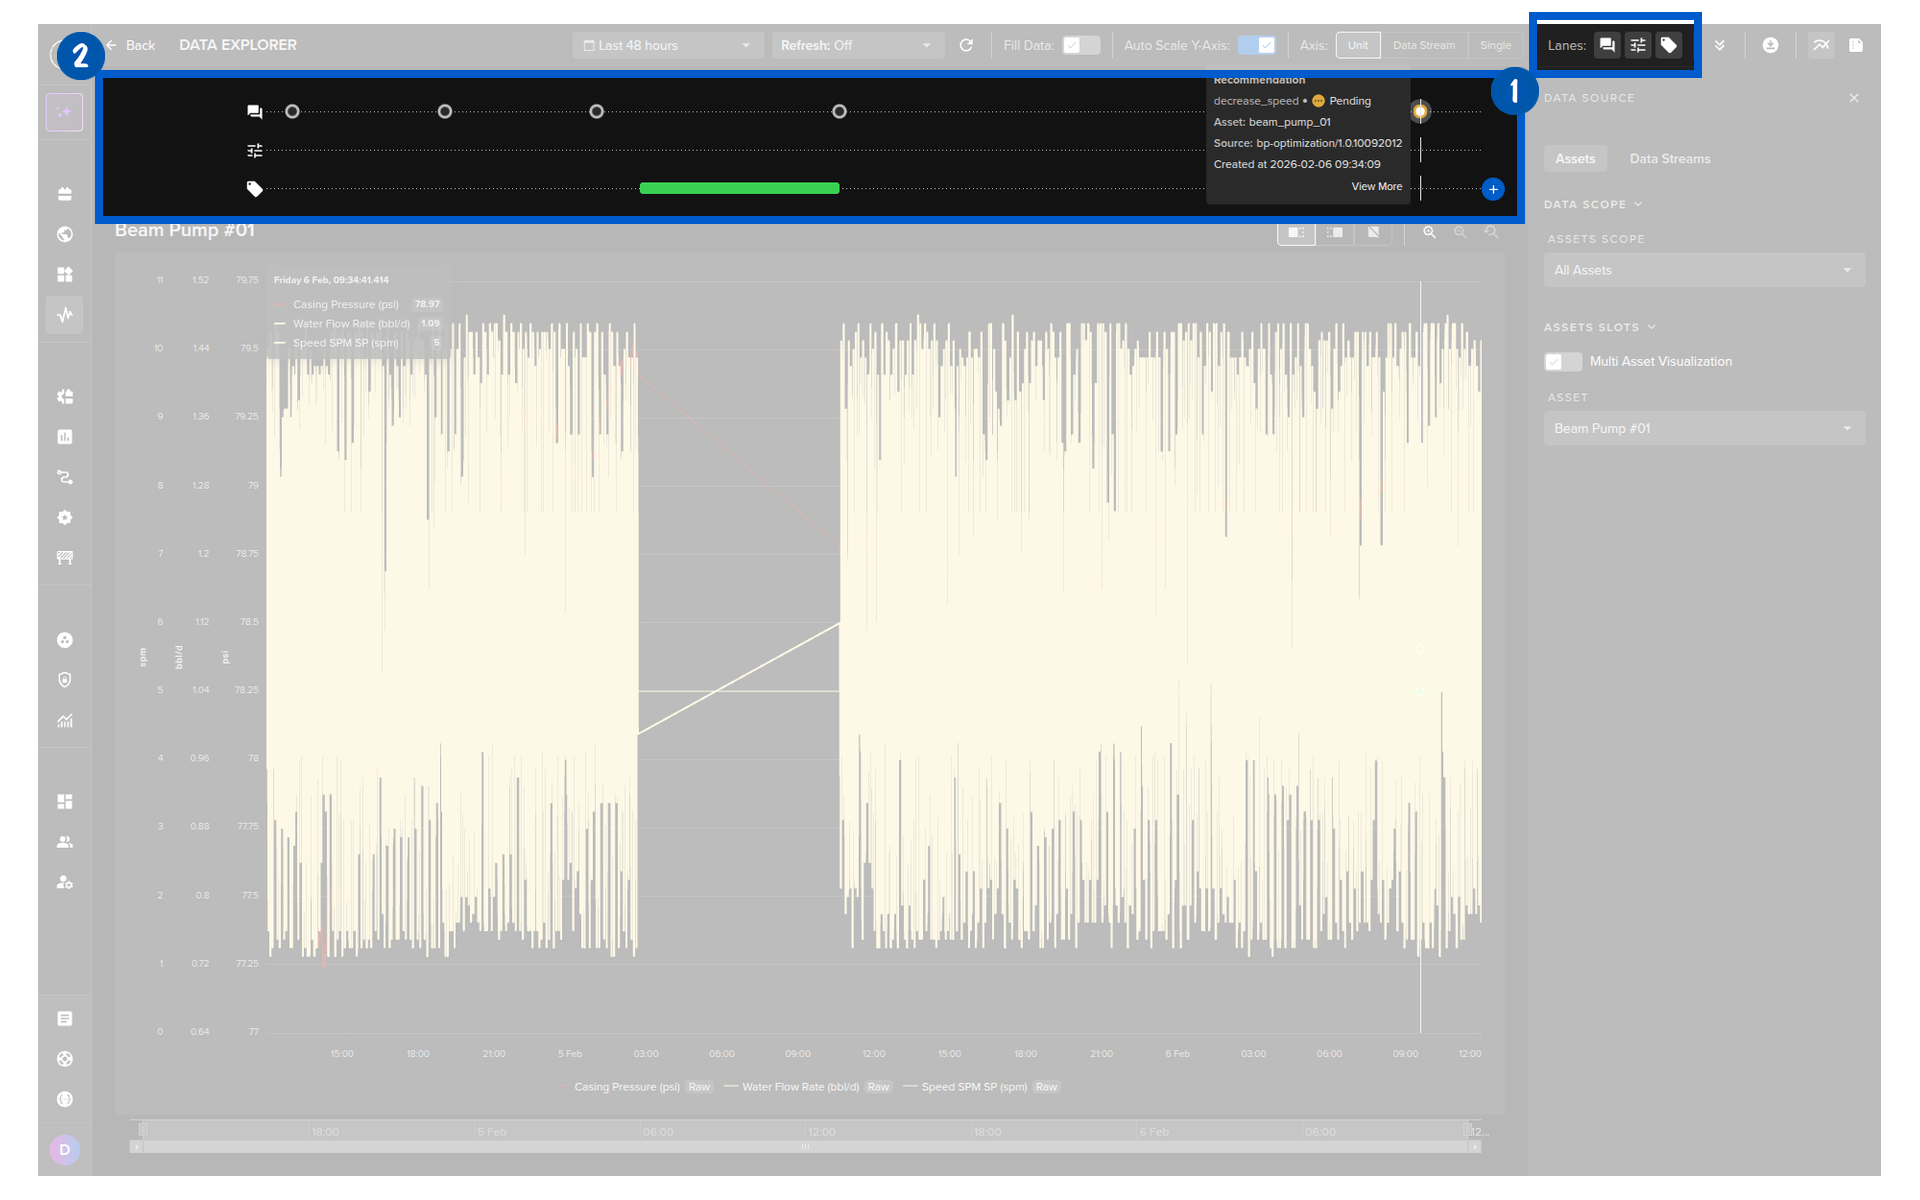
Control Changes can be initiated through manual control updates or through Recommendations.
Every Control Change performed is shown in the activity lane in the Data Explorer. This allows you to quickly and visually see the effects of individual Control Changes on your Data Streams.
| Icon | Meaning |
|---|---|
| Control Change applied successfully to the Asset | |
| Control Change currently being sent to Asset | |
| Control Change failed to write to Asset for one of the reasons; Timed Out trying or a Guardrail rule was breached. Reason for failure will be annotated and saved with the Control Change object | |
| Multiple Control Changes in this timeframe, click icon to see more details of individual Control Changes |
If the X-axis scale is too small to show individual control change times, then they will be grouped together and the icon will be a white circle with a number above indicating how many control changes are registered at that point in time.
Click on the white circle and the graph will automatically zoom to that location in time and show the individual control changes like below.
Info Popup
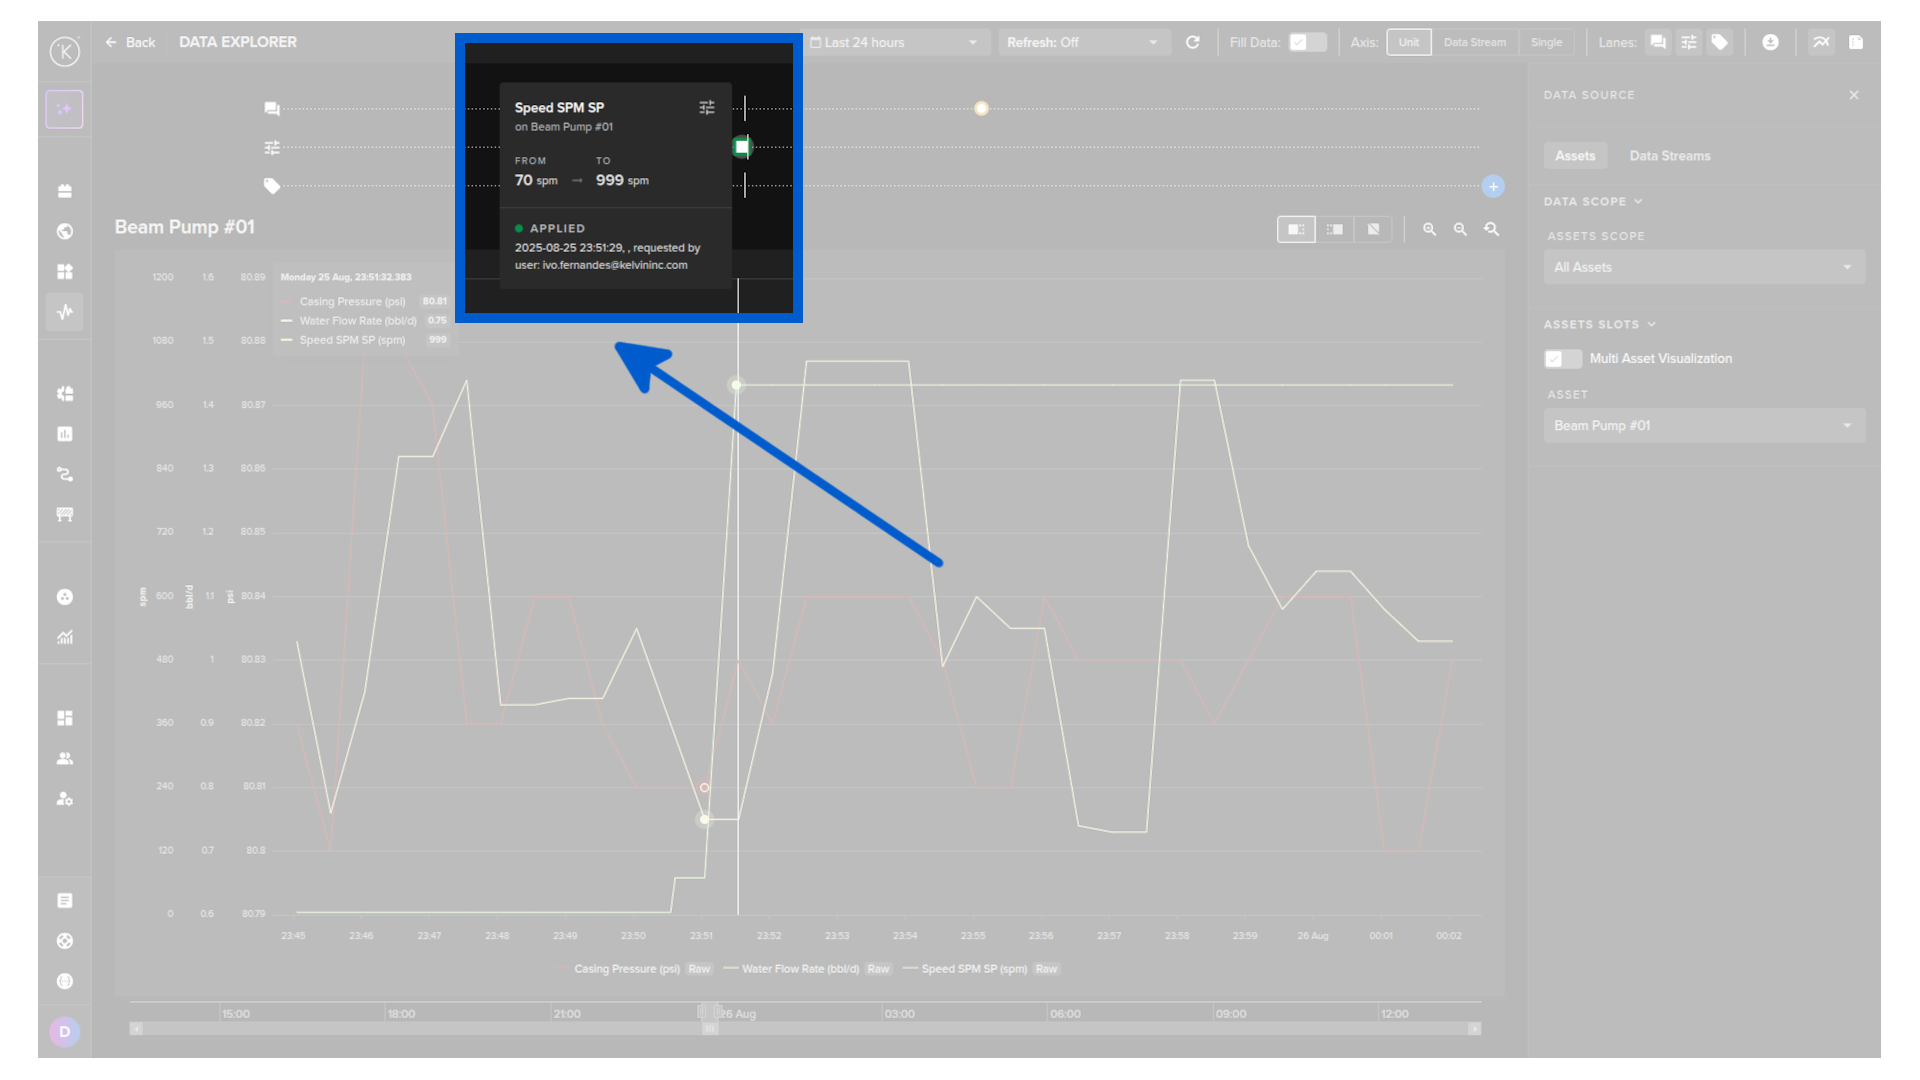
If you put your mouse over any Control Change point in the time frame, a popup will display detailed information about that control change.
Note
The reason for any Control Change failures will also appear here.
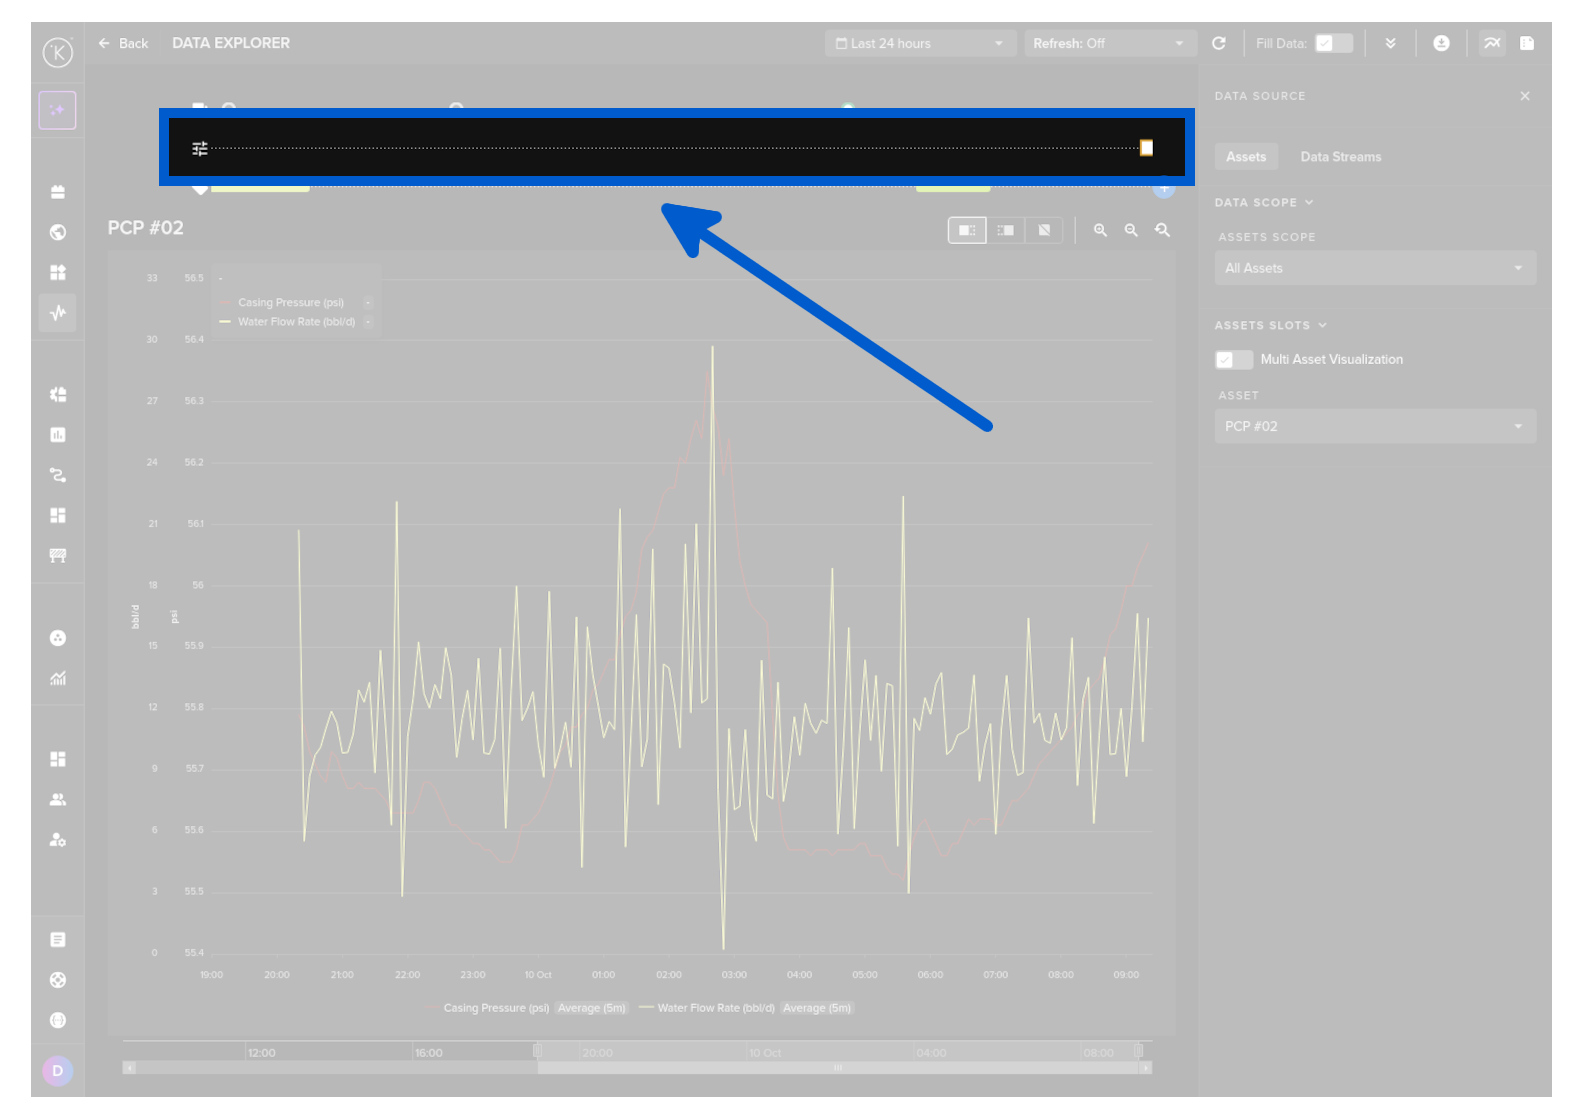
Hide Activity Lane
Control Change activity lanes can be turned on or off from the visualization settings in the right hand sidebar.