Compare Data Streams
On this page you will learn how to quickly analyze multiple Asset Data Streams in Data Explorer from Kelvin SmartApps™ section of Kelvin UI.
When running Kelvin SmartApps™ with many Assets, a very useful tool in Kelvin is the ability to compare the Data Streams of multiple Assets.
This feature allows Operations Engineers to analyze similar assets and quickly identify problems and solutions with low performance assets.
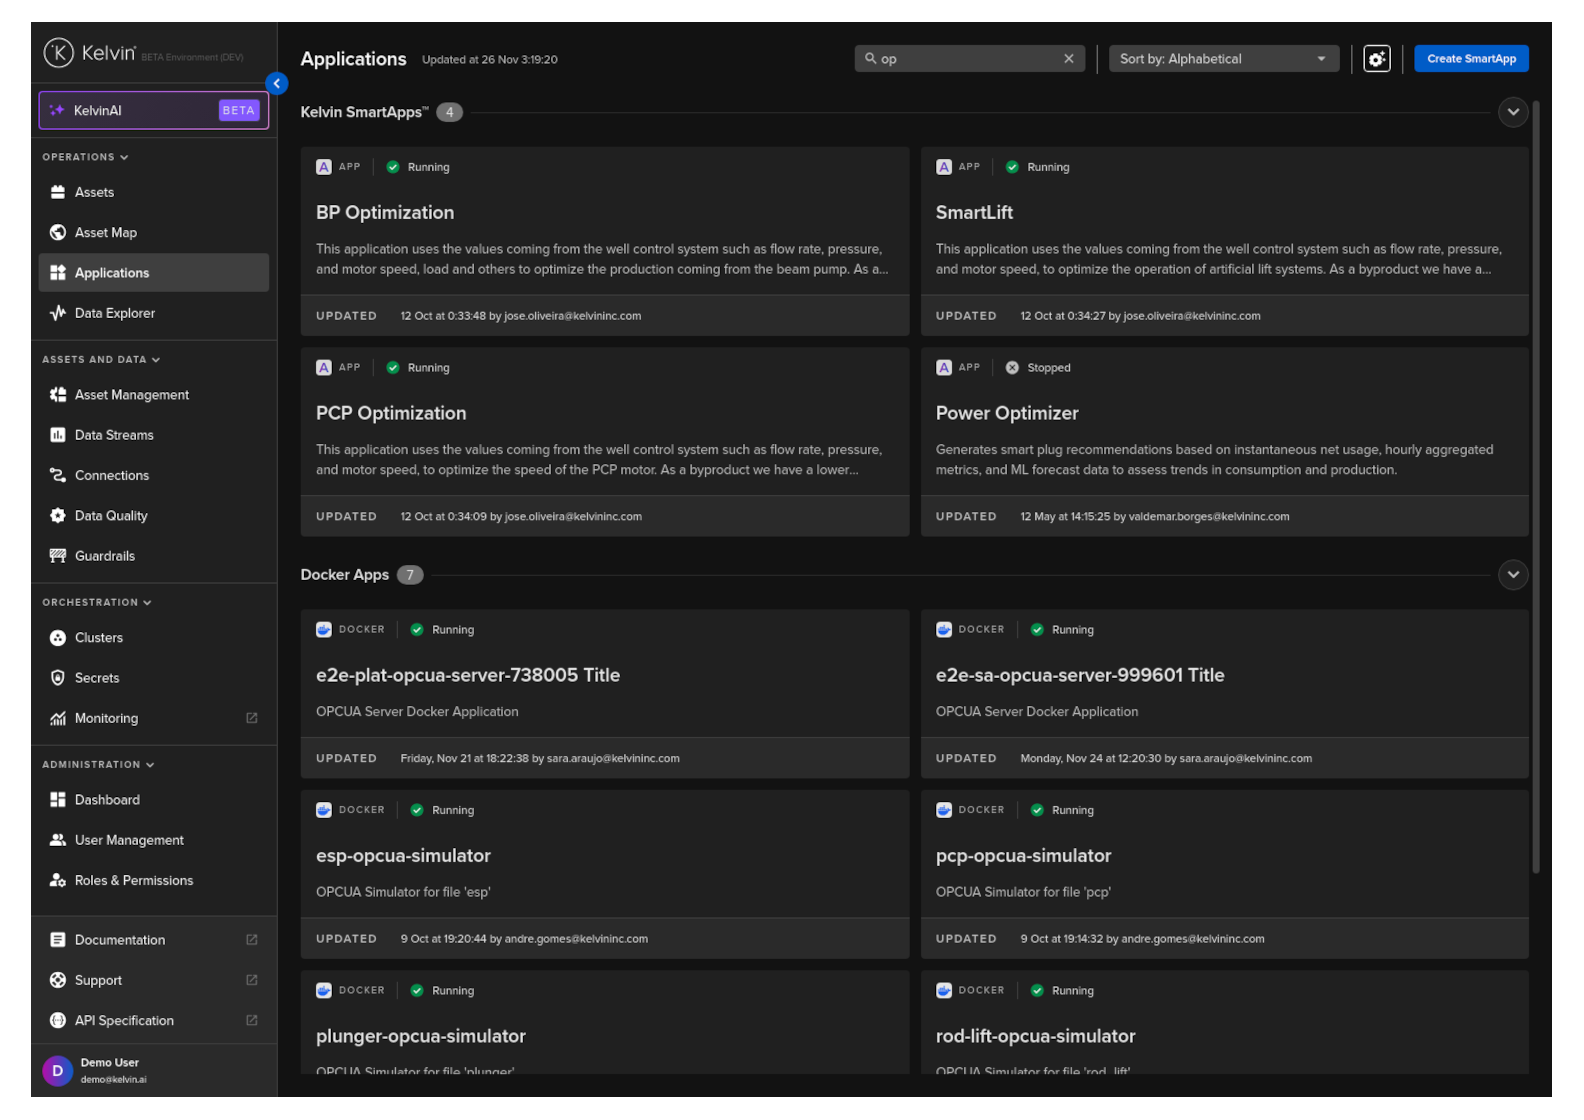
To compare the Data Streams of up to four Assets together with one action go to SmartApps™ and select Kelvin SmartApps™ of interest.
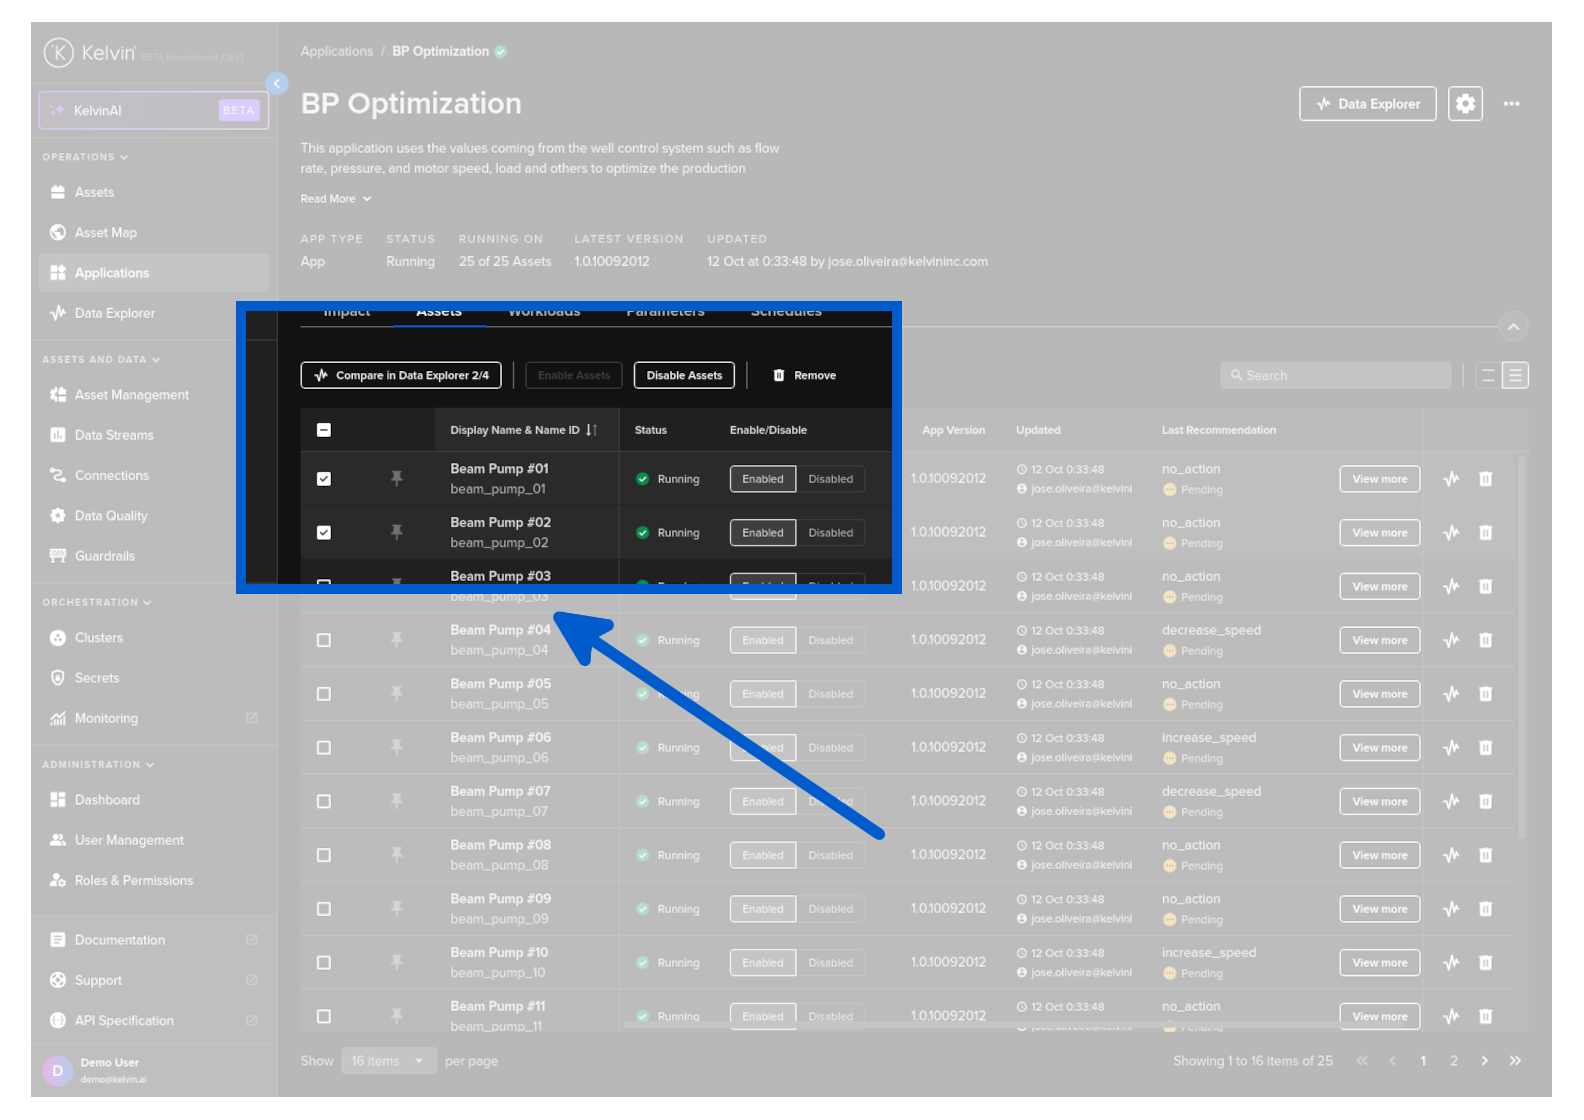
Then in the Assets tab select up to four Assets you would like to compare. You will see a new button appear at the top named Compare in Data Explorer.
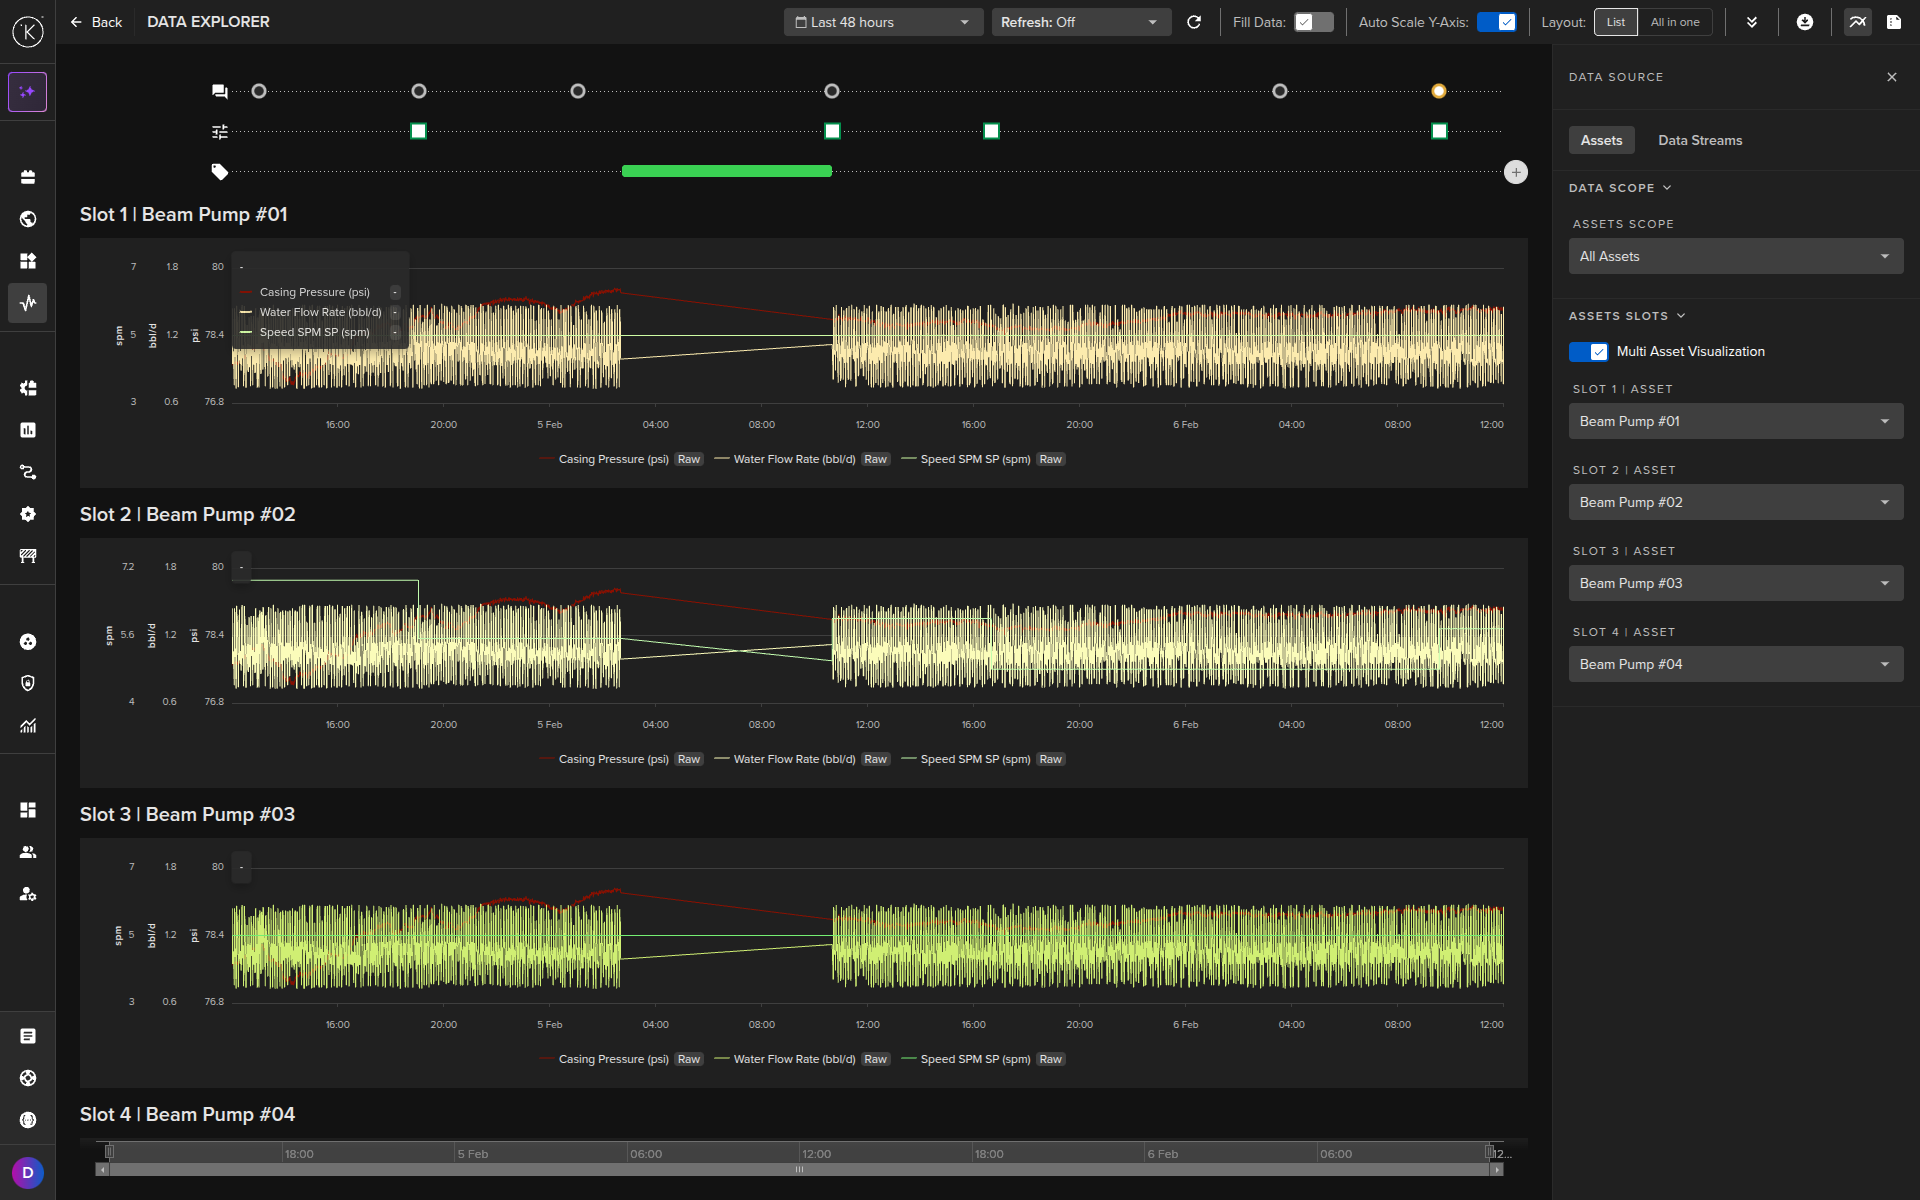
This will then open up Data Explorer and the graphs will be prepopulated with the Assets into a multi-asset graph. From here you can perform your analytics on the performance of your assets.
If this is the first time you are looking at your Assets in the Data Explorer, then you will need to go to the Data Source ⟶ Data Streams section on the right hand sidebar and select some Data Streams to show in the graphs. These settings are saved and remembered each time you come back to the Data Explorer.