View Recommendations
Recommendations are generated from Kelvin SmartApp™ or from third party sources using the Kelvin API endpoint and will either be automatically accepted and implemented or wait for the Operations Engineers decision on the actions to take.
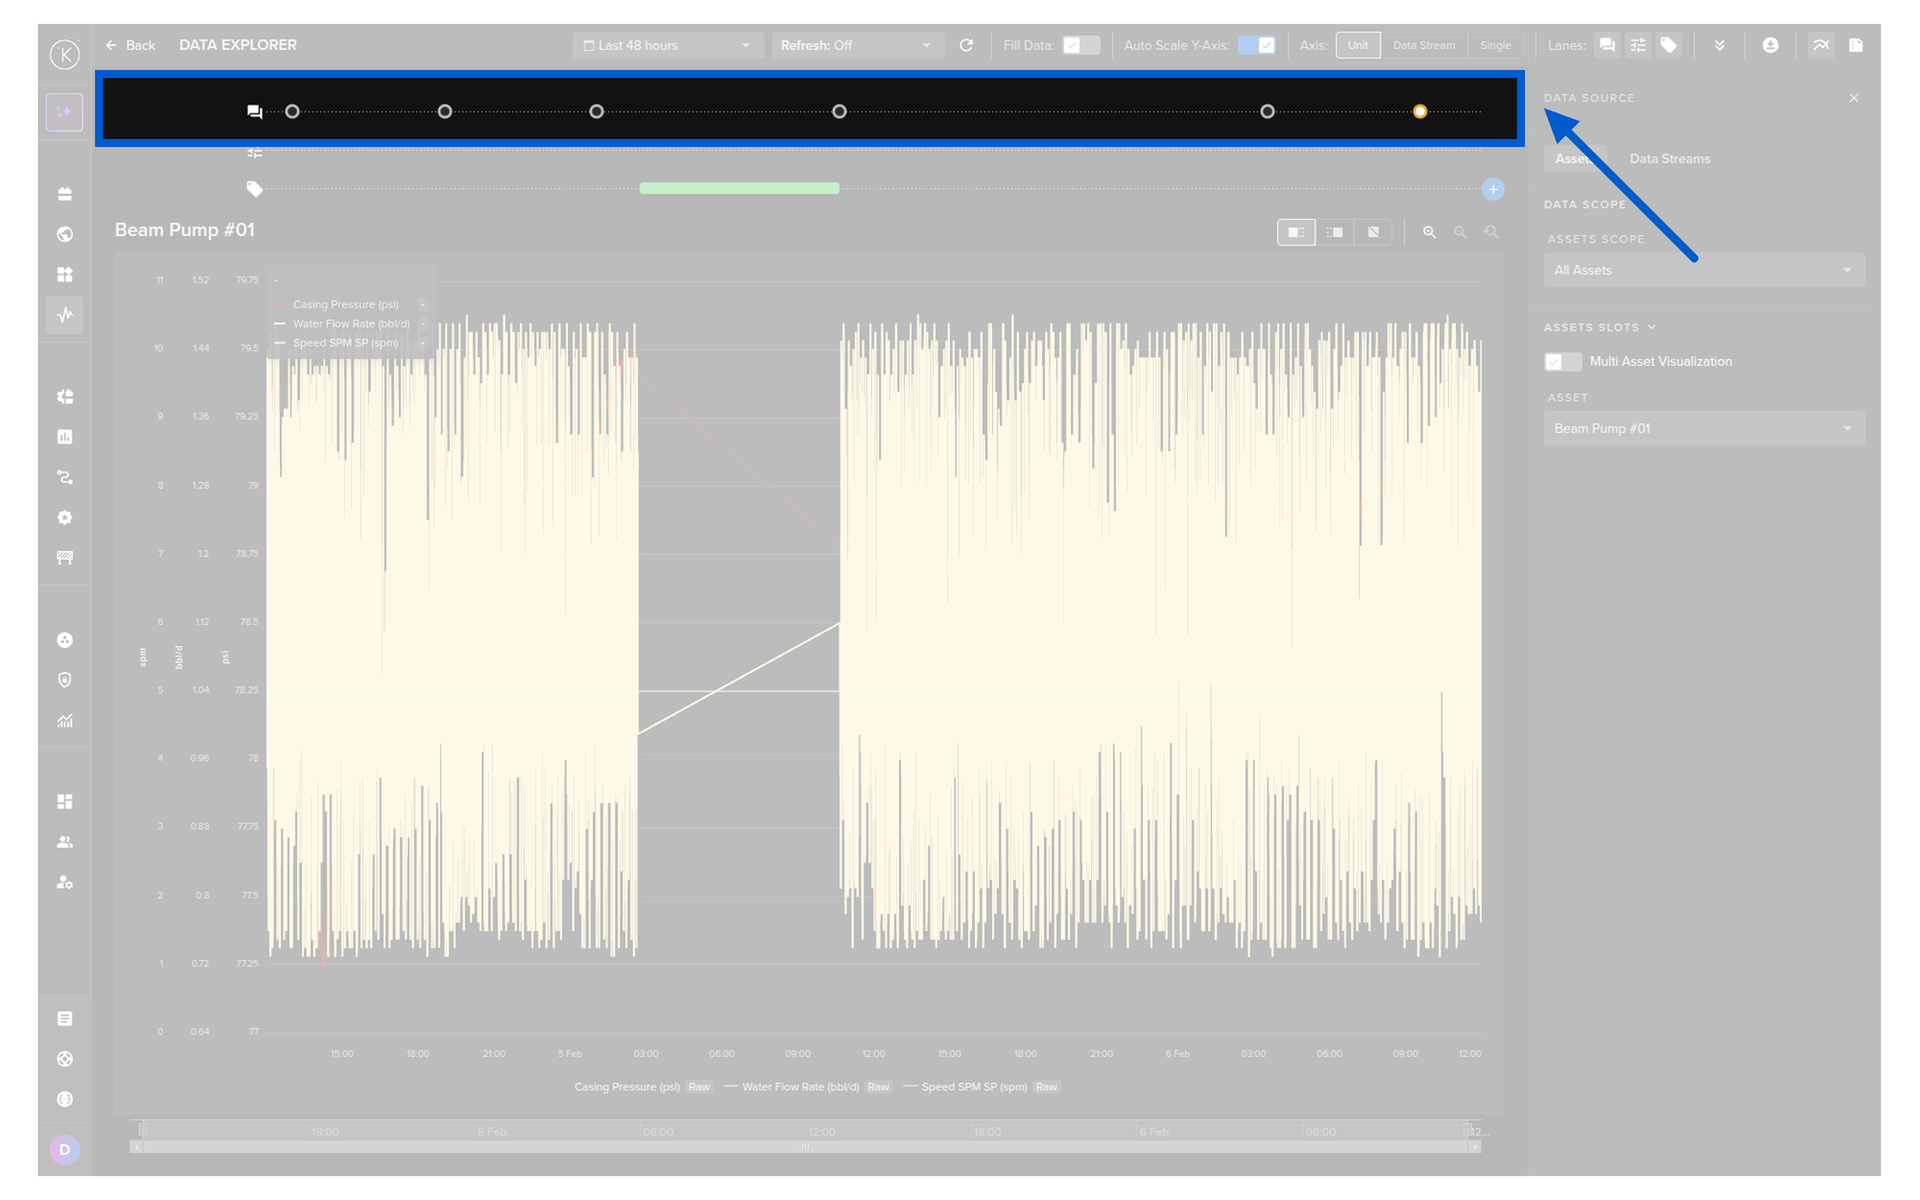
Recommendations can be accessed and controlled from many locations.
You can see how to view Recommendations from the different areas of the Kelvin UI
Data Explorer Lane
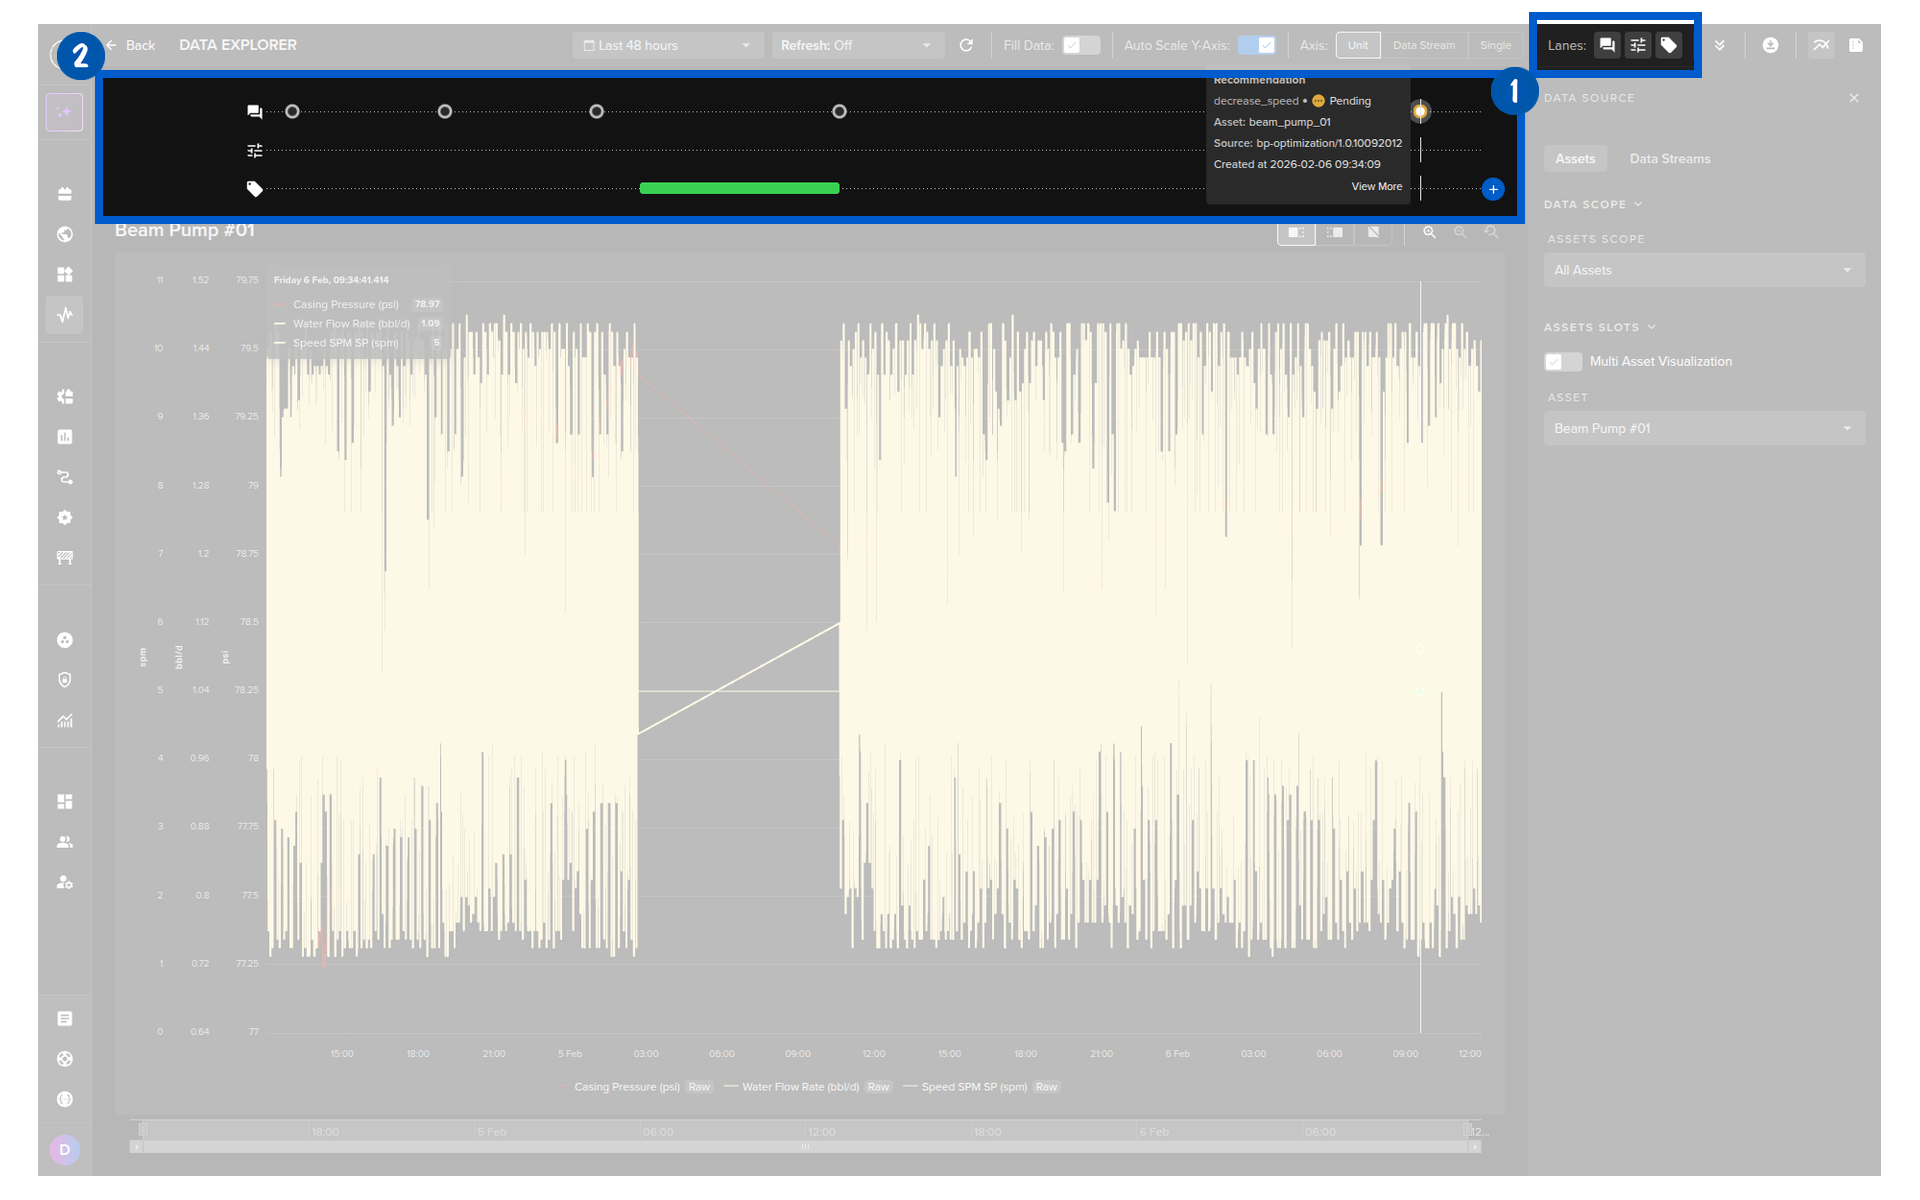
Every Recommendation performed is shown in the activity lane in the Data Explorer. This allows you to quickly and visually see the effects of individual Recommendation on your Data Streams.
| Icon | Meaning |
|---|---|
| Recommendation Accepted | |
| Recommendation Waiting for User Action | |
| Recommendation Rejected | |
| Recommendation Expired (The Operations did not accept or reject the Recommendation within the allotted timeframe) | |
| Multiple Recommendations in this timeframe, click icon to see more details of individual Recommendations |
If the X-axis scale is too small to show individual Recommendation times, then they will be grouped together and the icon will be a white circle with a number above indicating how many Recommendations are registered at that point in time.
Click on the white circle and the graph will automatically zoom to that location in time and show the individual Recommendations like below.
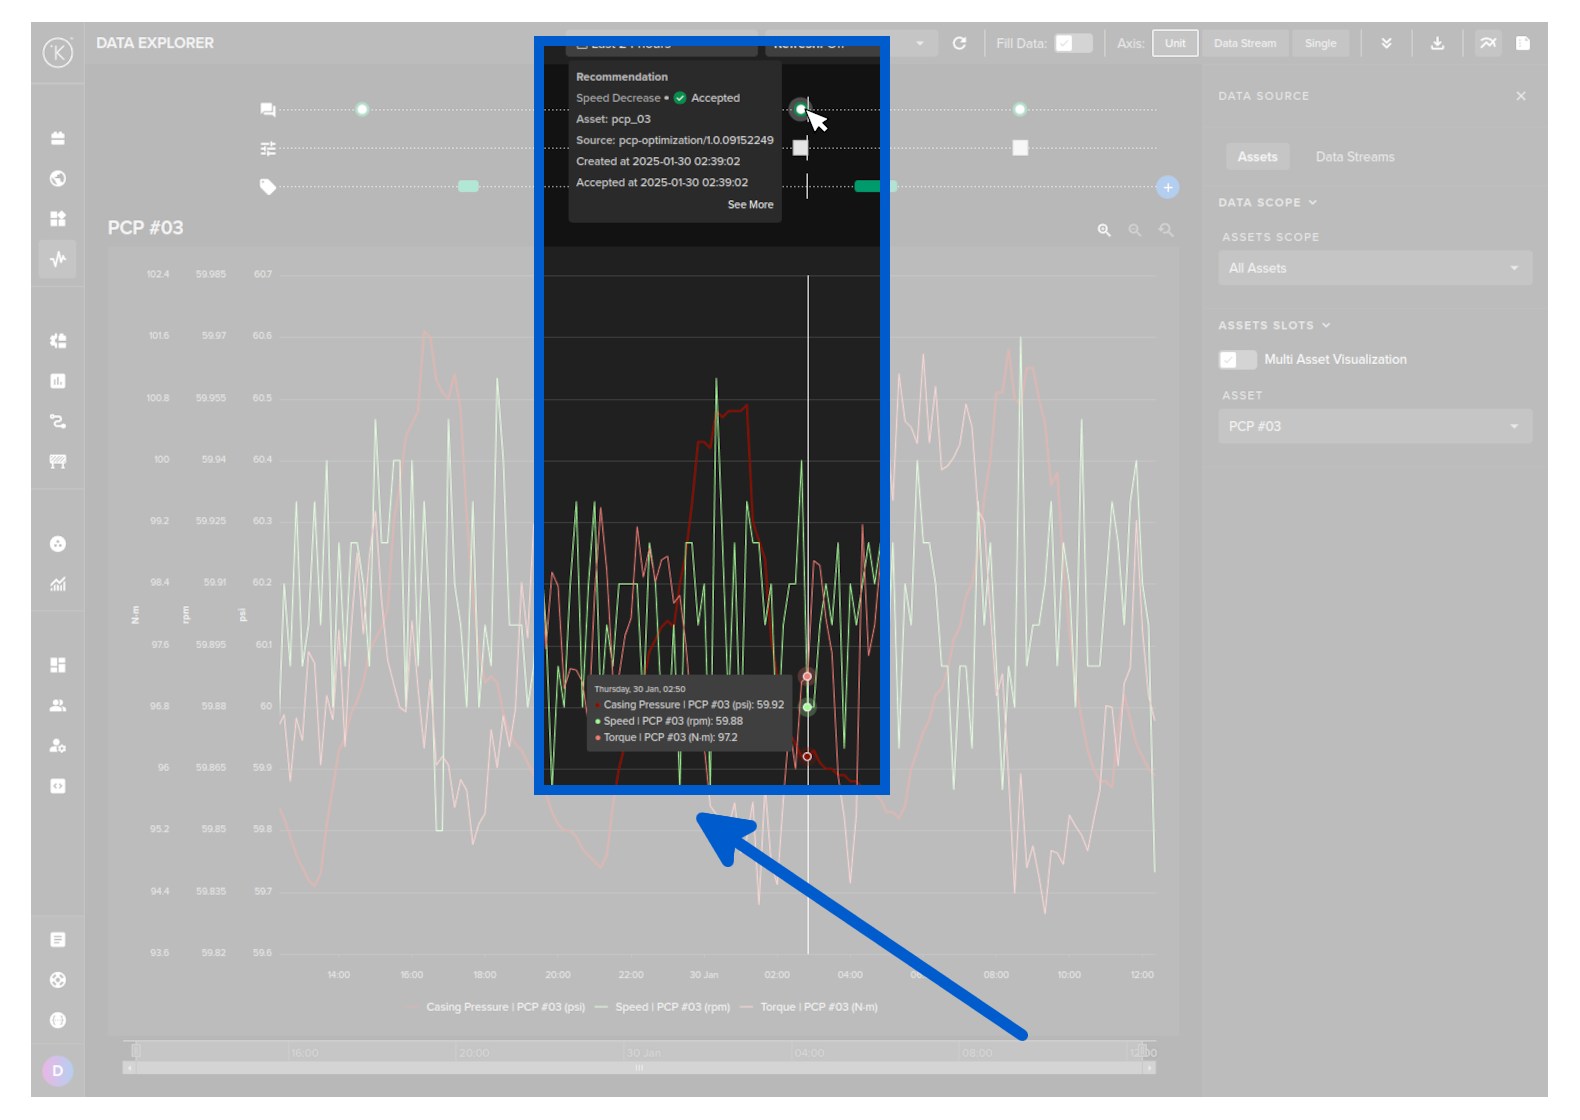
Info Popup
If you put your mouse over any Recommendation point in the time frame, a popup will display detailed information about that Recommendation.
Hide Activity Lane
Recommendation activity lanes can be turned on or off from the visualization settings in the right hand sidebar.