Data Quality Configuration
Note
To understand the concept of Data Quality, you can read a full description in the Concept Overview page here.
To enable Data Quality metrics on any of your Asset / Data Streams, you will need to configure them in the Data Quality Configuration.
This will start the Data Quality metrics which can then be seen in the Dashboard as well as be used in any custom Applications.
There are five built-in metrics for Asset / Data Stream pairs can be enabled;
Note
Developers can also create their own Data Metric Applications.
- Data Availability
- Outlier Detection
- Range Validation
- Duplication Detection
- Timestamp Anomalies.
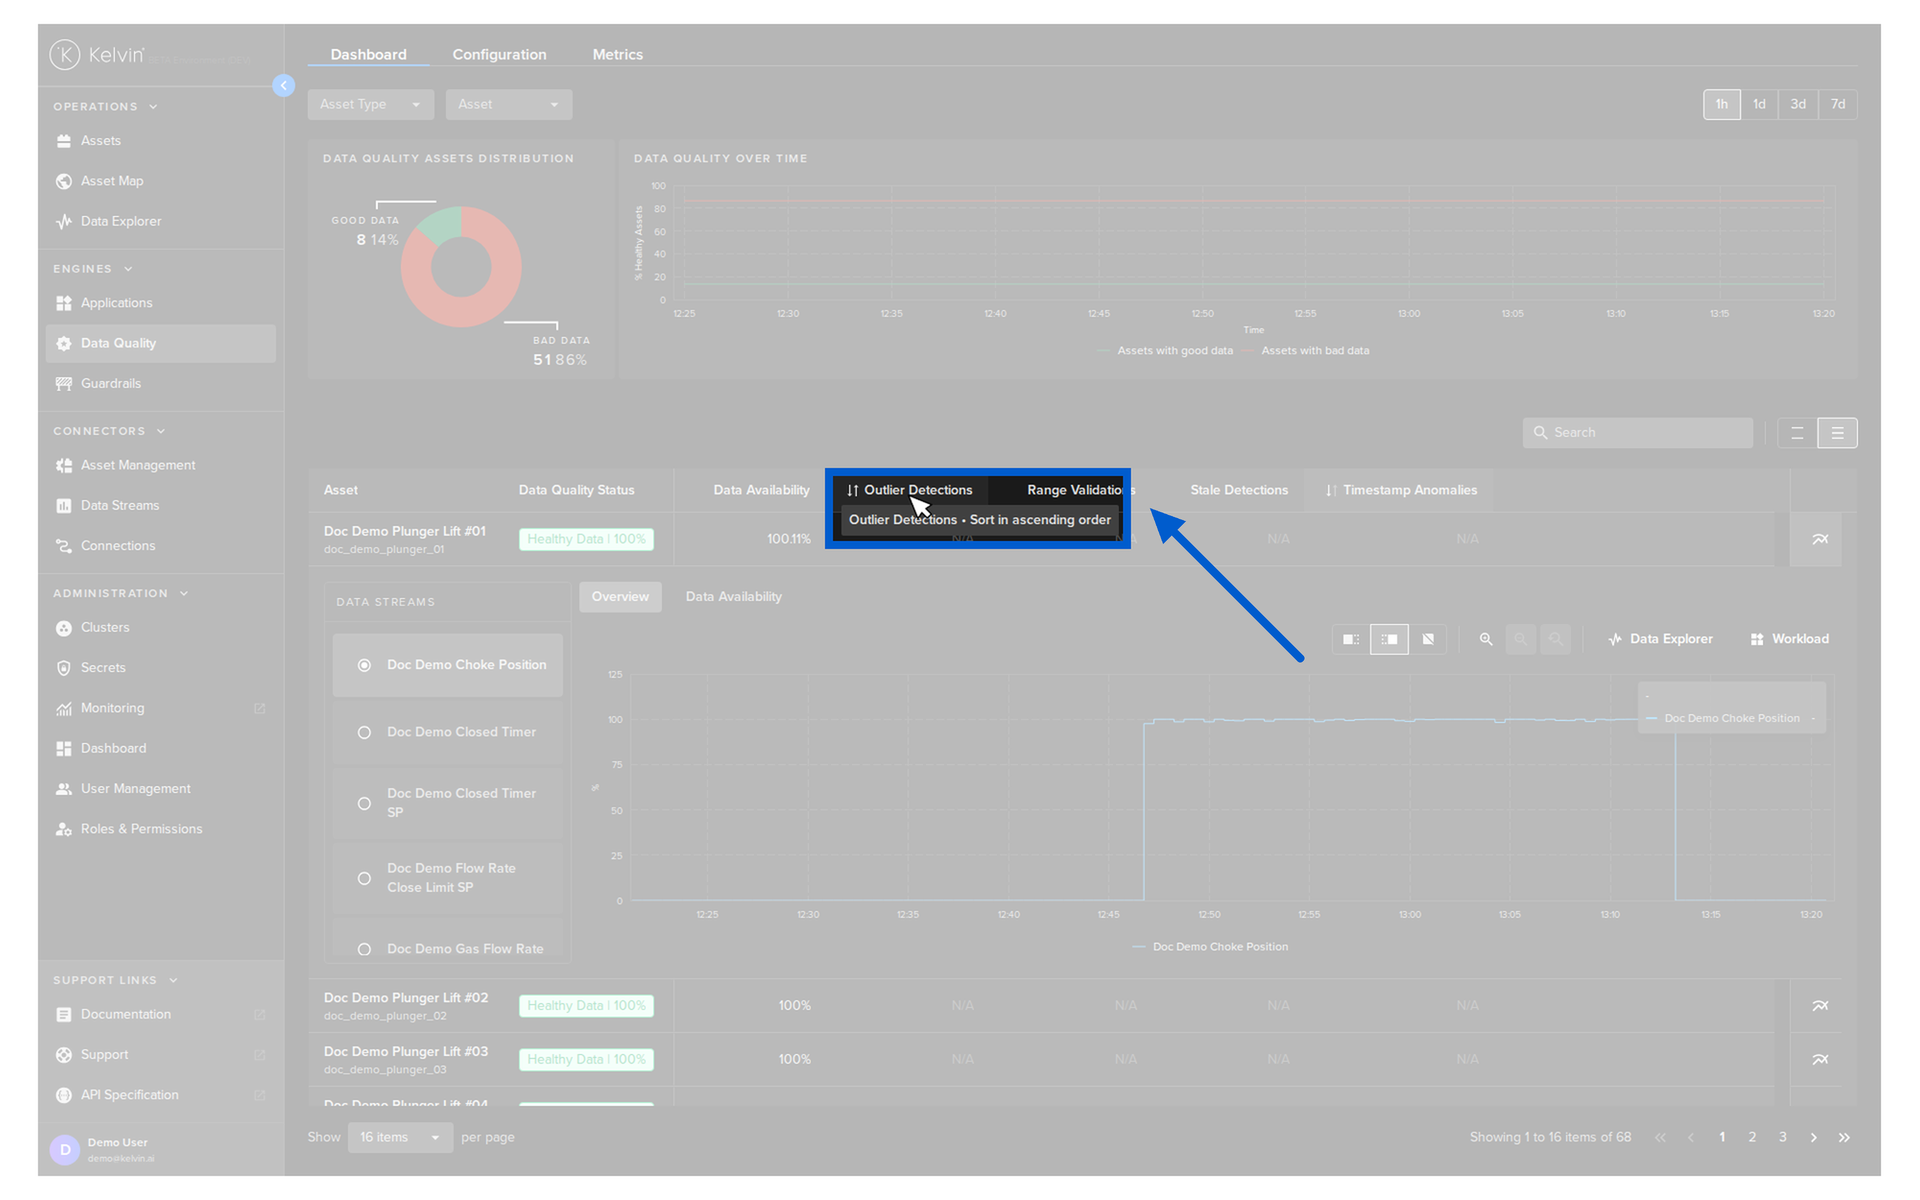
You can also hover your mouse over the metric names in the column headers to get more details on it.
Overview
To go to the configuration overview screen, click on the Data Quality menu and then the Configuration tab.
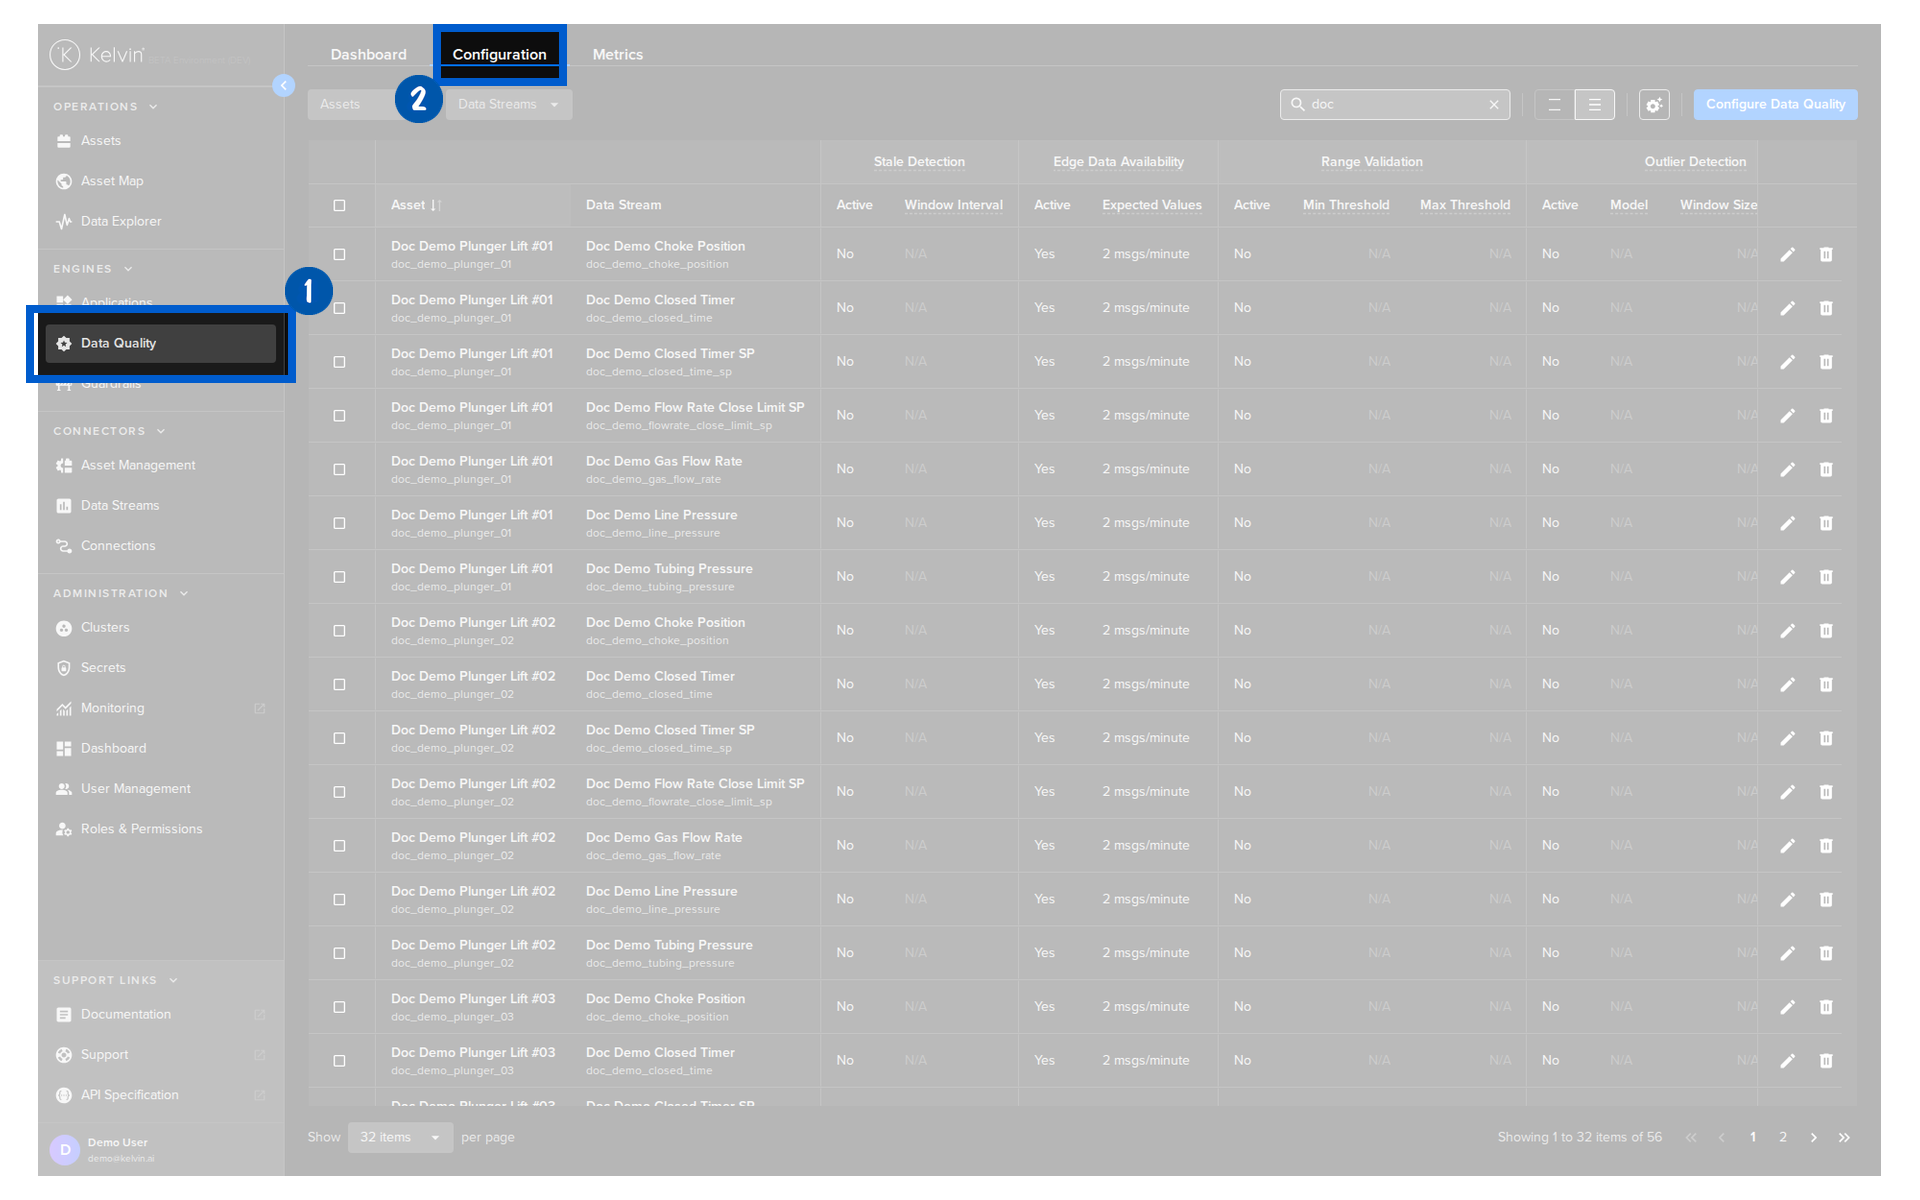
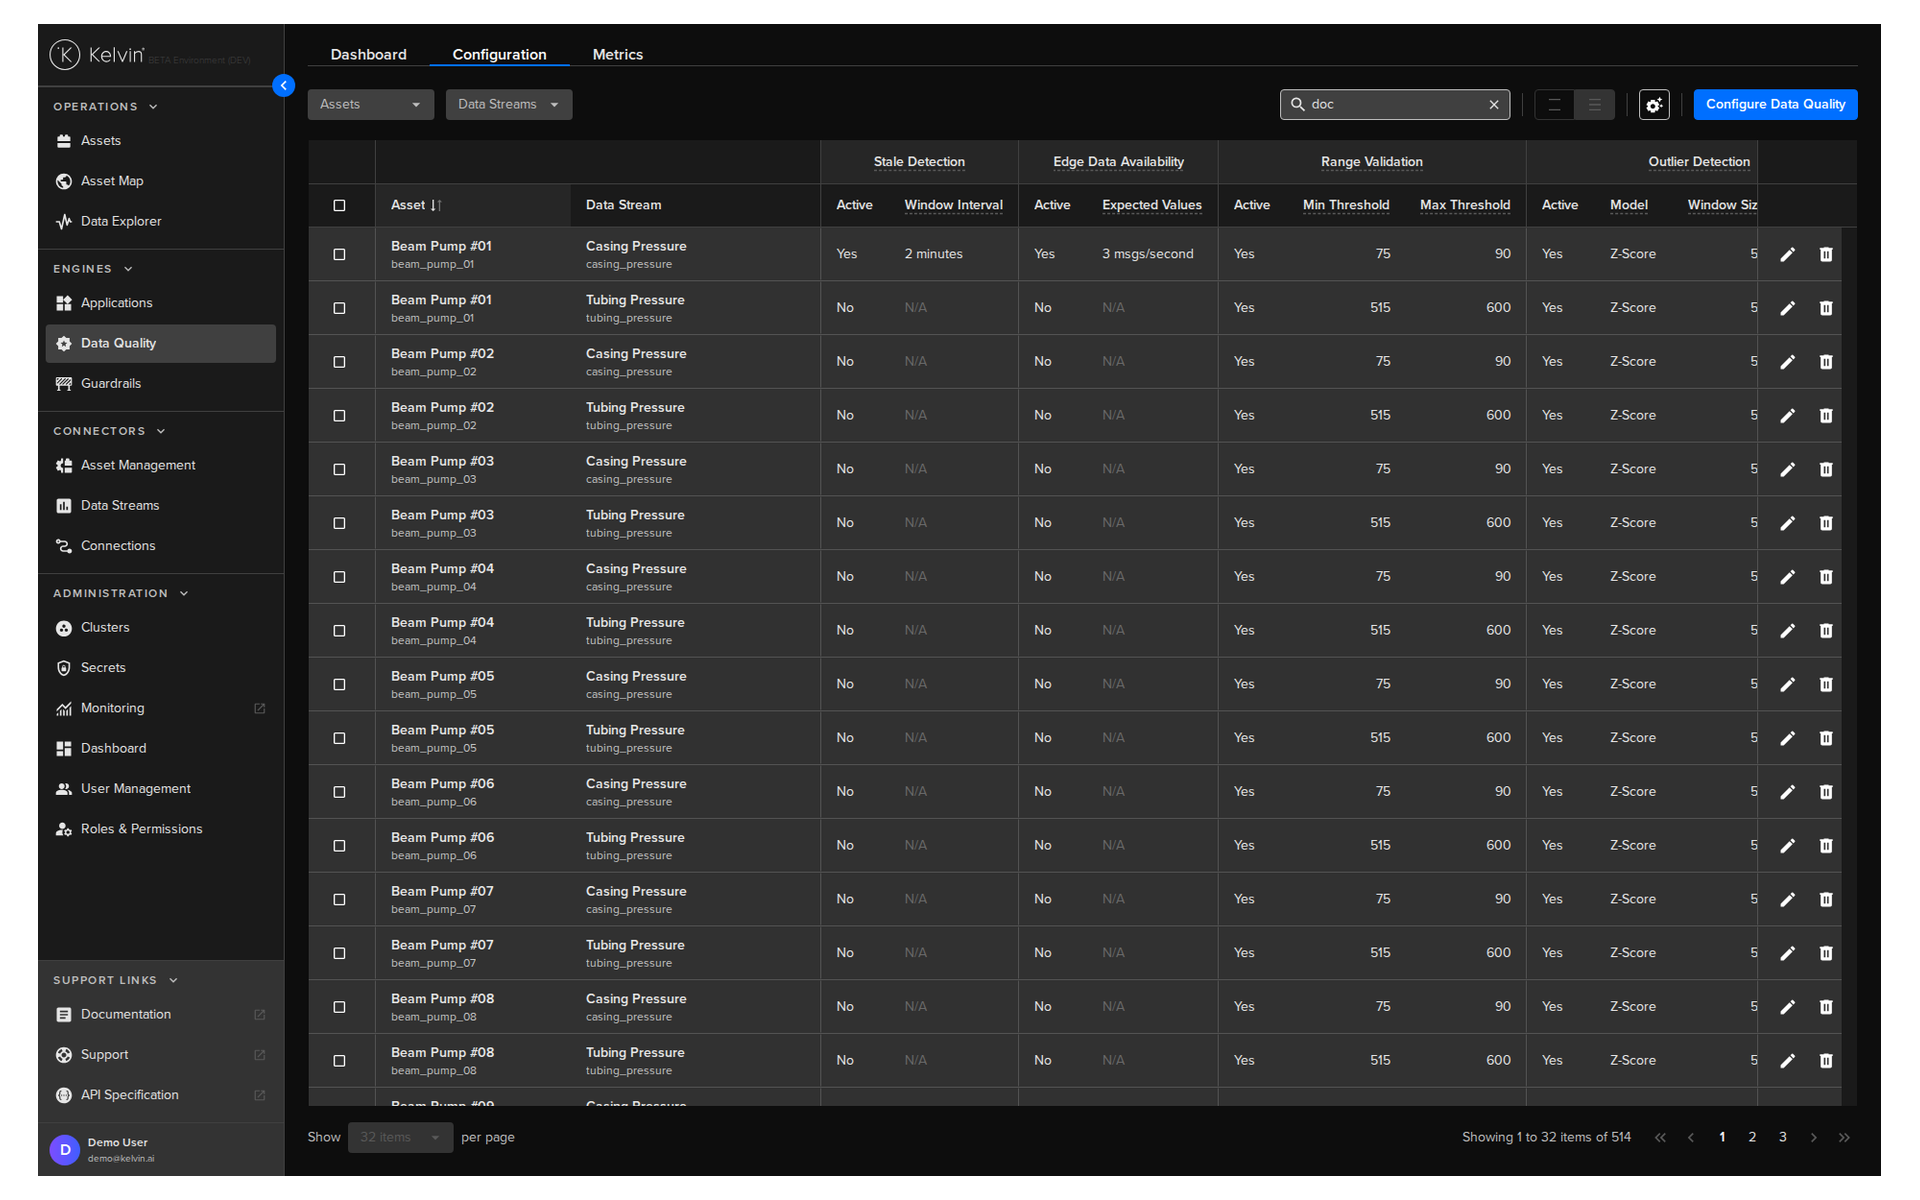
Here you will see the current configurations per Asset that are enabled.
| Column | Description |
|---|---|
| Asset & Data Stream | The Asset / Data Stream pair |
| Active | Whether metric algorithms are done on this Asset / Data Stream pair |
| Other Values | The values available and their settings will depend on the Data Quality metric algorithm |
Basic Features
On the overview page you have a number of common features that help you quickly navigate, find and filter the assets of interest.
Once you have configured and filtered your list, the list as you see it will be utilized as the reference list on the Asset Details page which we discuss in detail in the View Asset Details page, allowing for easier navigation and scrolling.
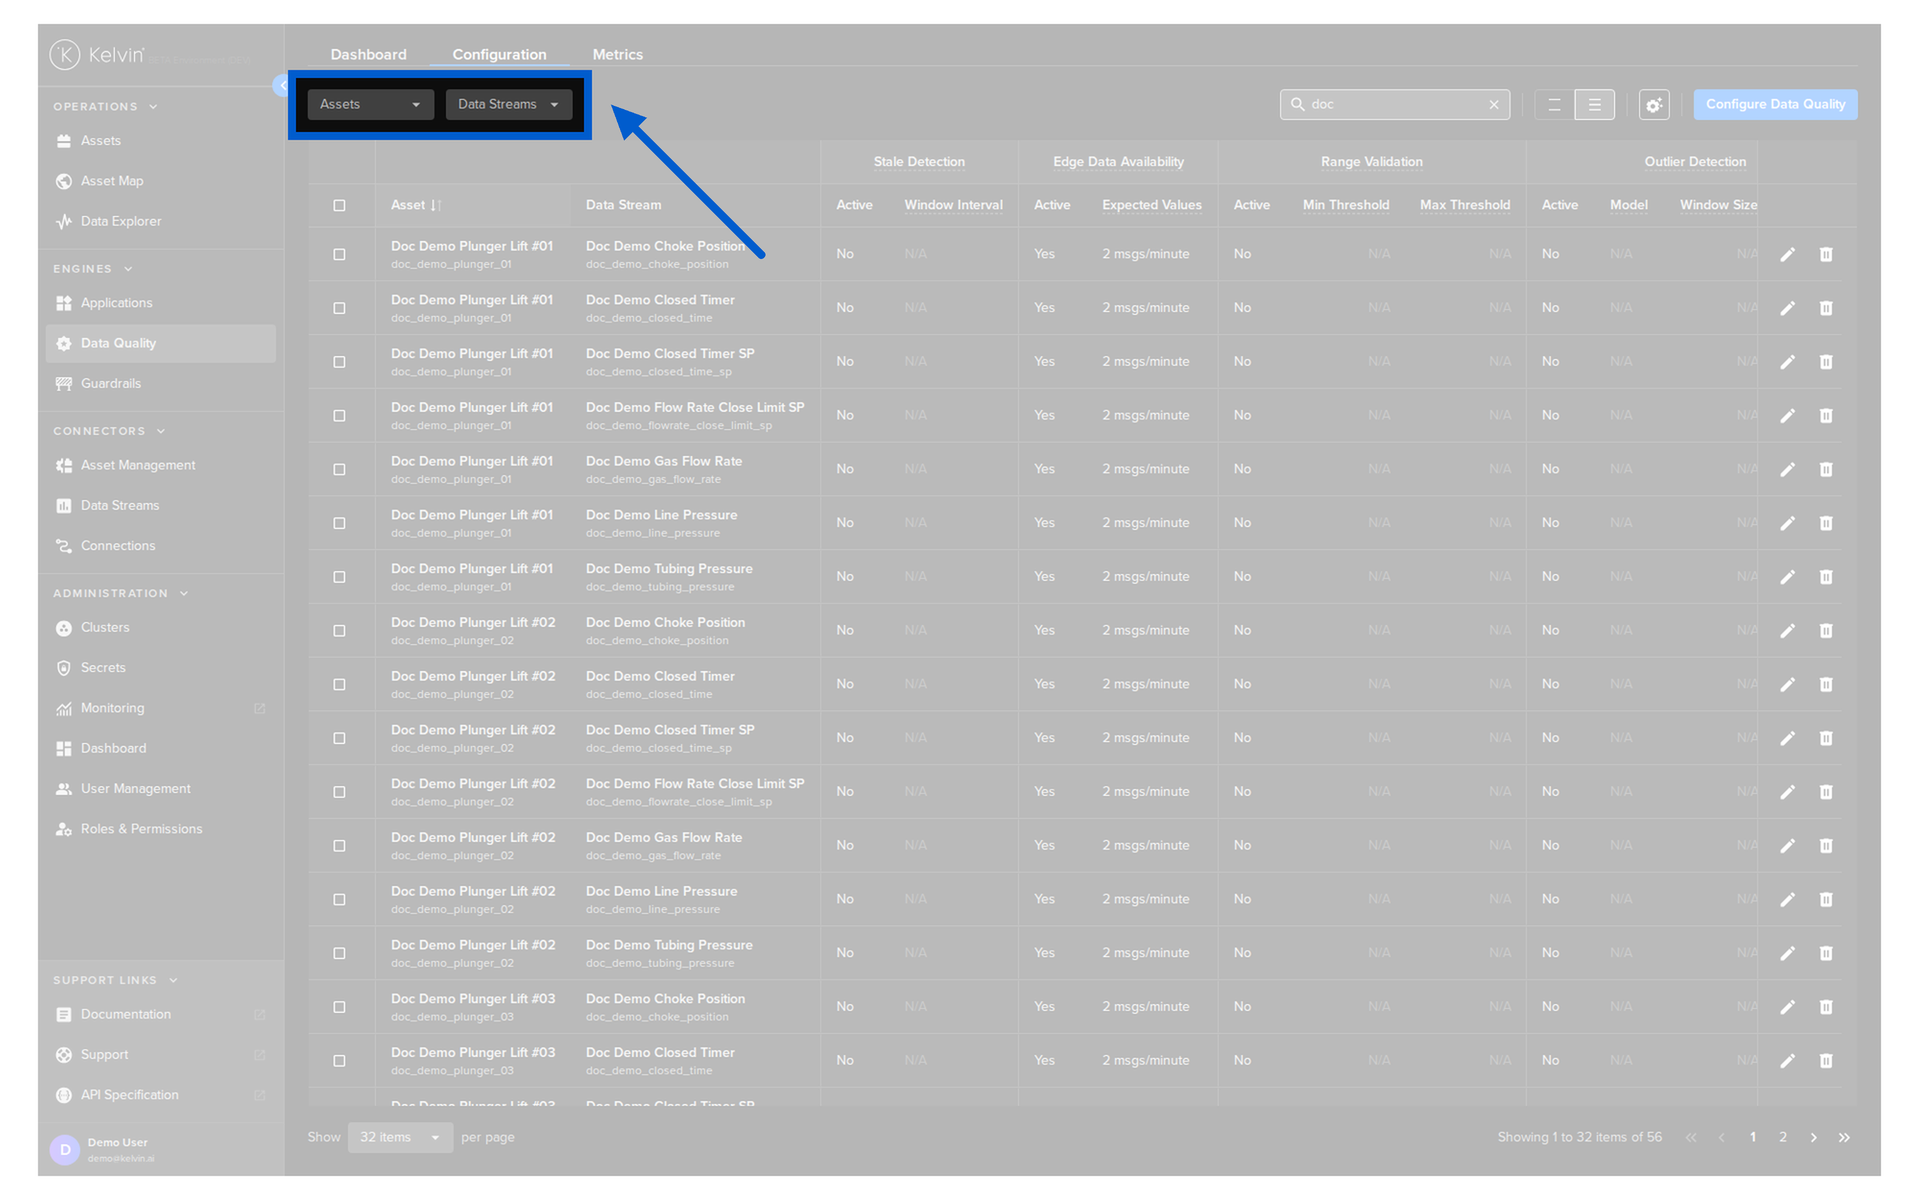
There are some quick filters that can help filter the table you want to display.
Note
The table will only show Asset / Data Streams that match ALL the filter options only.
| Filter | Description |
|---|---|
| Assets | Select the Assets that you want to see. You can select one or more Assets. |
| Data. Streams | Select the Data Streams that you want to see. You can select one or more Data Streams. |
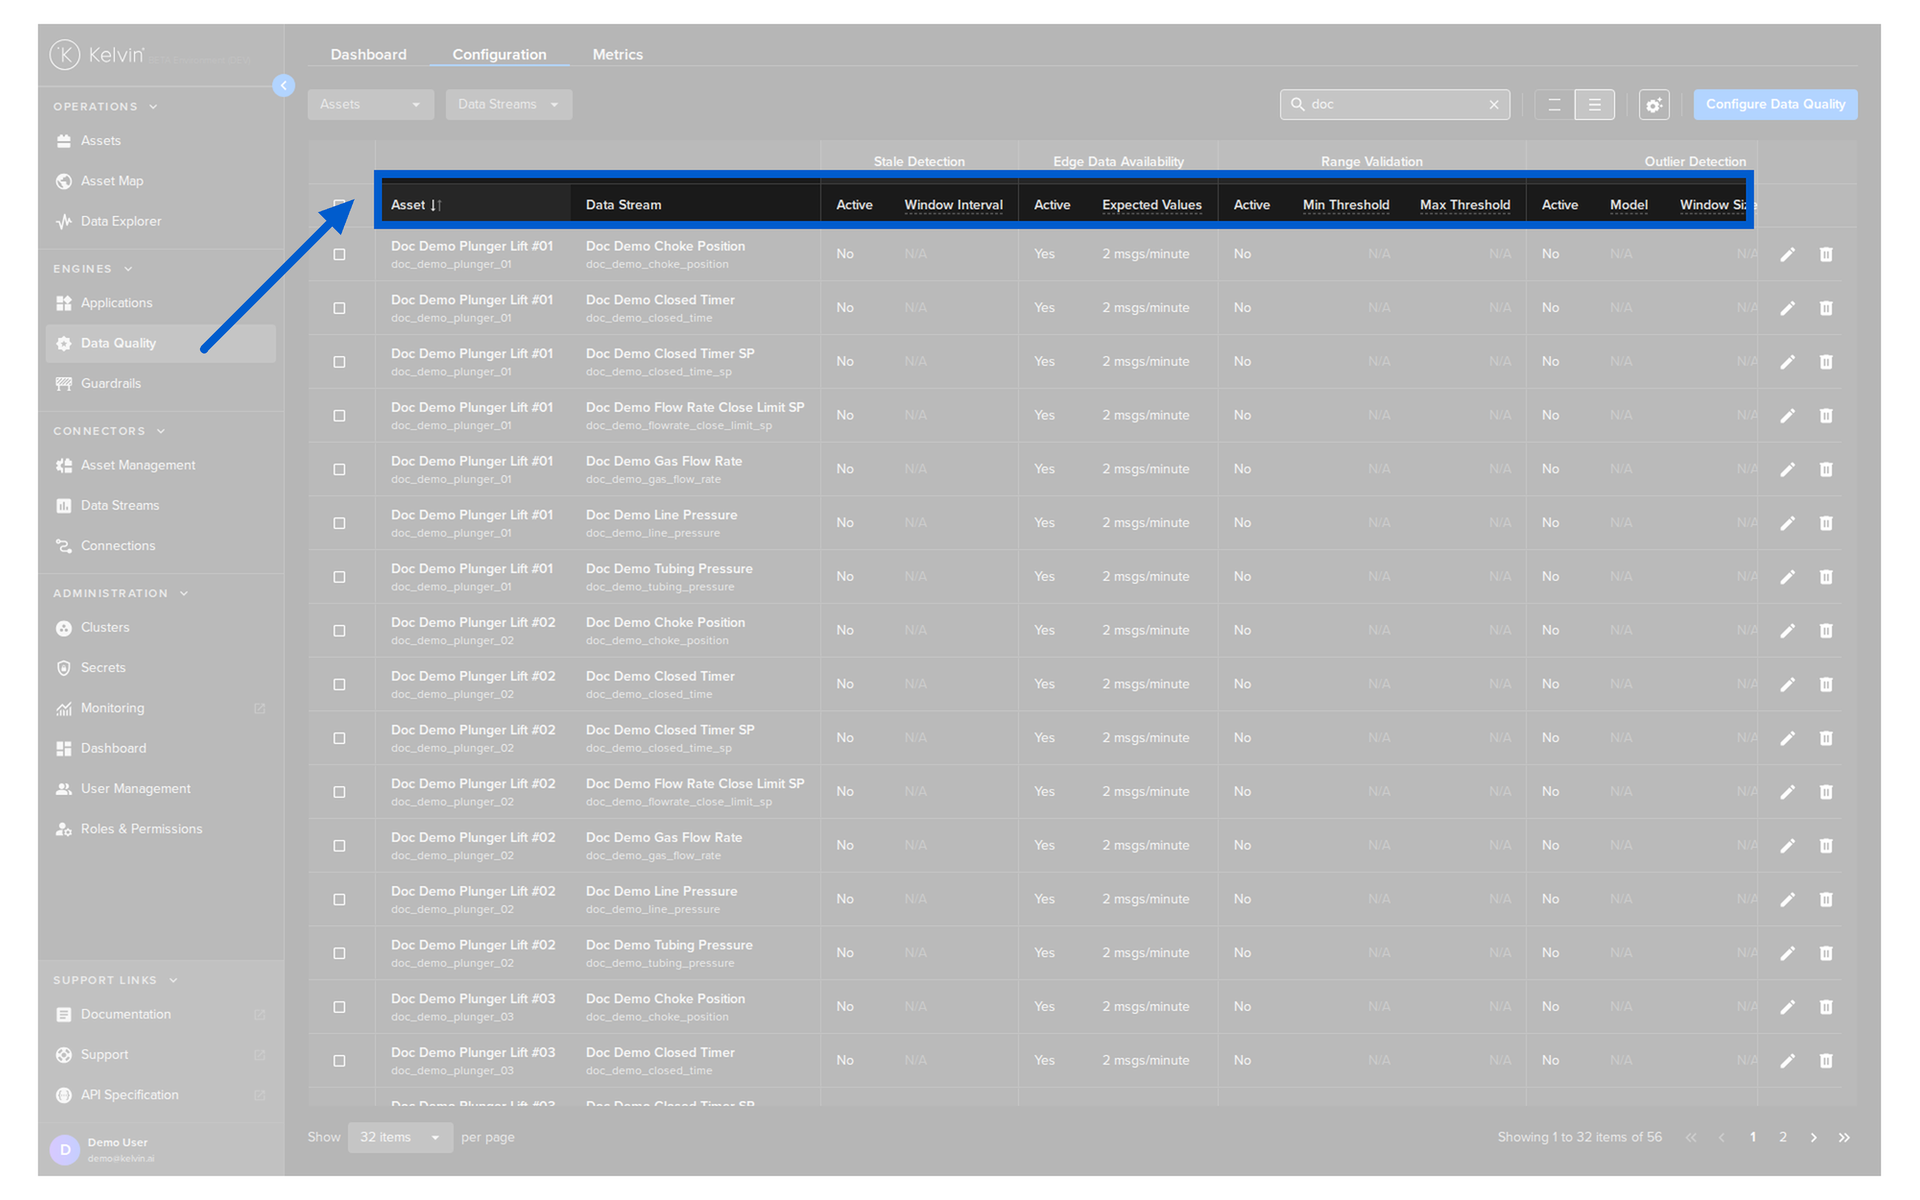
You can sort the table rows simply by clicking on the header name. Clicking it will cancel the other sorts in other headers and each click will rotate between ascending, descending and no sorting.
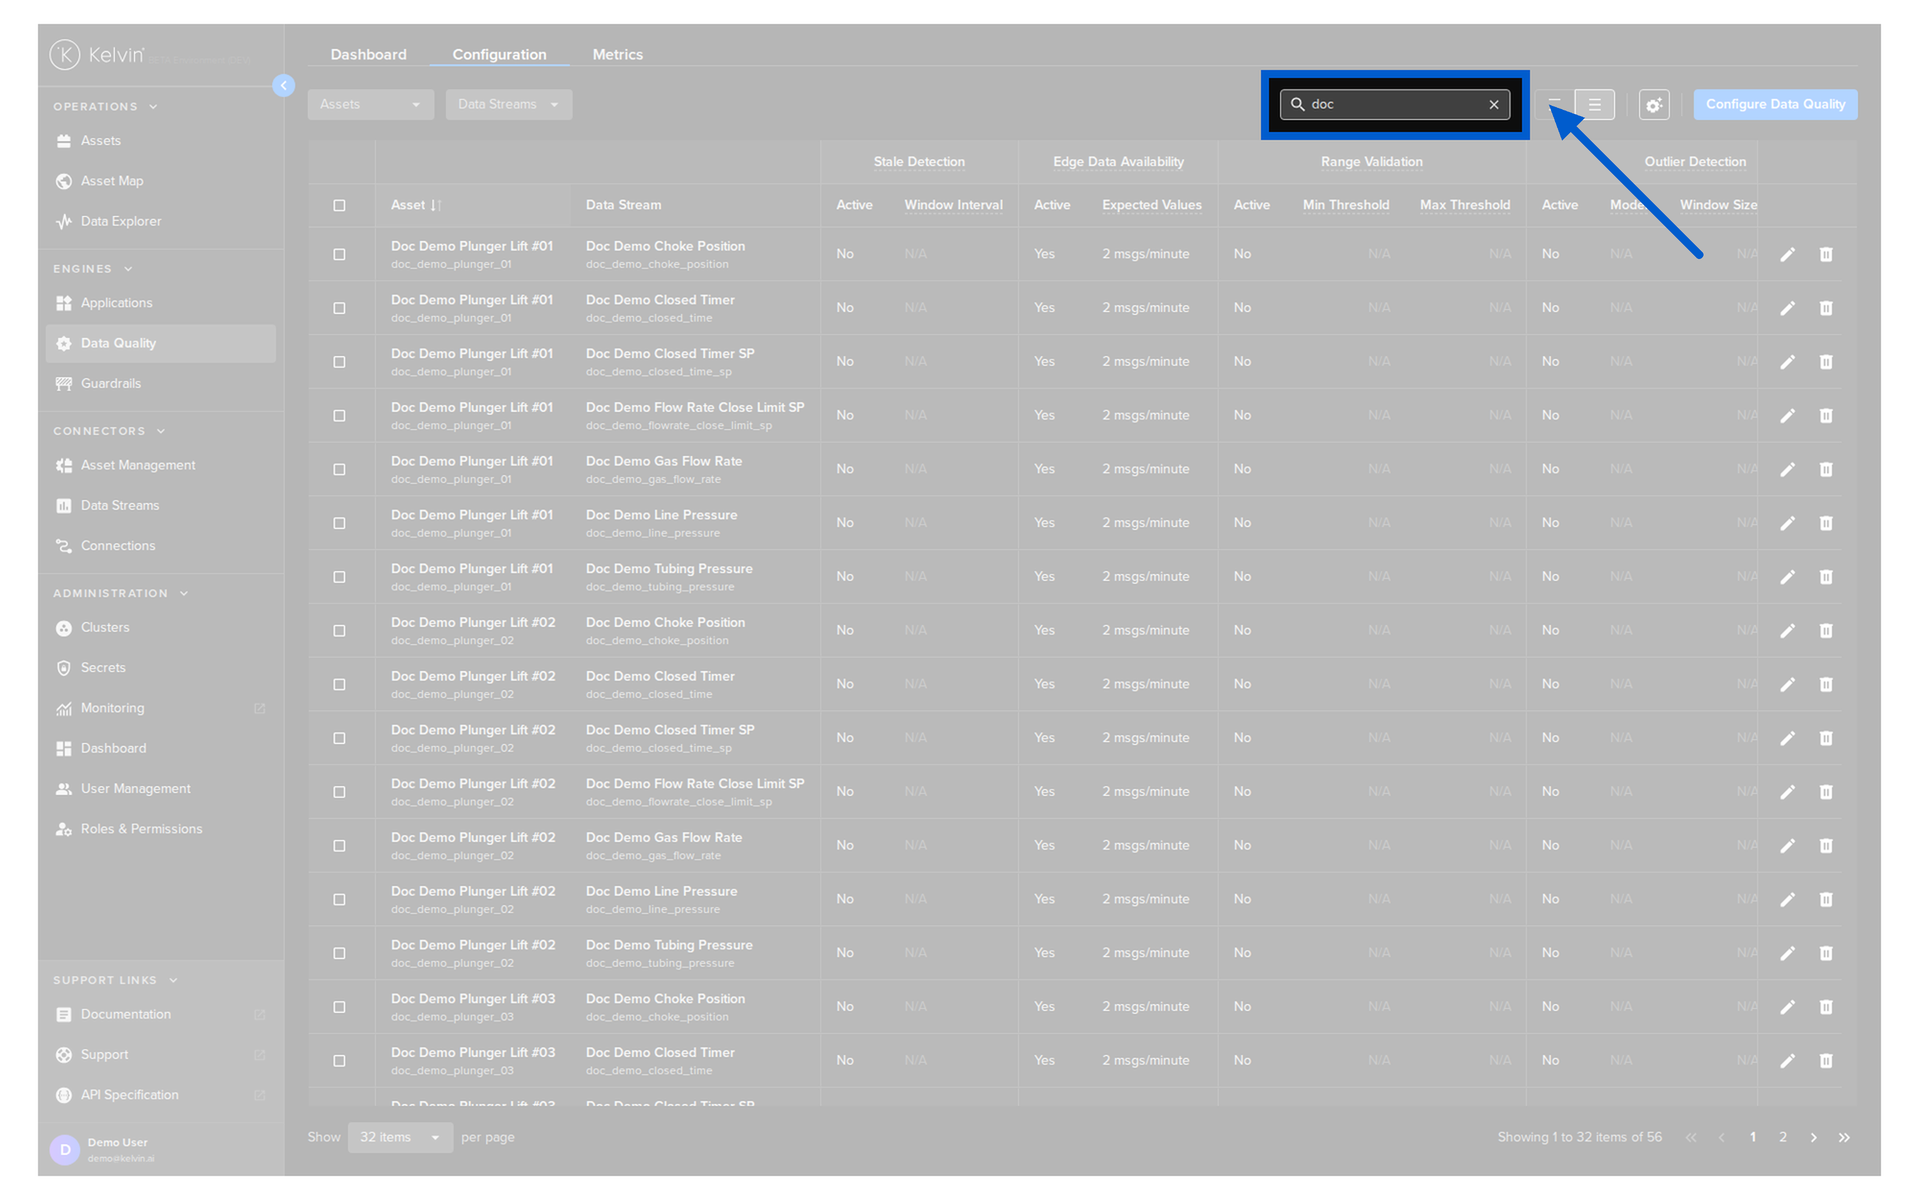
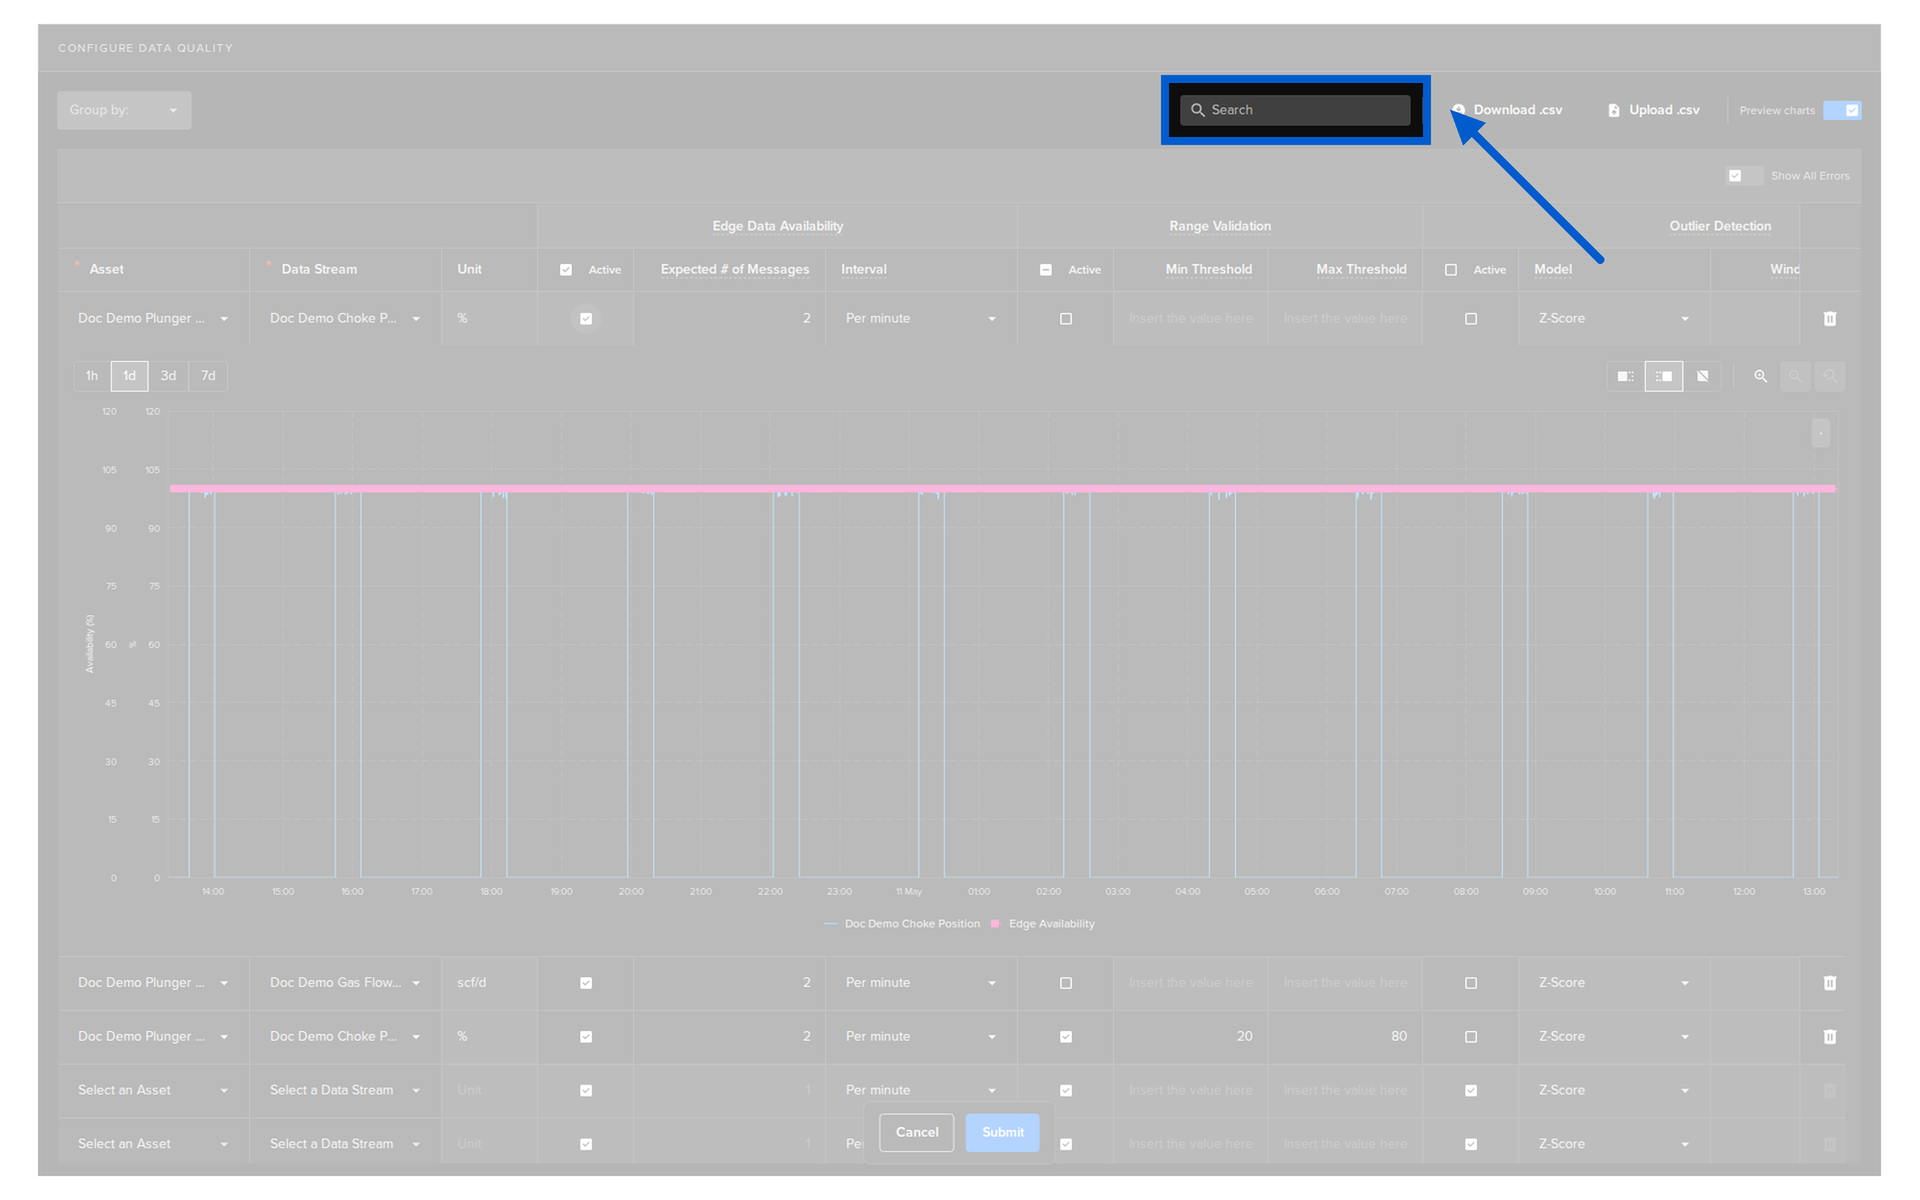
When dealing with large quantities of Assets, you can search for the Assets by name.
This is dynamic and will update the list as you type.
The search feature is not case-sensitive and will search for any matches anywhere in the Asset name, i.e. it does not have to be at the beginning of the name.
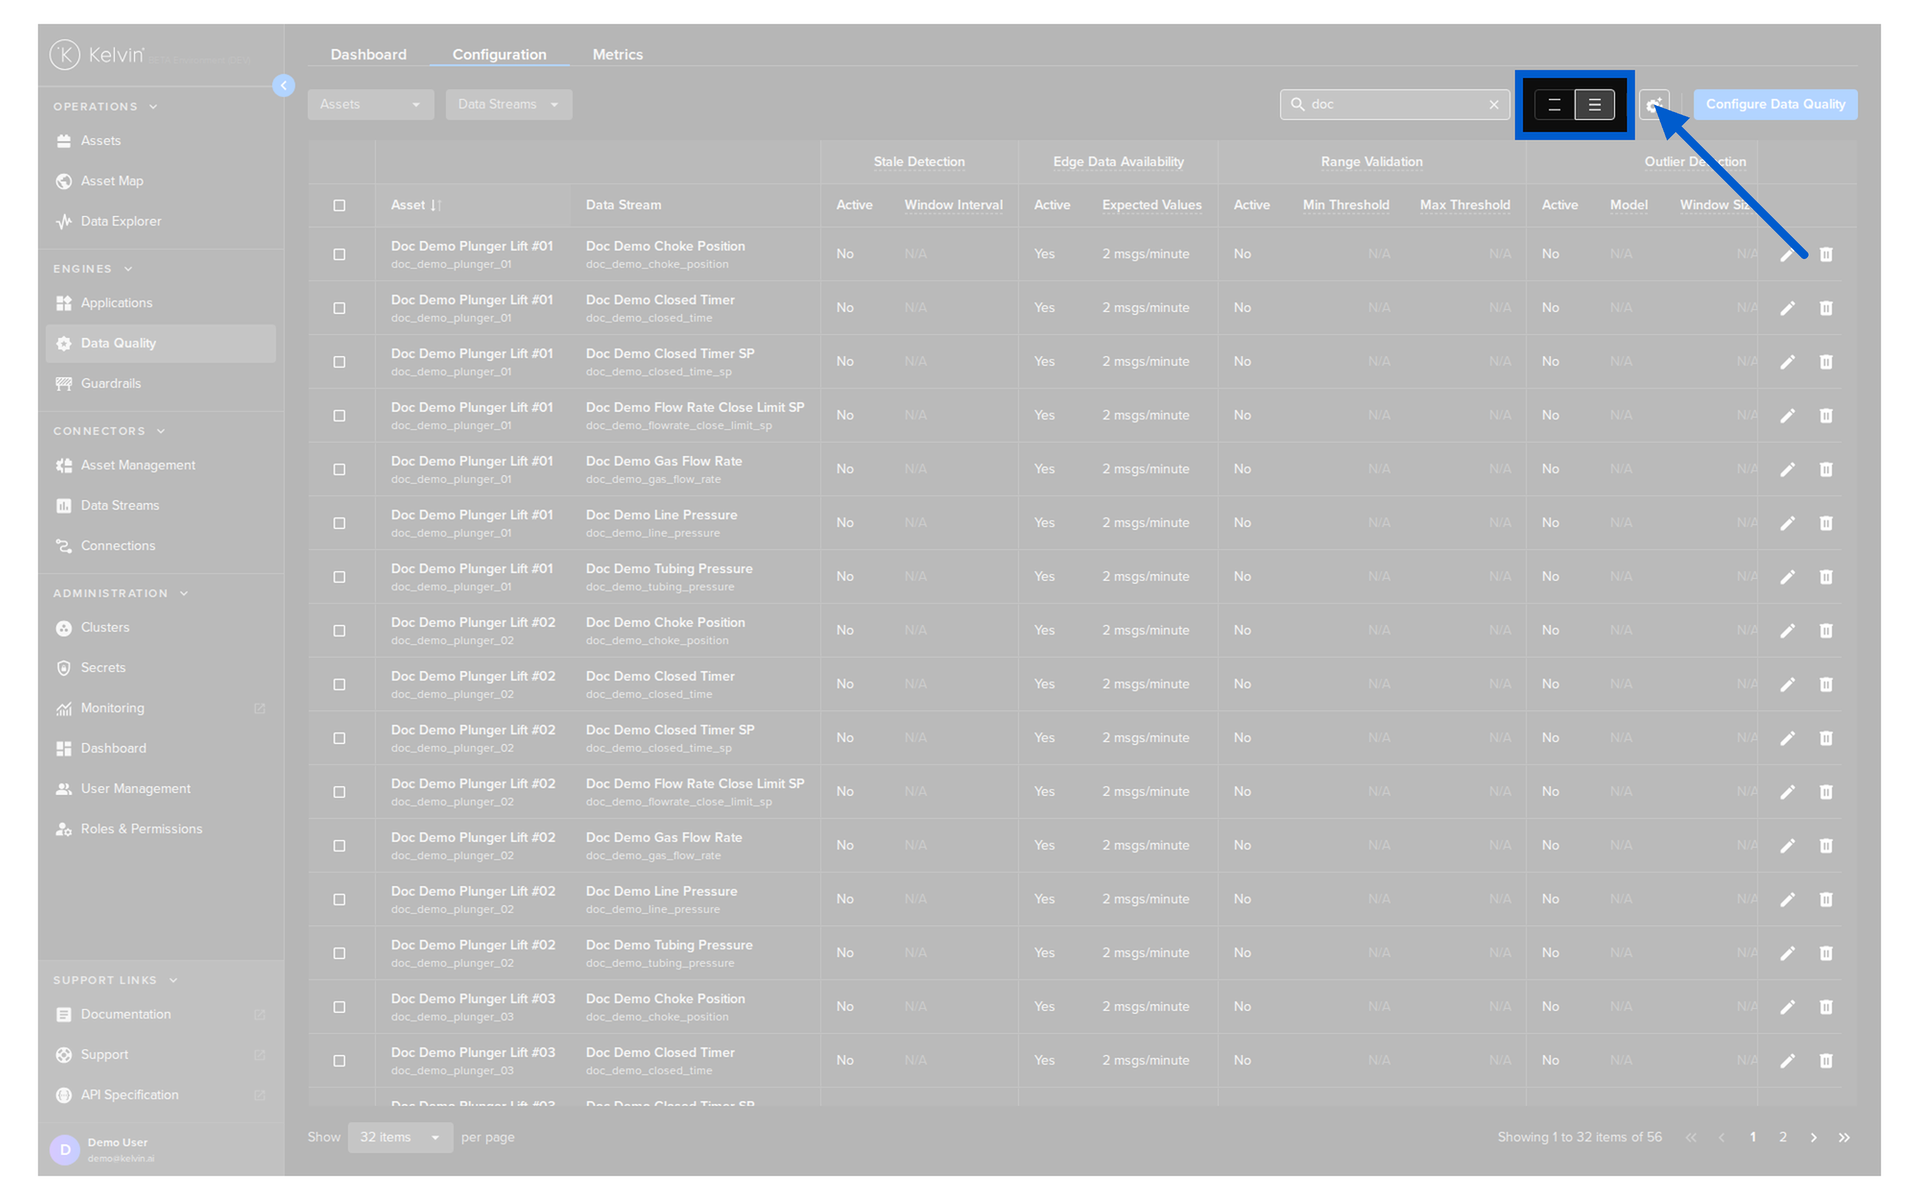
You can choose the height of the row to fit as many rows as possible on the screen, or space them out for easier readability.
You can select the number of Assets to show on each page and the page number to view. This is especially useful to set the information available in one page based on your screen size.
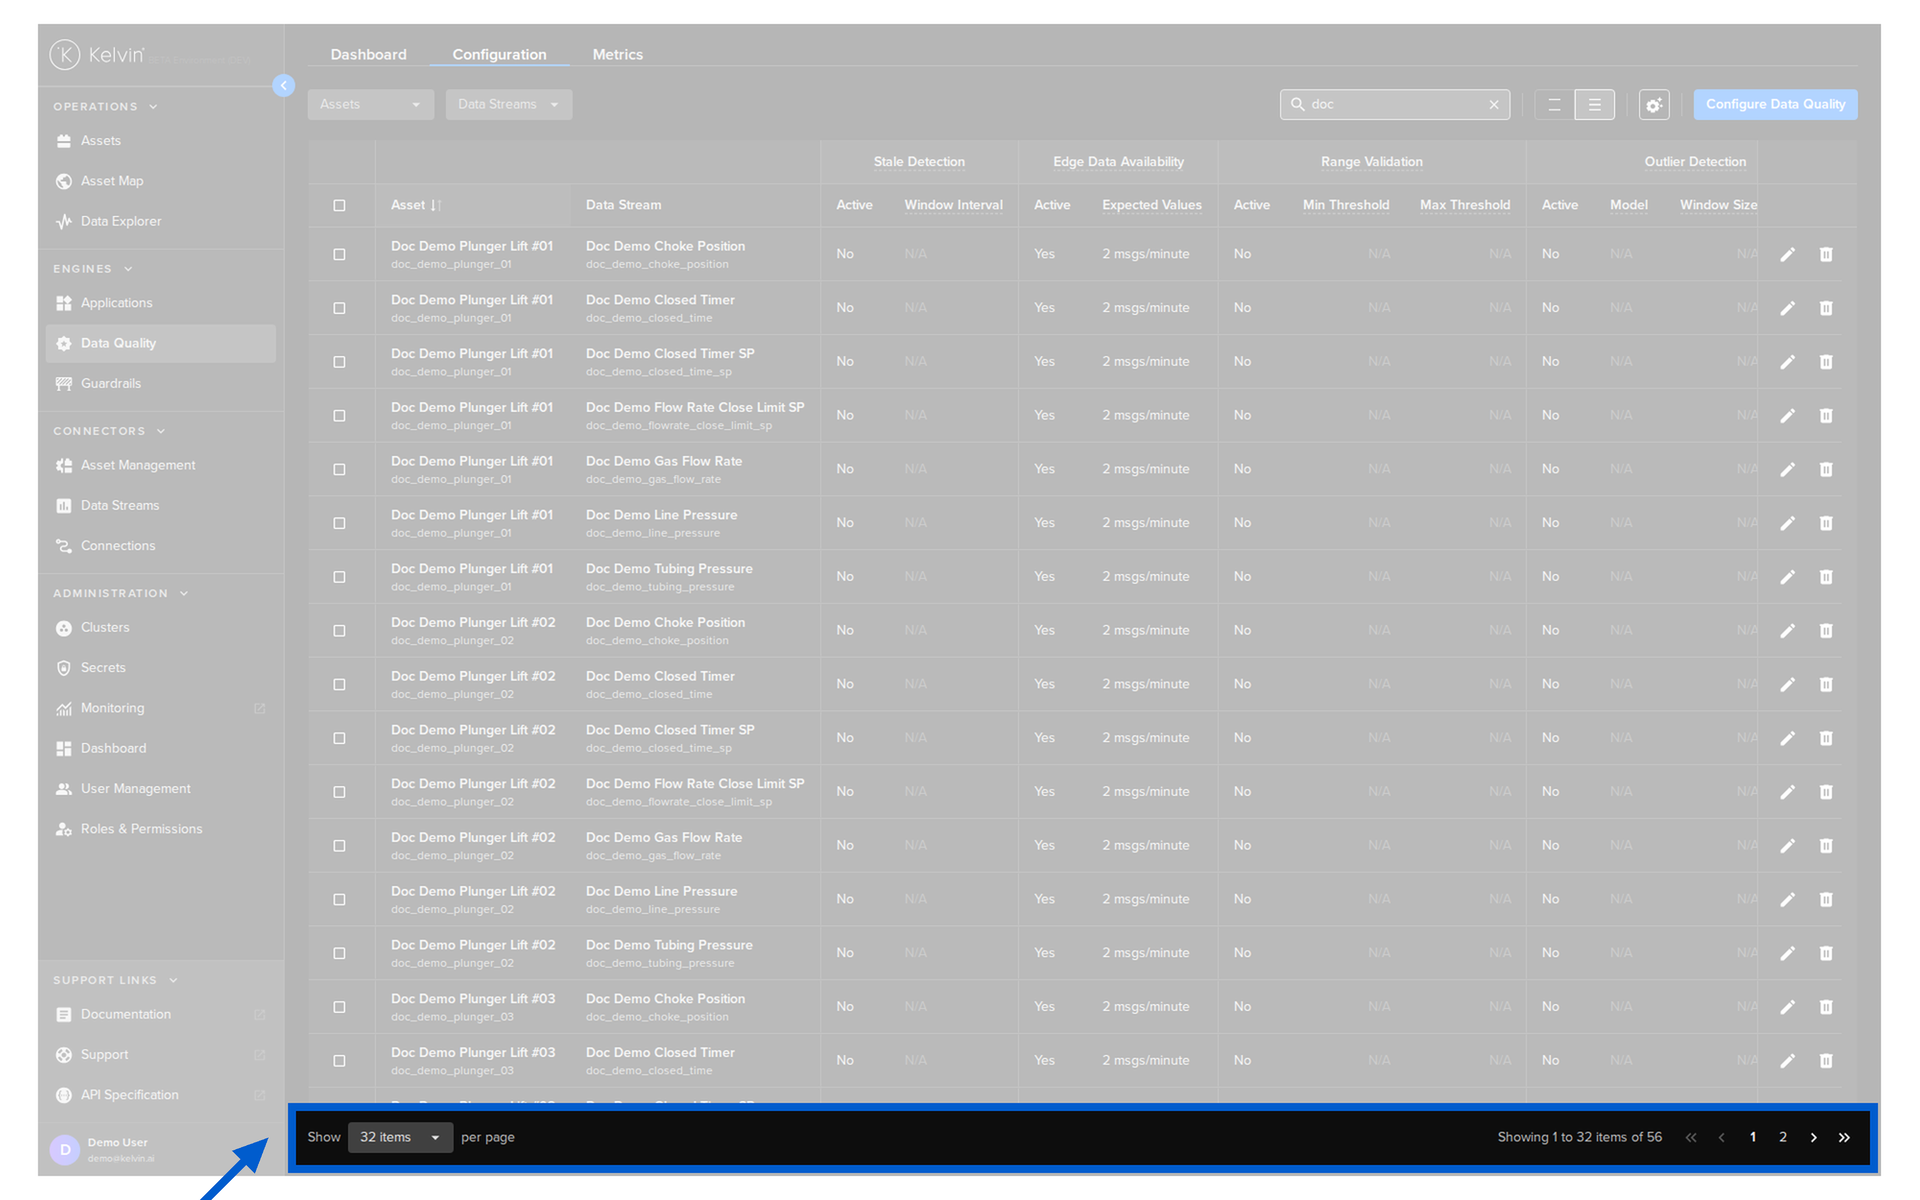
Table Configurations
Asset-centric tables bring many more advanced features to the lists to give you greater control in setting up the right overview experience.
When you click on the table configuration button ![]() ;
;
![]()
You will then see the Configuration Table options bar open up on the right hand side.
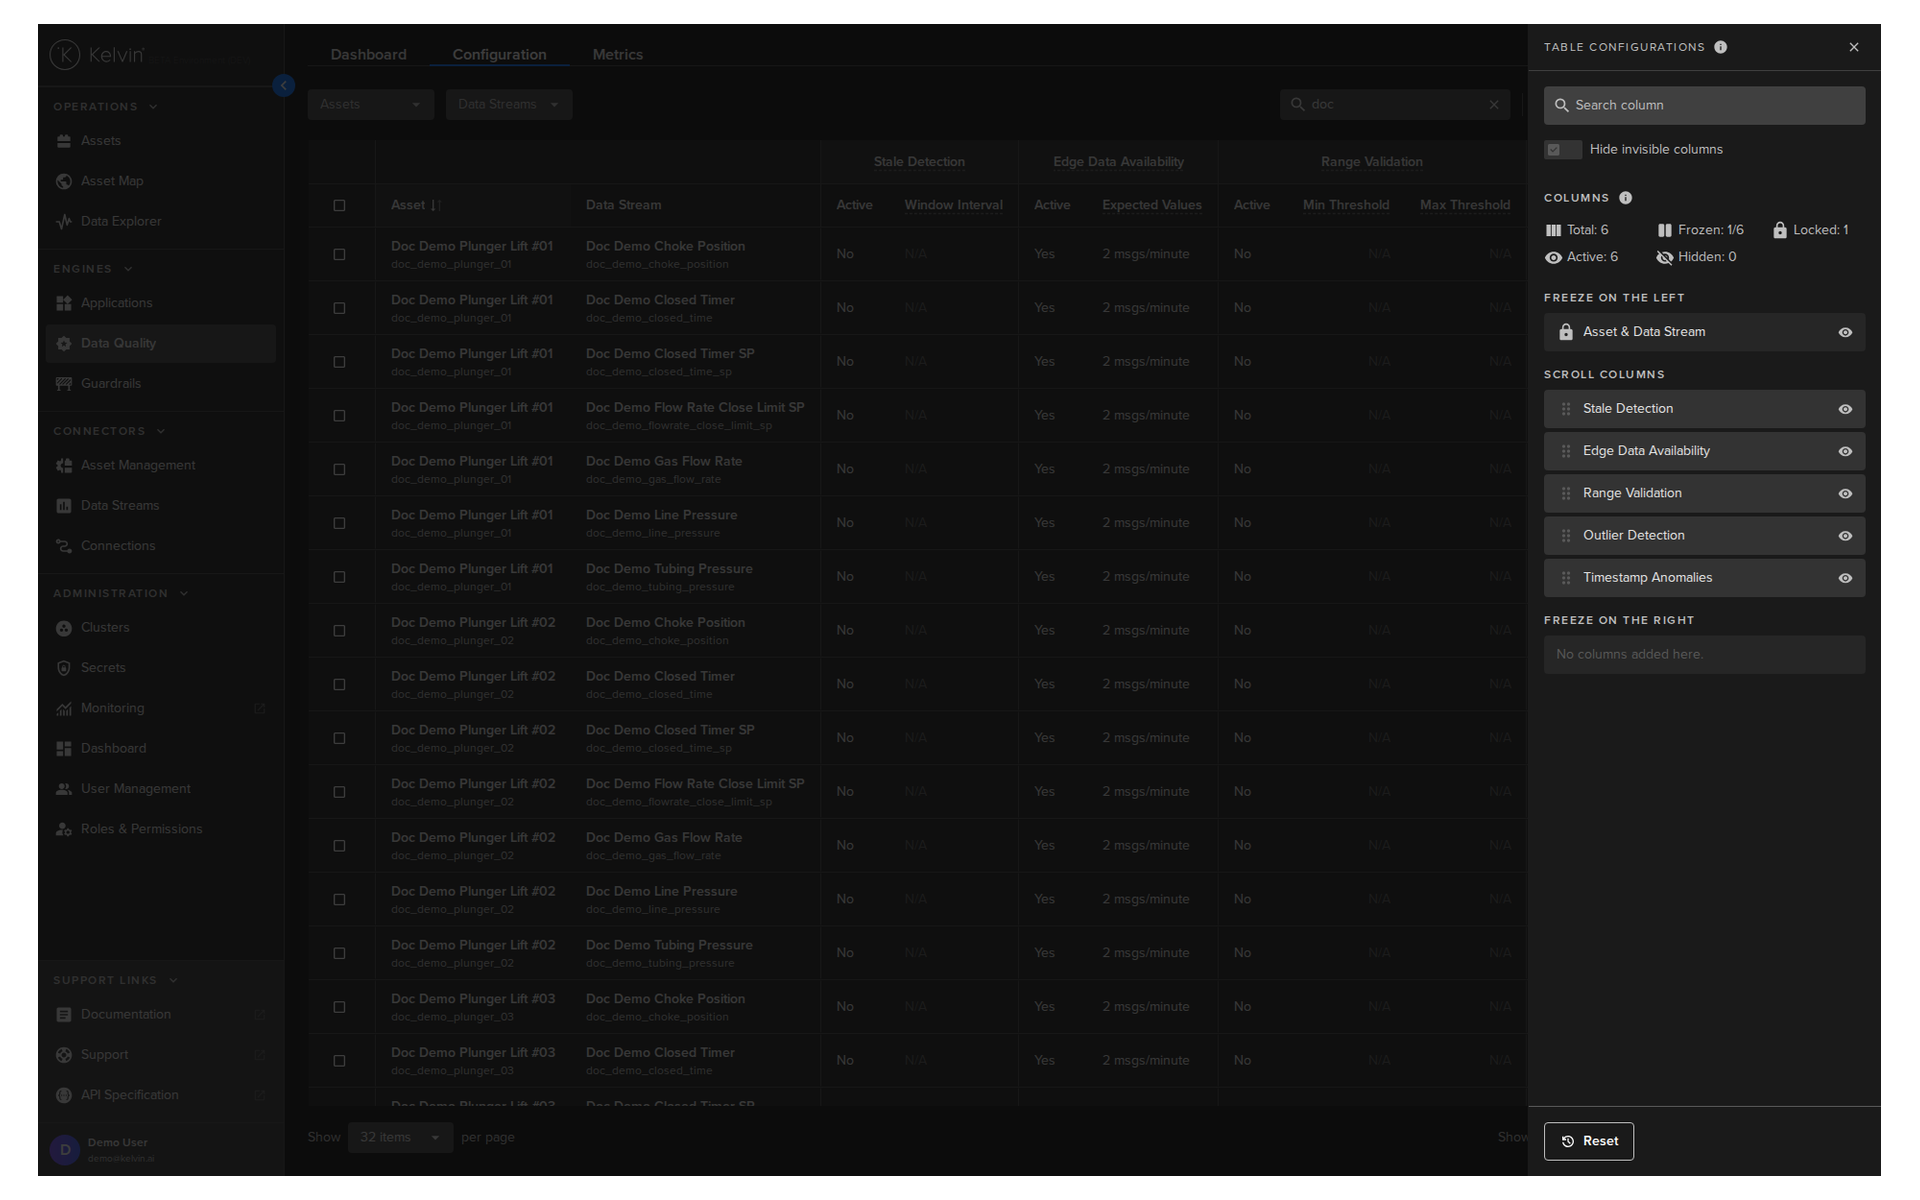
Options
There are a number of options available to customize the Table.
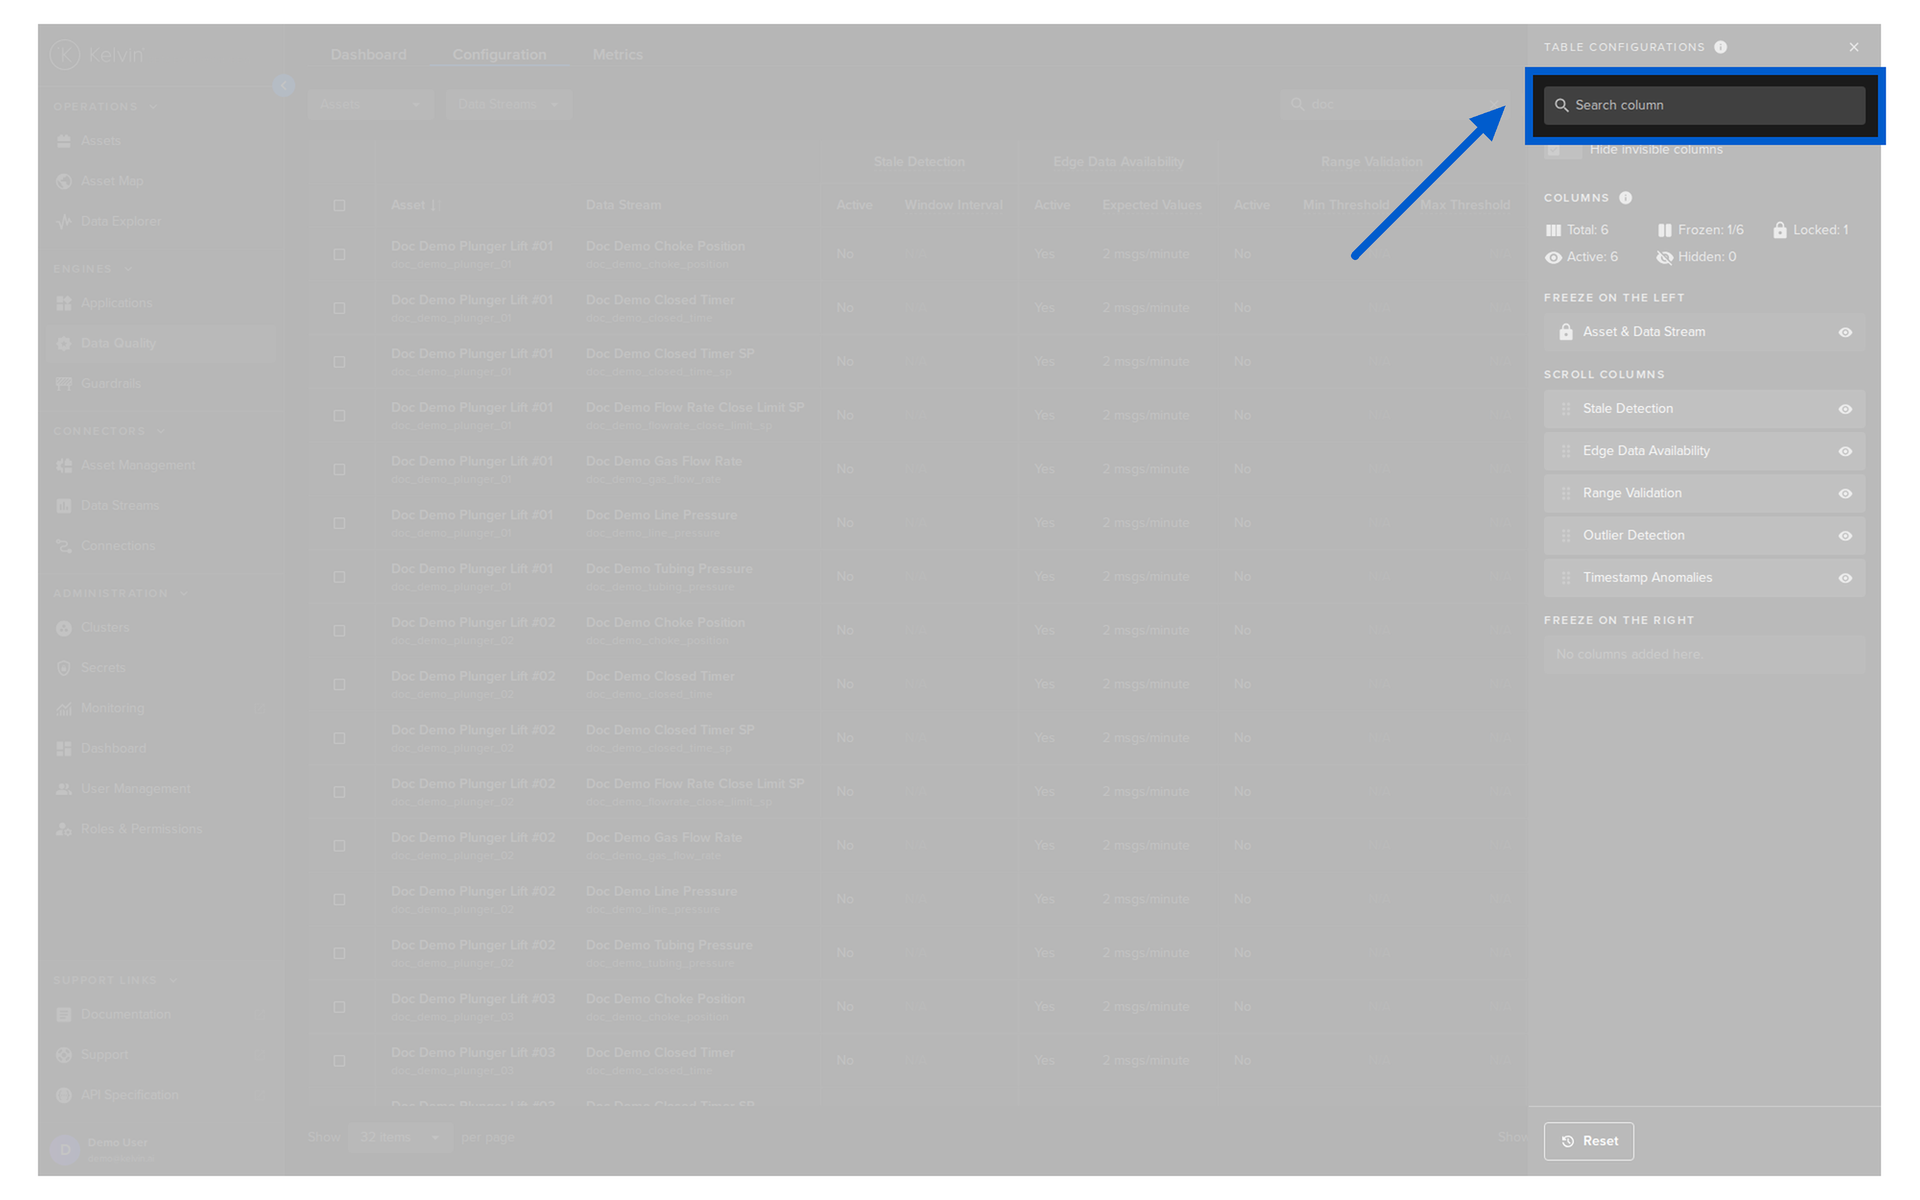
When you are inside the column settings with a large number of columns, this feature is useful to find columns and to hide the hidden columns from the list to make it easier to see what is relevant.
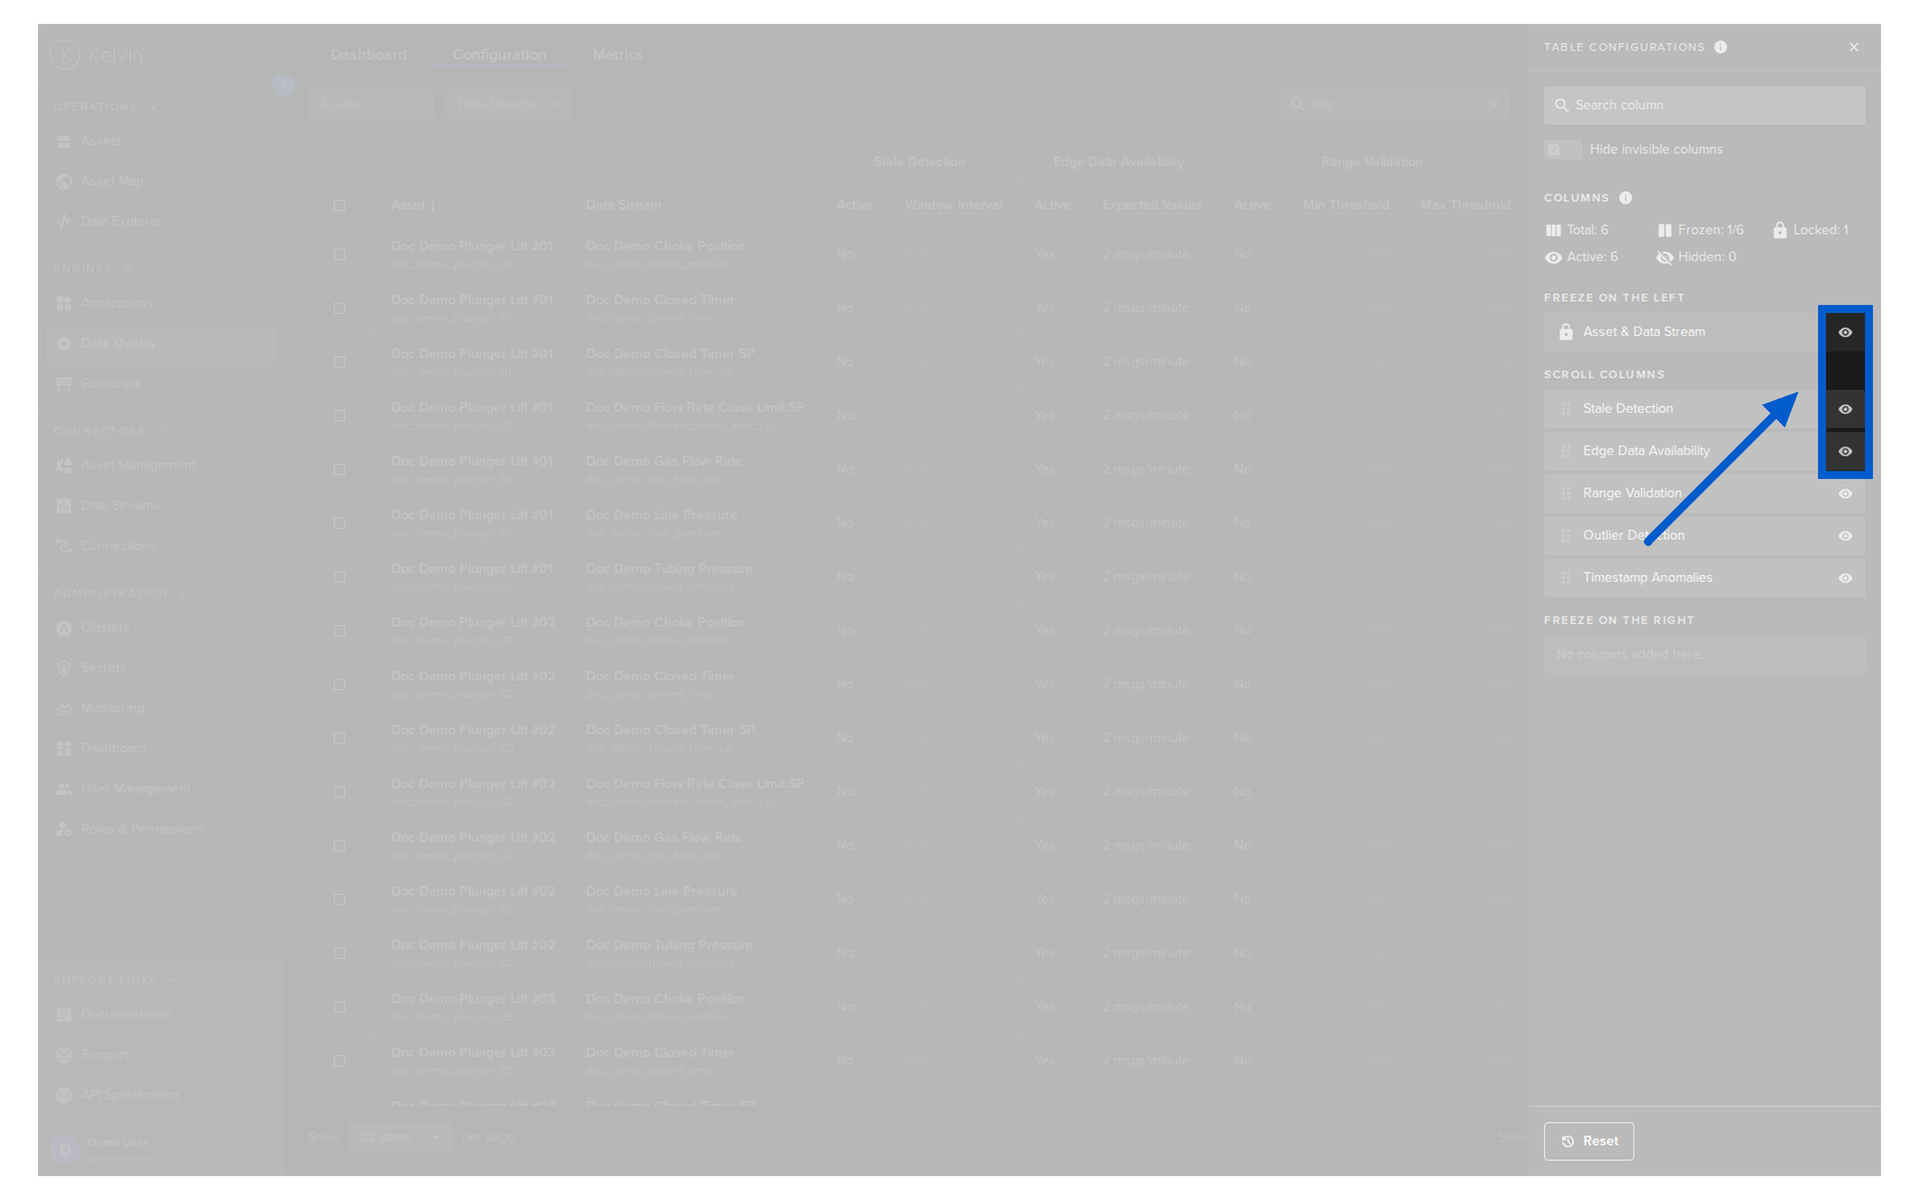
When you are inside the column settings you can show or hide available columns to ensure you only see what you need to see.
When you are inside the column settings you can see an overview of the columns available and showing.
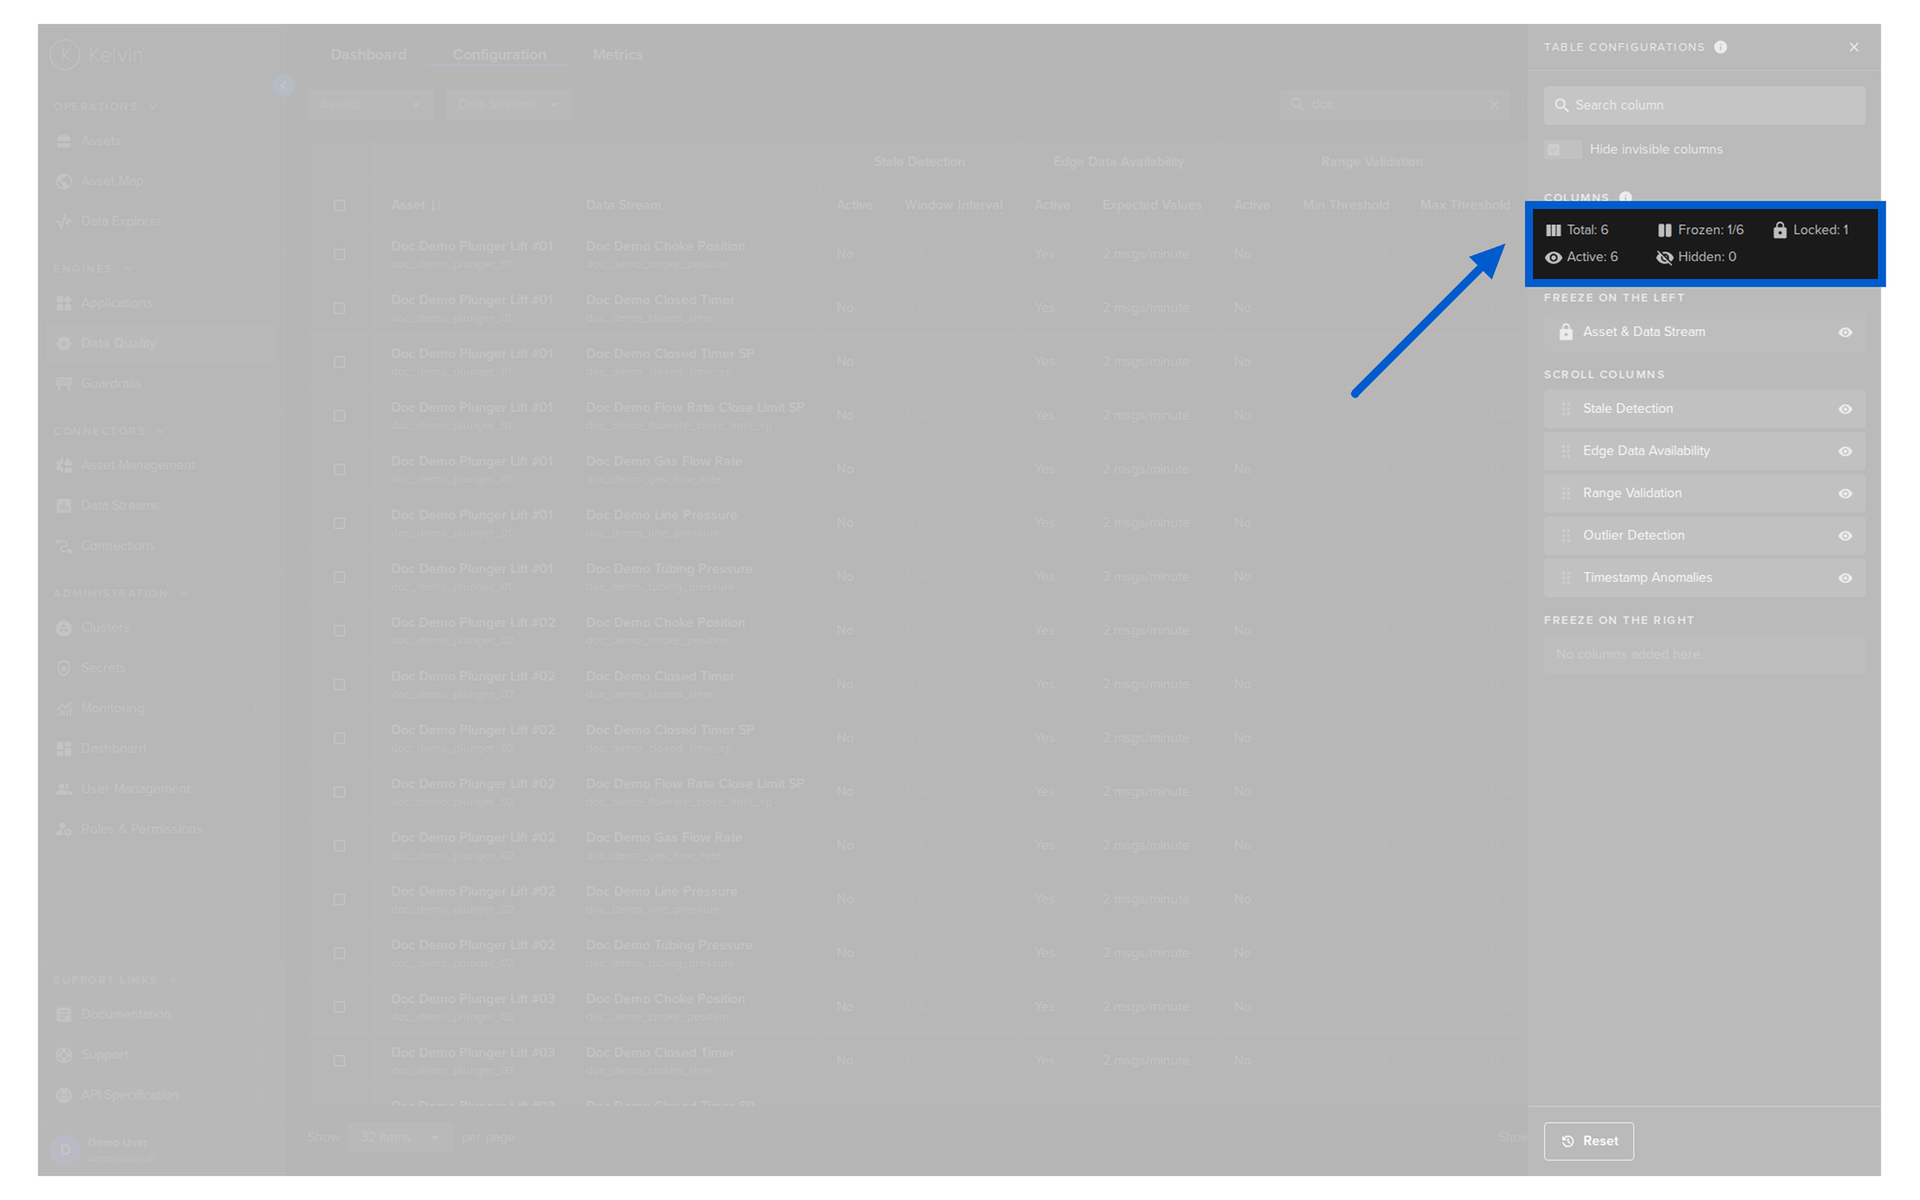
| Item | Description |
|---|---|
| Total | Total number of columns available (both active and hidden) |
| Frozen | Total number of columns that are in the left or right freeze positions out of a total number of columns that can be moved to the frozen sections |
| Locked | Total number of columns that can not be moved or edited |
| Active | Total number of columns that will be shown on the table |
| Hidden | Total number of columns that will not be shown on the table |
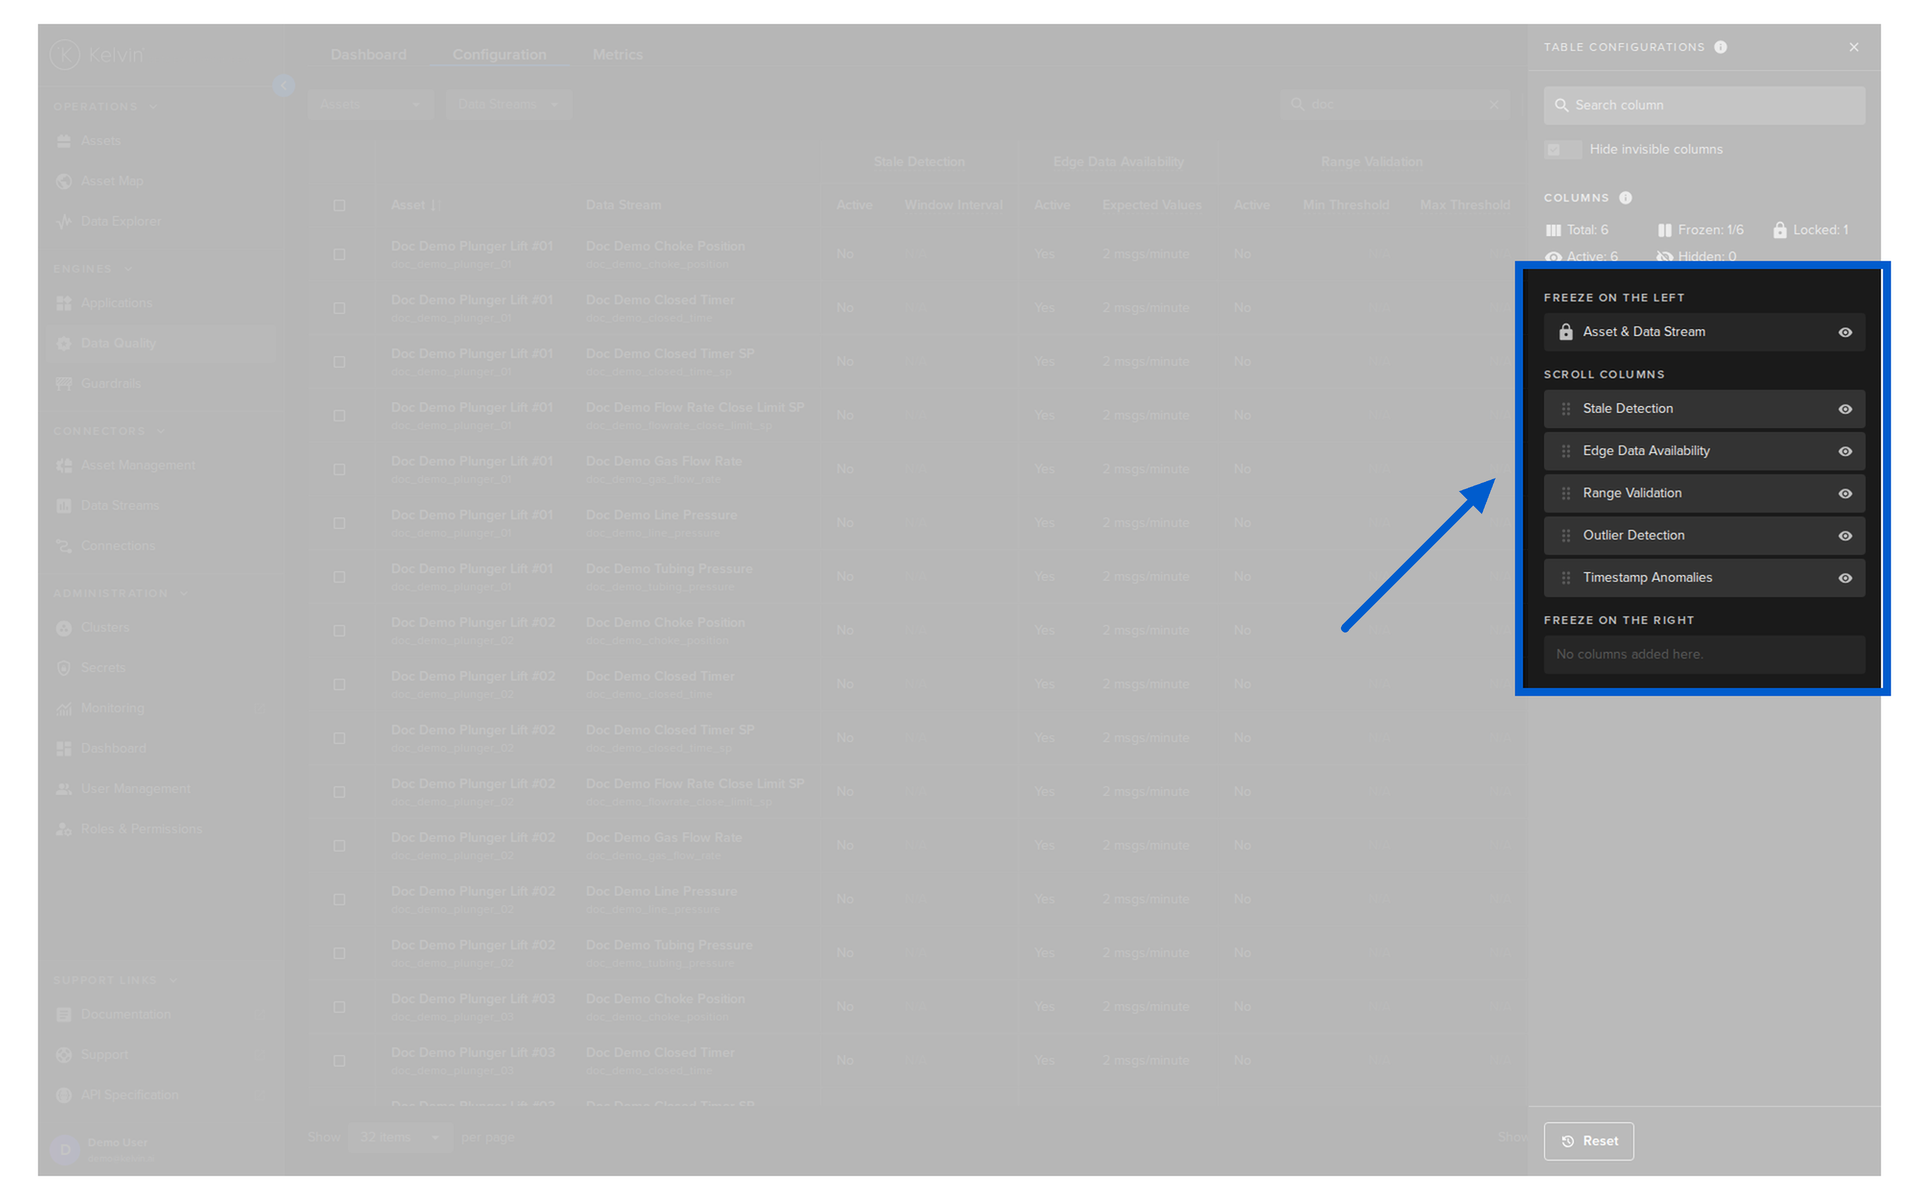
When you are inside the column settings you can freeze columns left and right. This ensures the columns will always show, even when you scroll left or right to see all the columns.
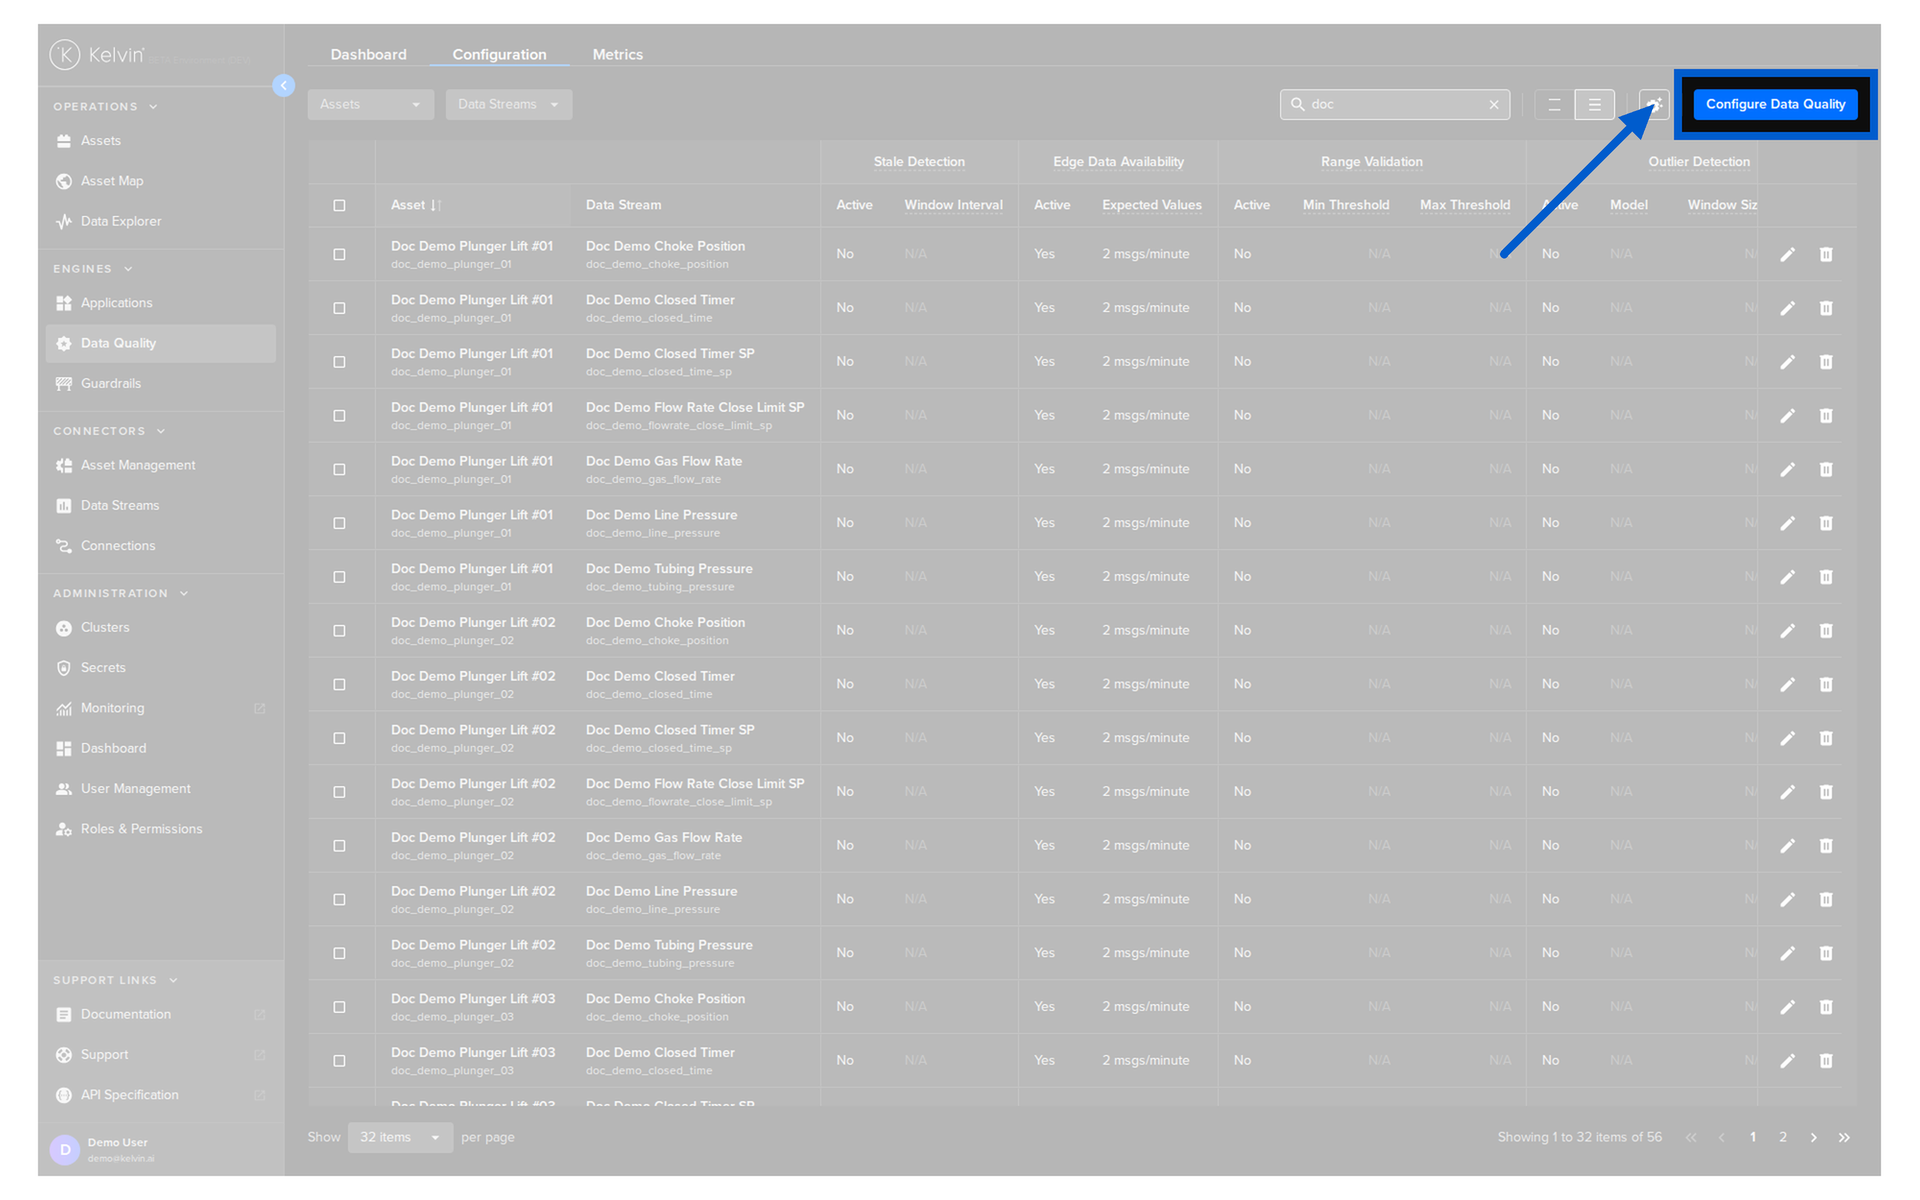
Configure Data Quality
You can insert new Asset / Data Stream pair metrics into the Data Quality table.
Note
When inserting, you do not need to enable all the in-built metric algorithms.
You will have the option to select the metrics required and set their parameters.
To start, click on the Configure Data Quality button.
Select Assets
A popup will appear showing you the different ways you can select a list of Assets to insert Data Quality metric algorithms.
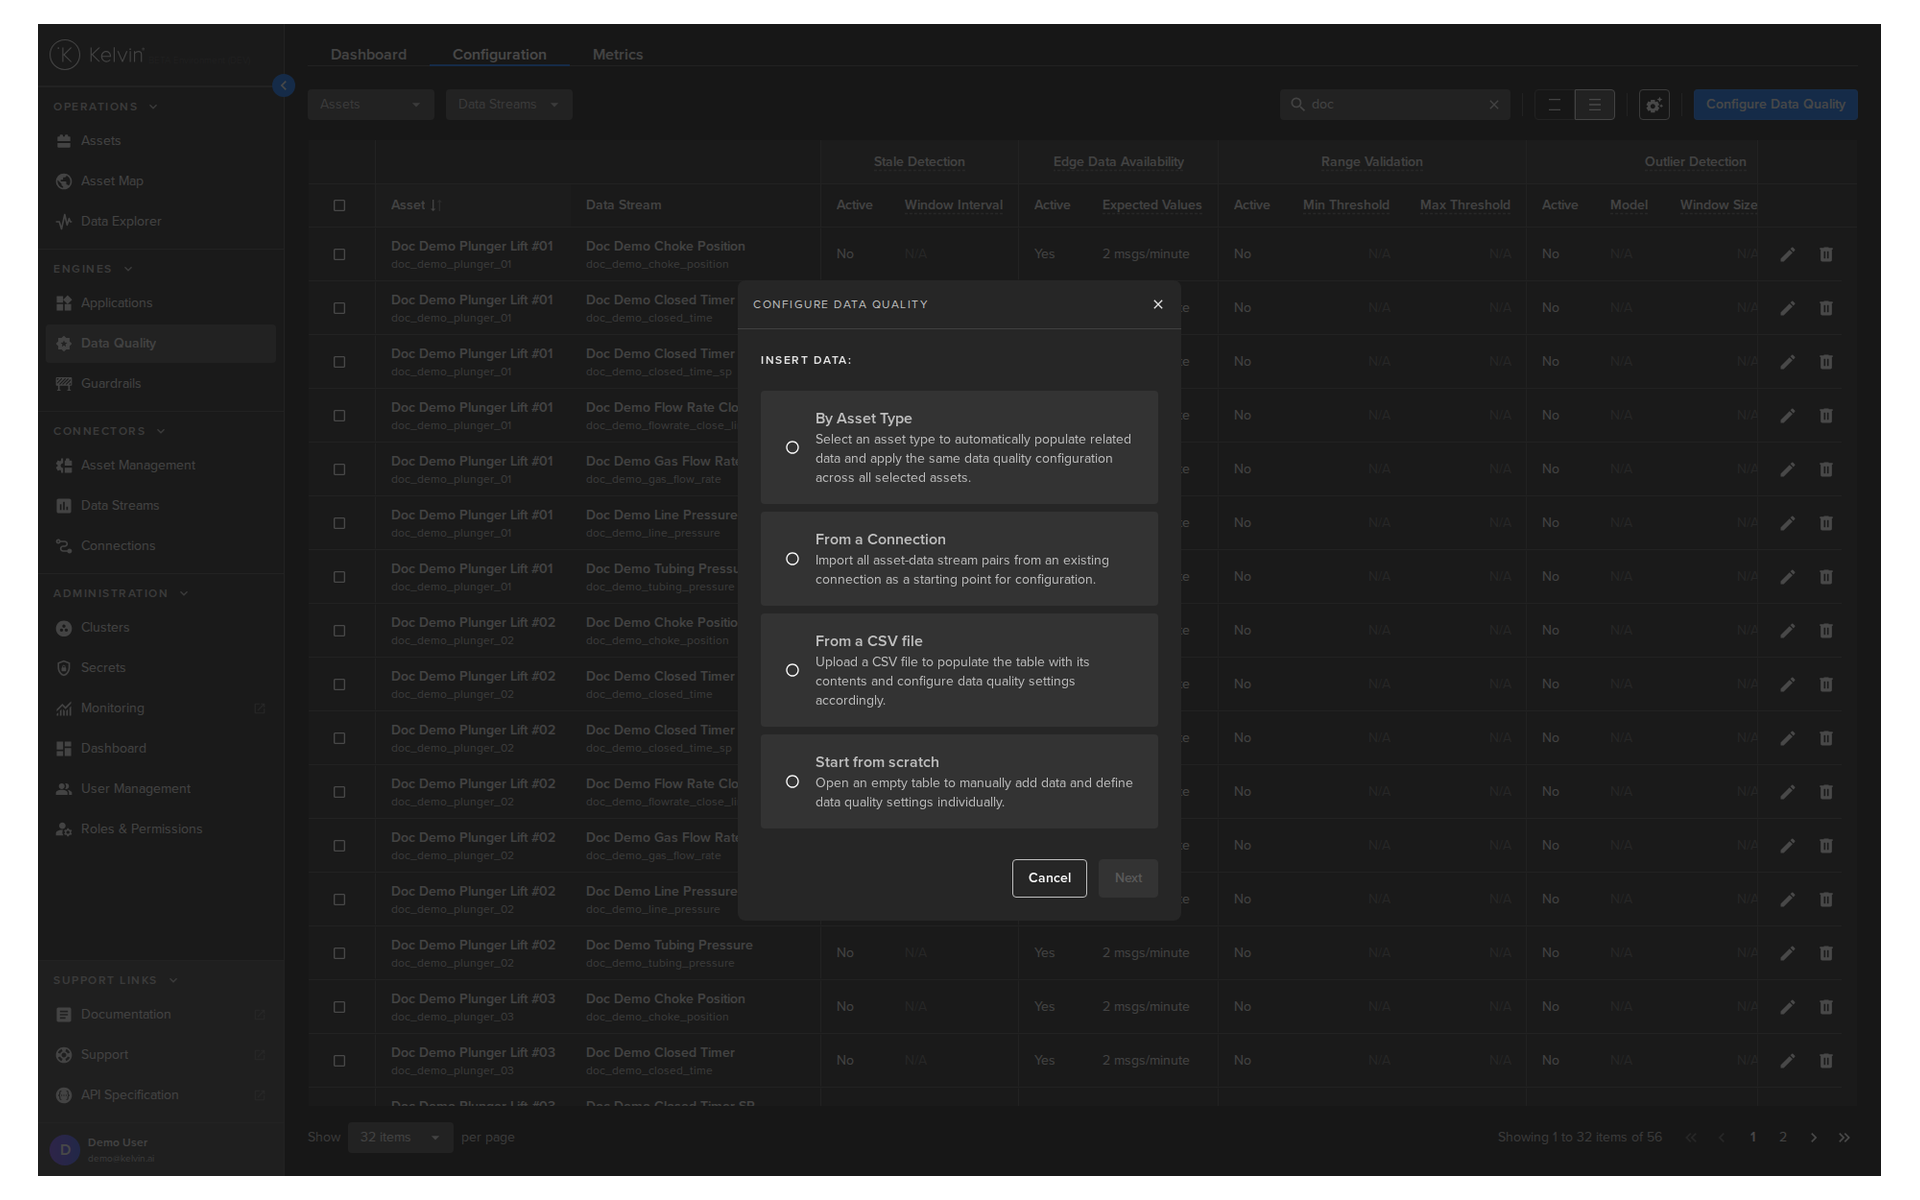
By Type Asset
This option allows you to choose one Asset Type.
The Assets drop down list will then be populated with Assets associated with the Asset Type.
Note
All the Assets will all be automatically selected, though you have the option to only select some of the Assets.
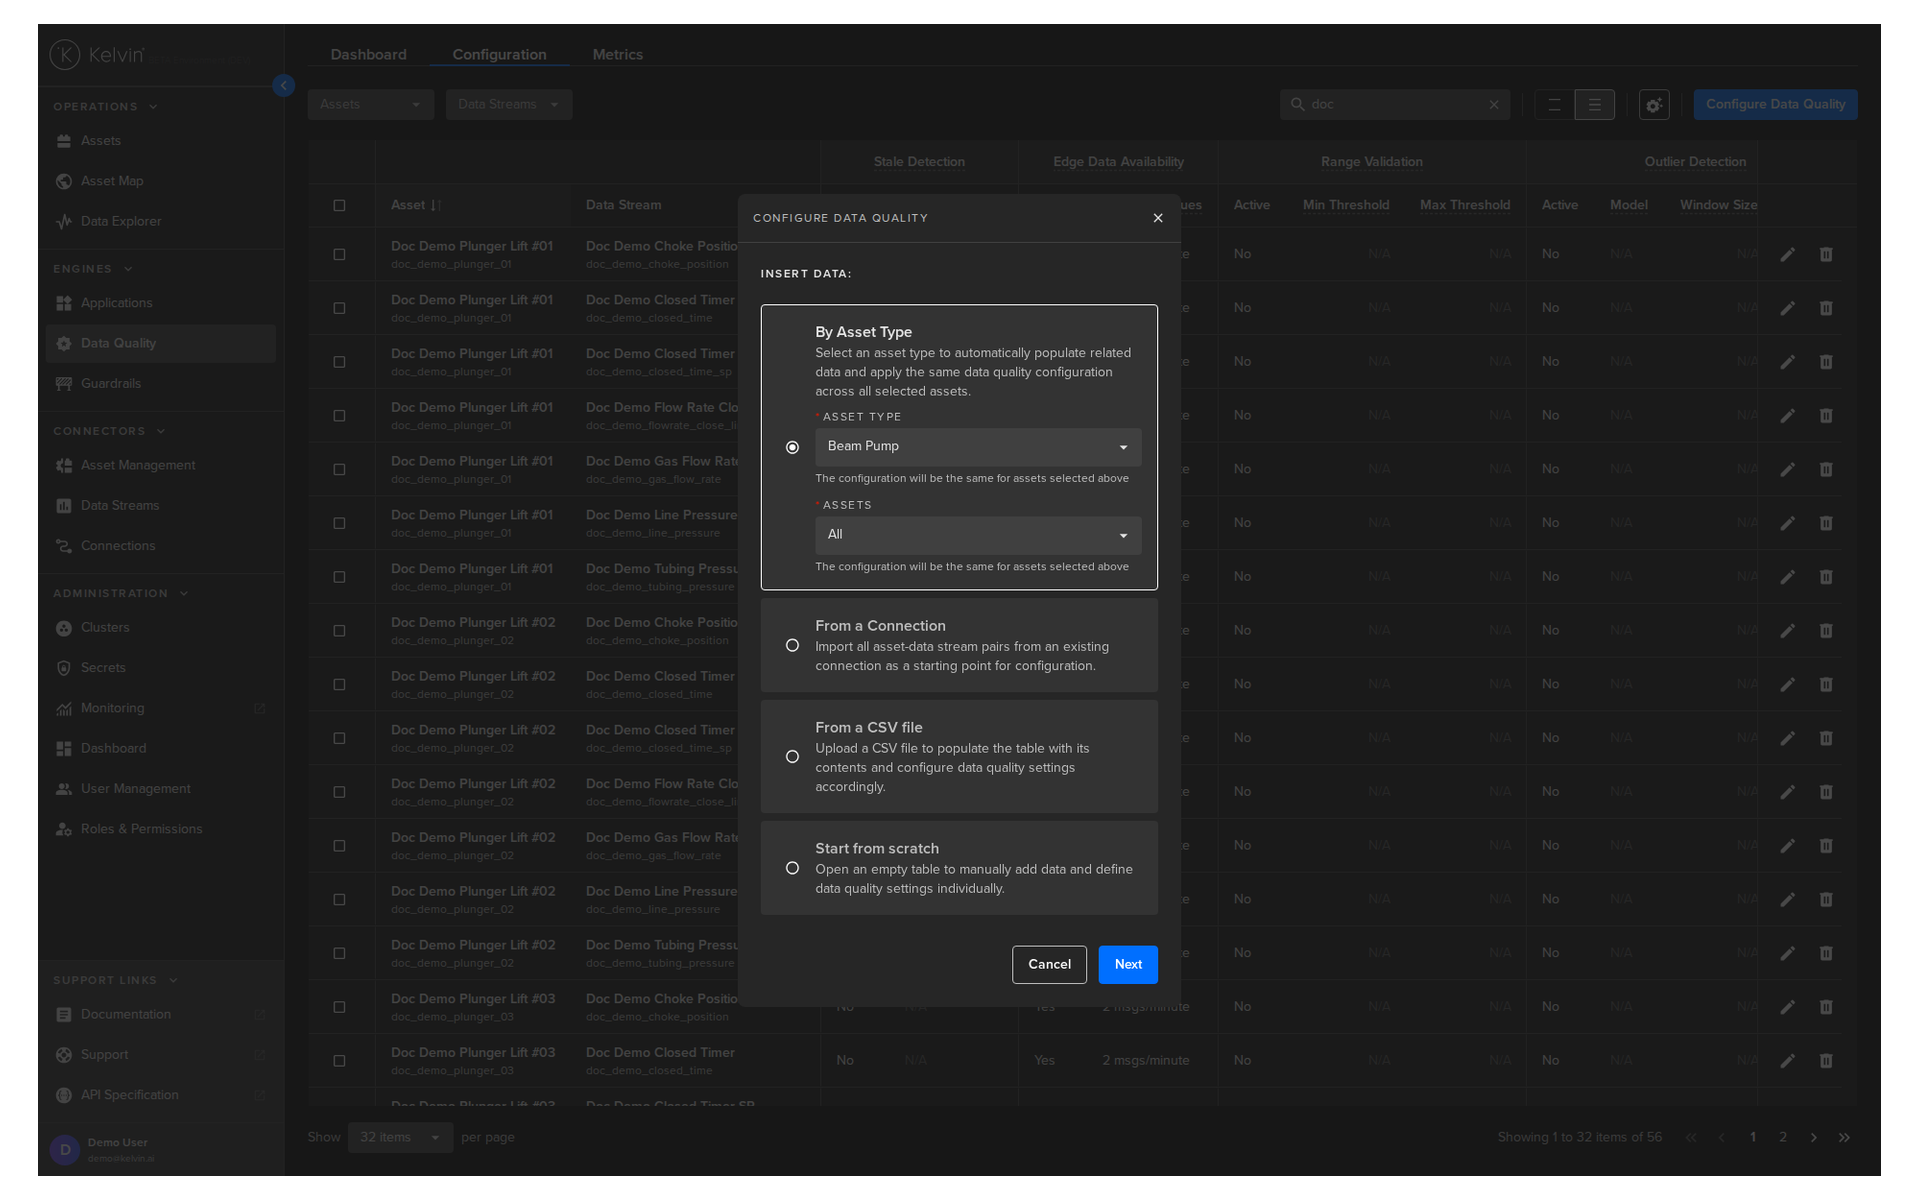
When ready click the Next button.
You will then see the Configure Data Quality screen where you can edit the metric settings for each Asset / Data Stream pair.
Note
The settings will be applied to all Assets in the connection automatically.
You can not individually edit which Assets to insert Data Quality metrics.
Note
Turn on Live Metrics from the switch in the top right corner to see all cells which need to be filled in.
Turn on Filter Errors to only see the rows that have metric errors.
From a Connection
This option allows you to choose one Connection.
All the Asset / Data Stream pairs in this Connection will be automatically selected.
Note
There is no option to select individual Assets.
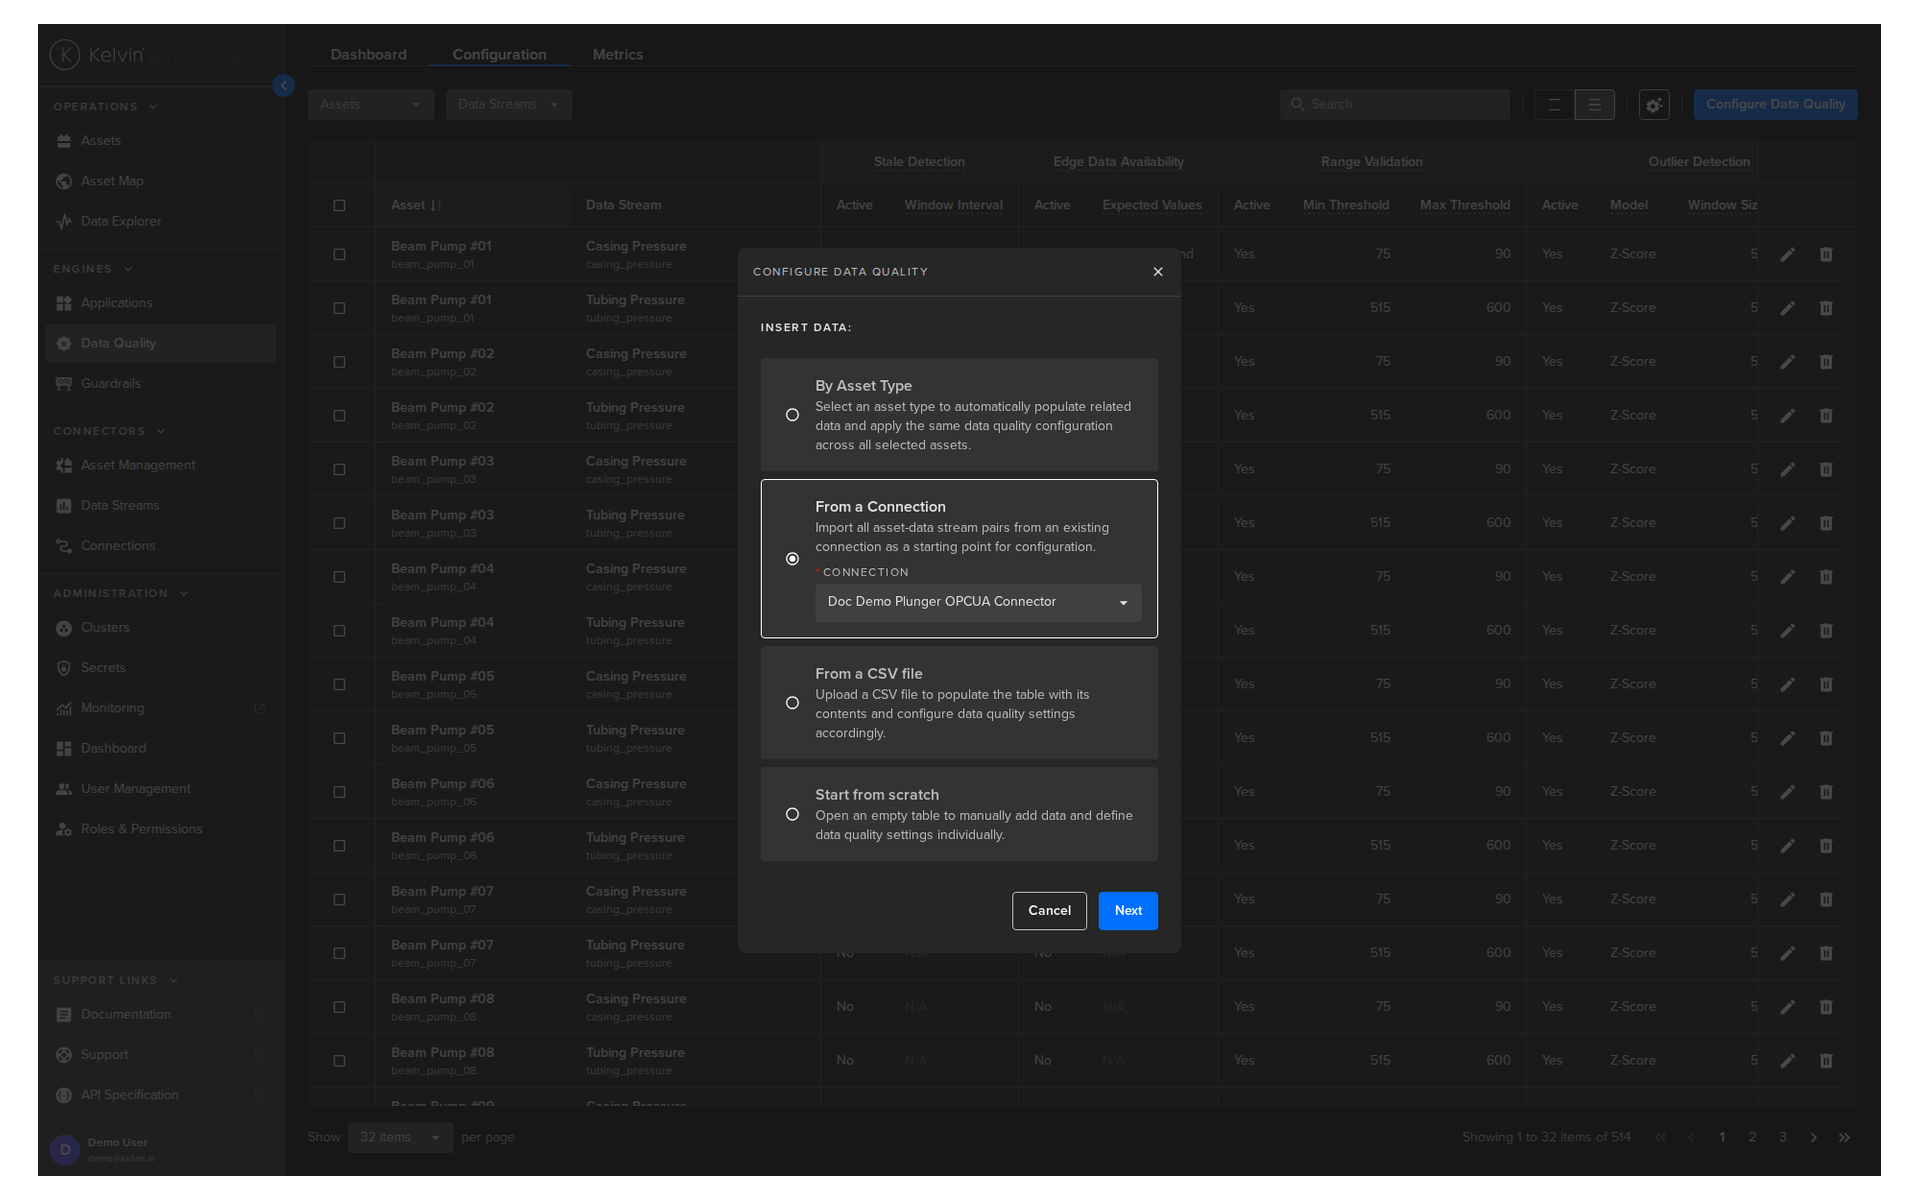
When ready click the Next button.
You will then see the Configure Data Quality screen where you can edit the metric settings for each Data Stream.
Note
Turn on Live Metrics from the switch in the top right corner to see all cells which need to be filled in.
Turn on Filter Errors to only see the rows that have metric errors.
From a CSV file
This option allows you to create a full list as a CSV file using Google Sheets or Microsoft Excel and upload it to the Kelvin Platform.
Note
This is the optimal solution when you are inserting a large number of Asset / Data Stream pair metrics.
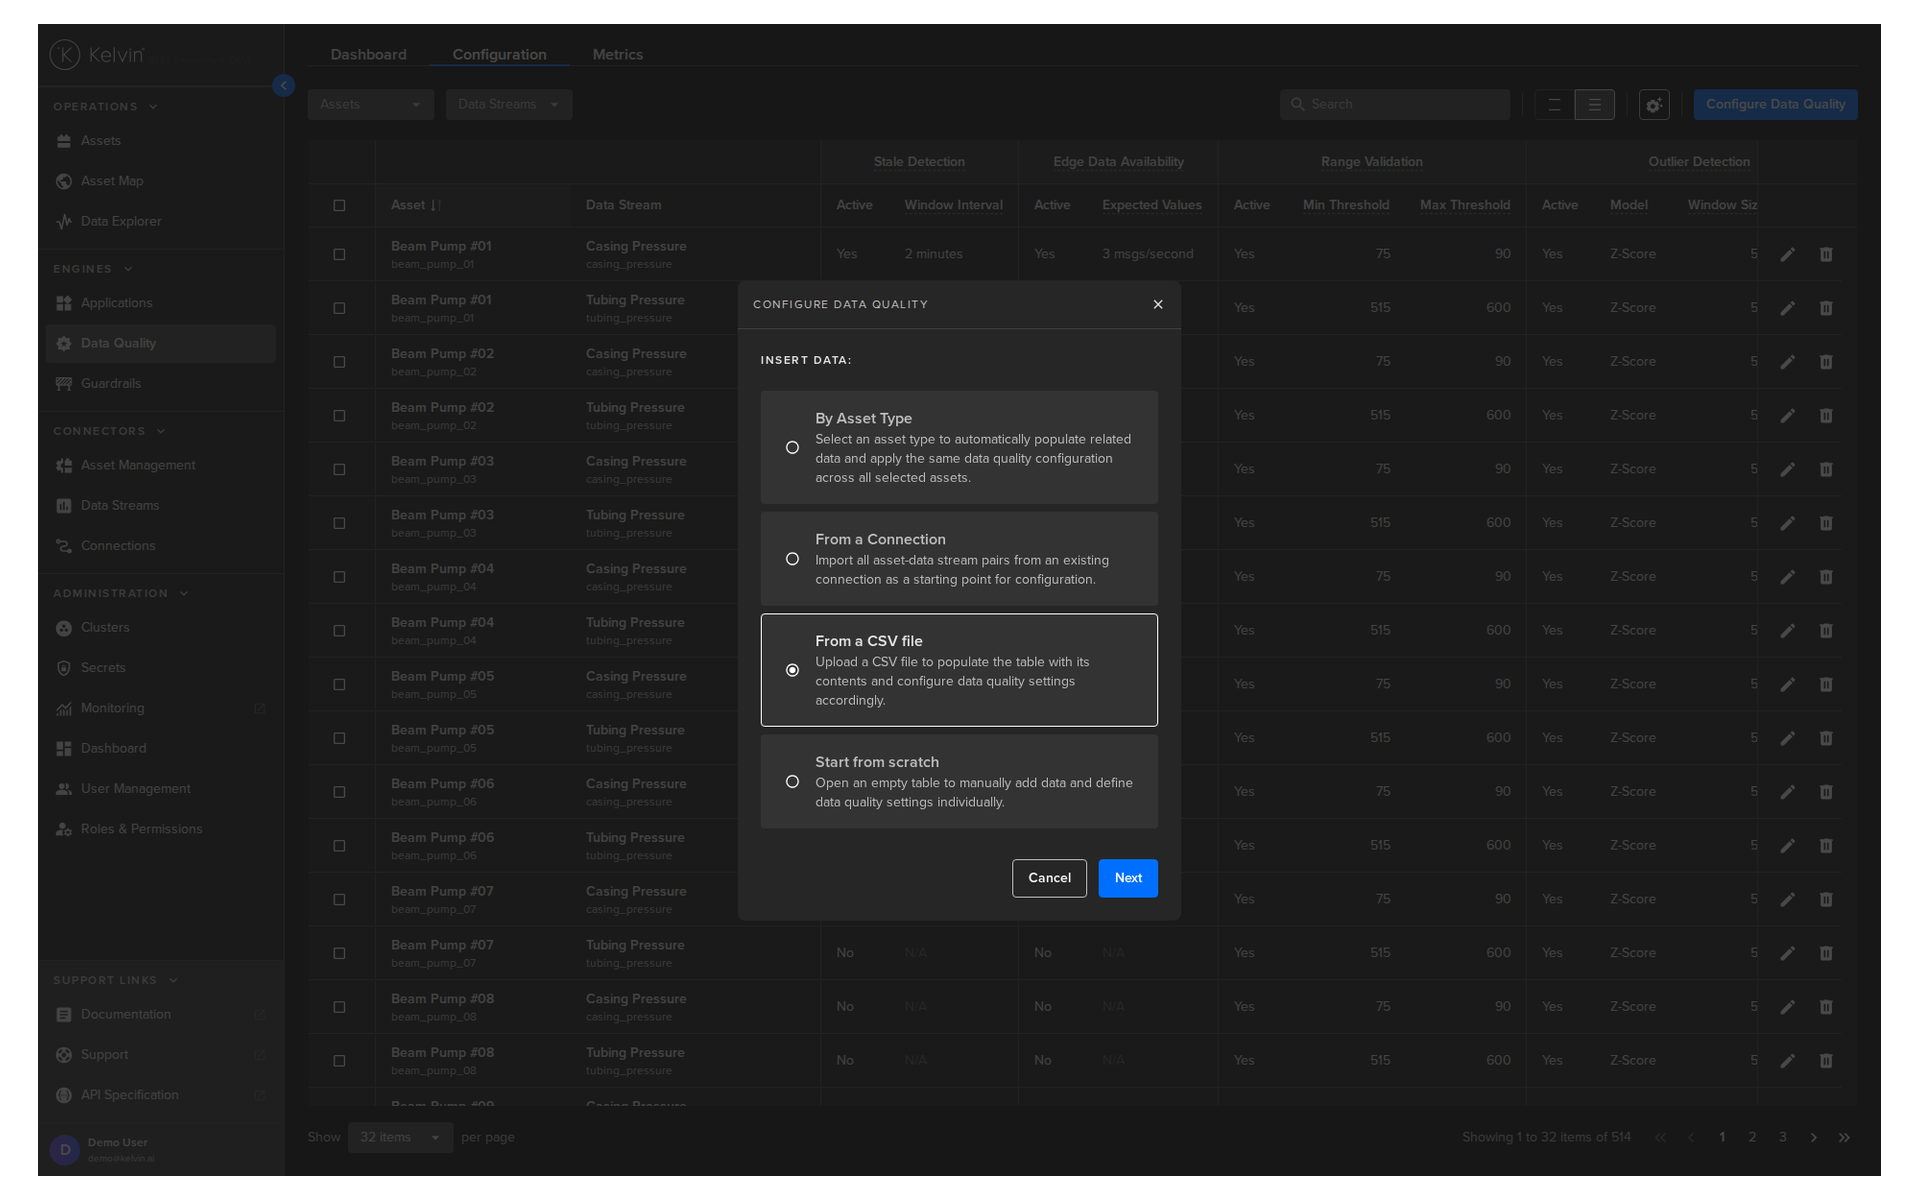
When you click next, you will then be asked to upload the CSV file.
Note
You will also have the option to download a sample template.
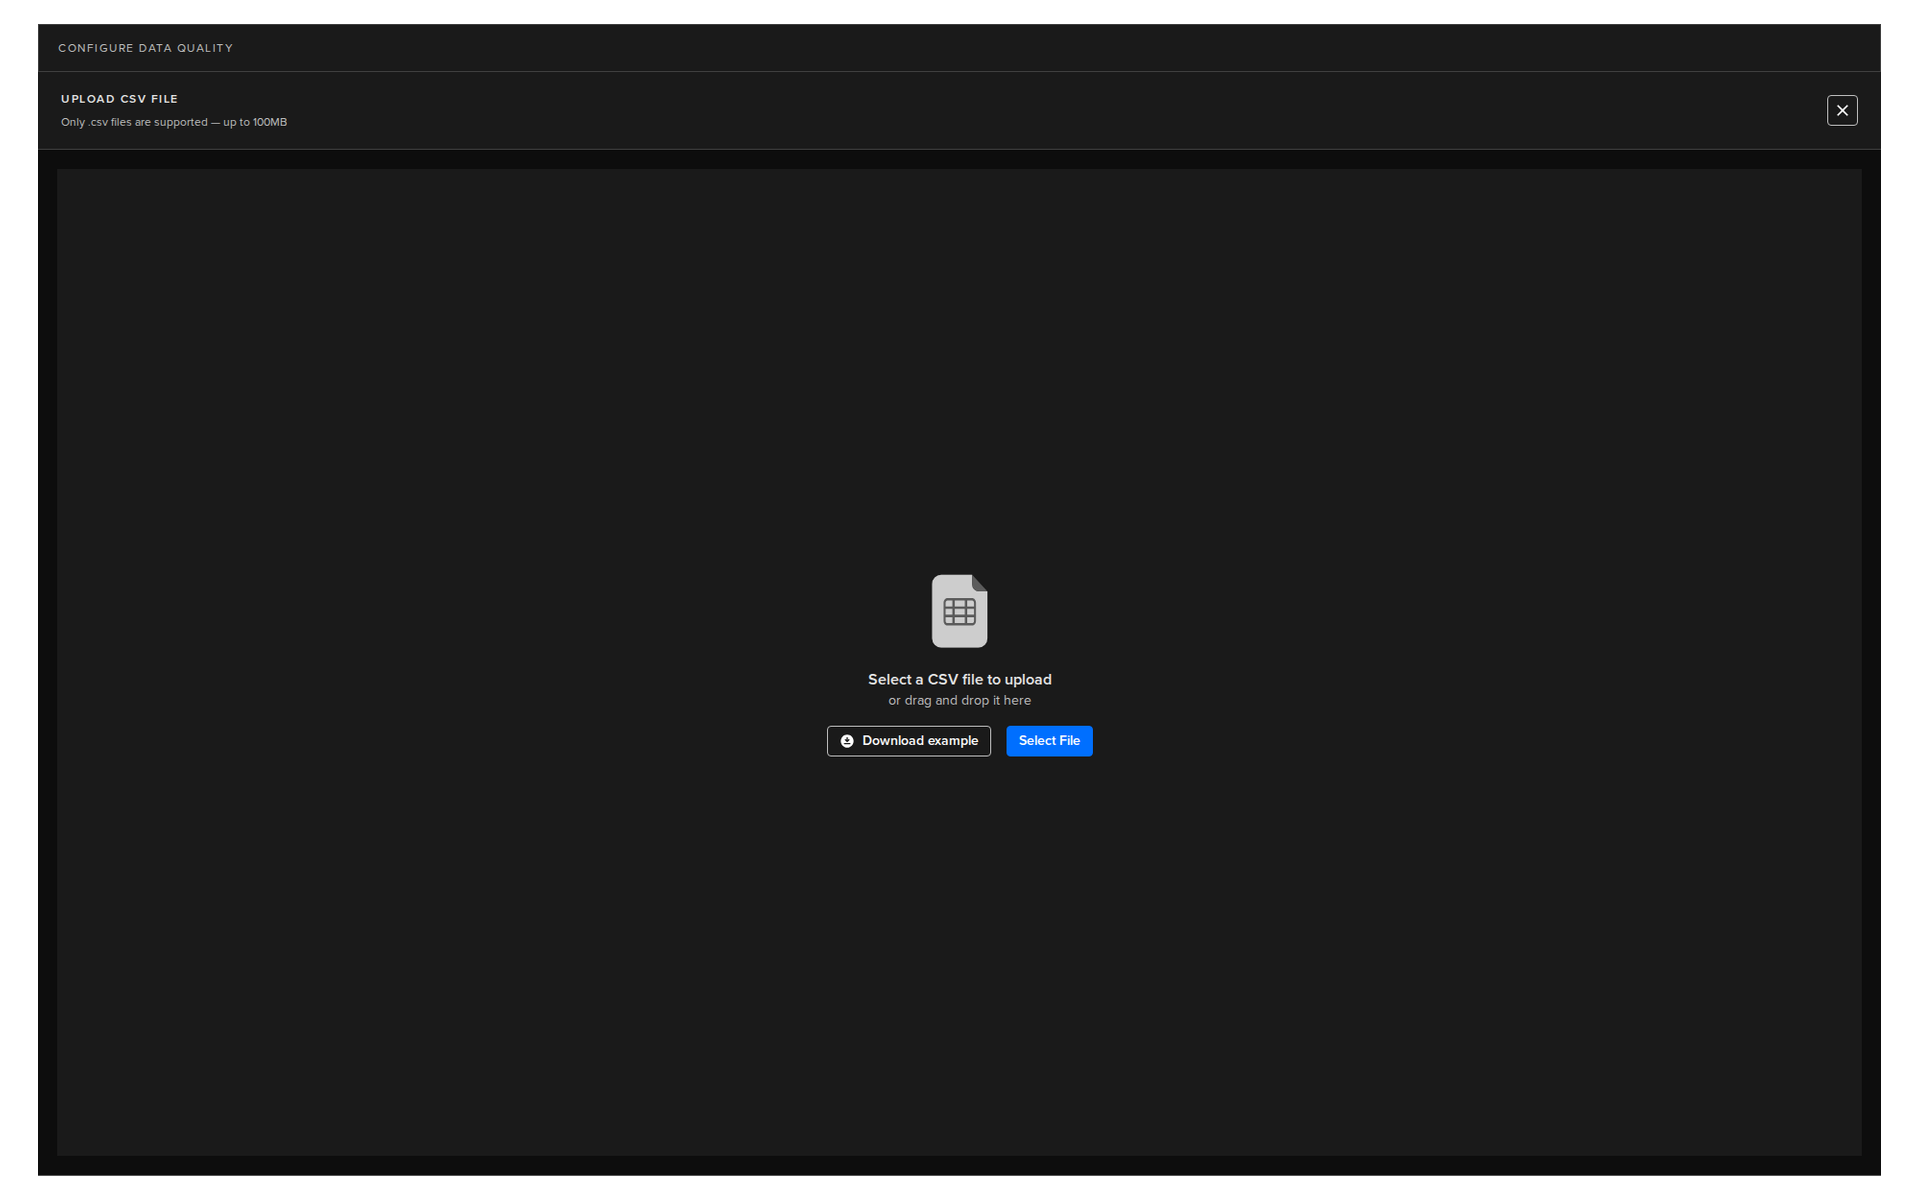
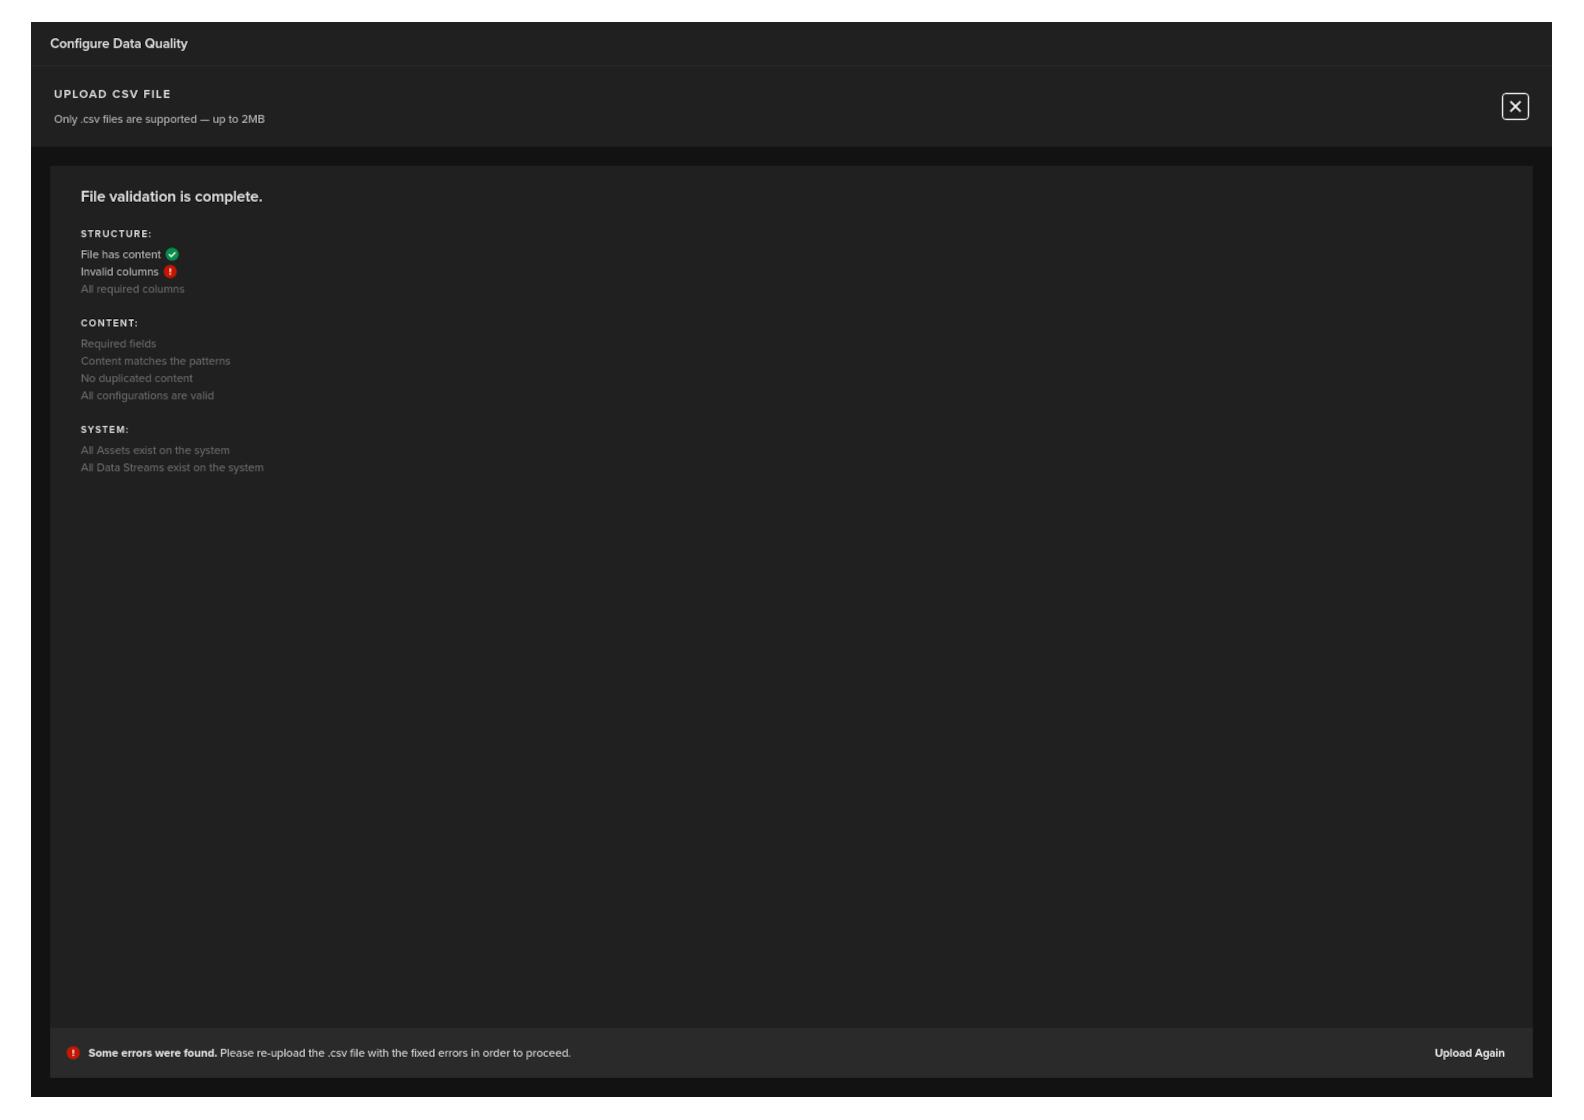
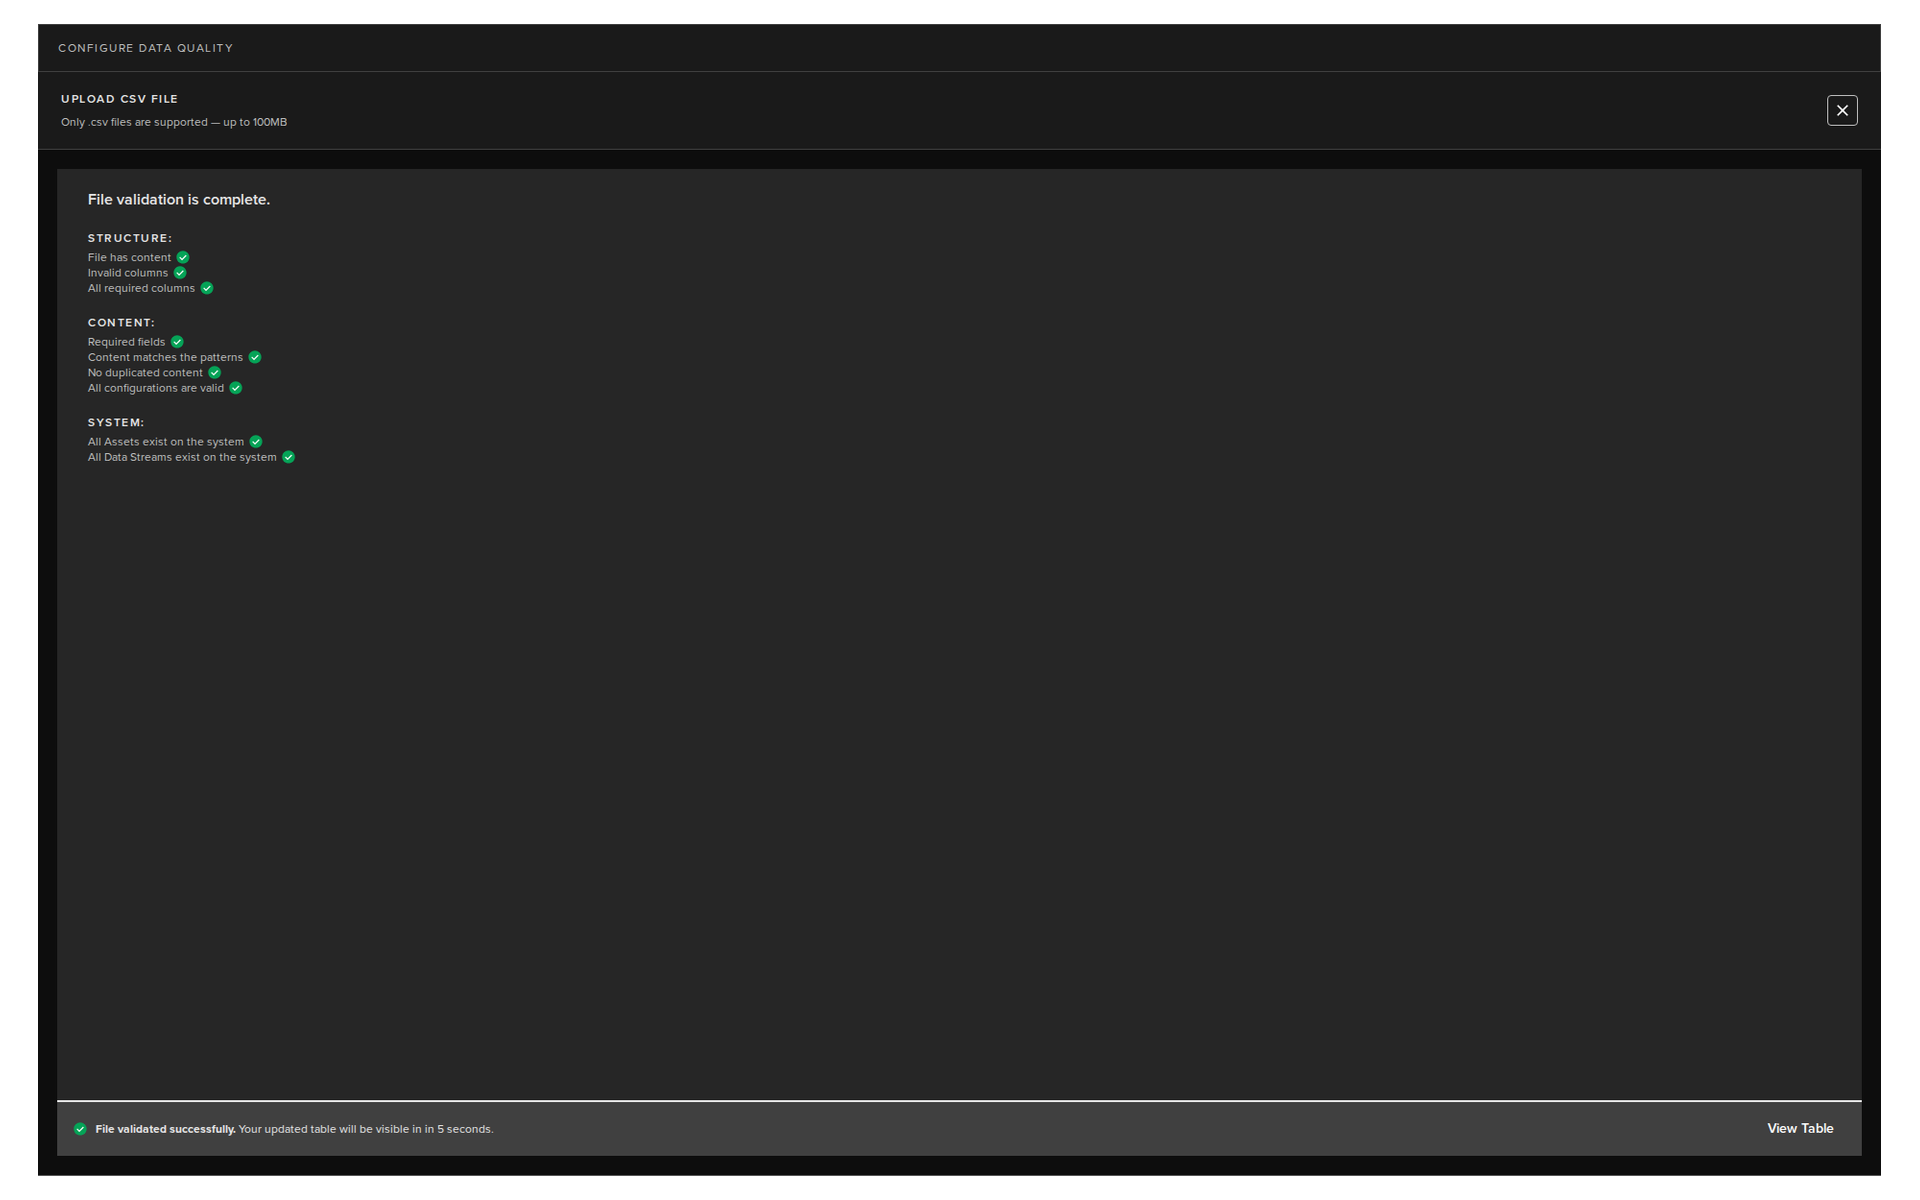
After uploading the file will be validated.
When ready click the Next button.
You will then see the Configure Data Quality screen where you can edit the metric settings for each Asset / Data Stream pair.
Note
If there are any errors in the CSV file, then this screen will automatically have the Show All Errors option turned on to highlight all the errors in the table.
Turn on Filter Errors to only see the rows that have metric errors.
Start from scratch
This option allows you to start with a blank page and you can add the Asset / Data Stream pairs manually.
Note
Turn on Live Metrics from the switch in the top right corner to see all cells which need to be filled in.
Turn on Filter Errors to only see the rows that have metric errors.
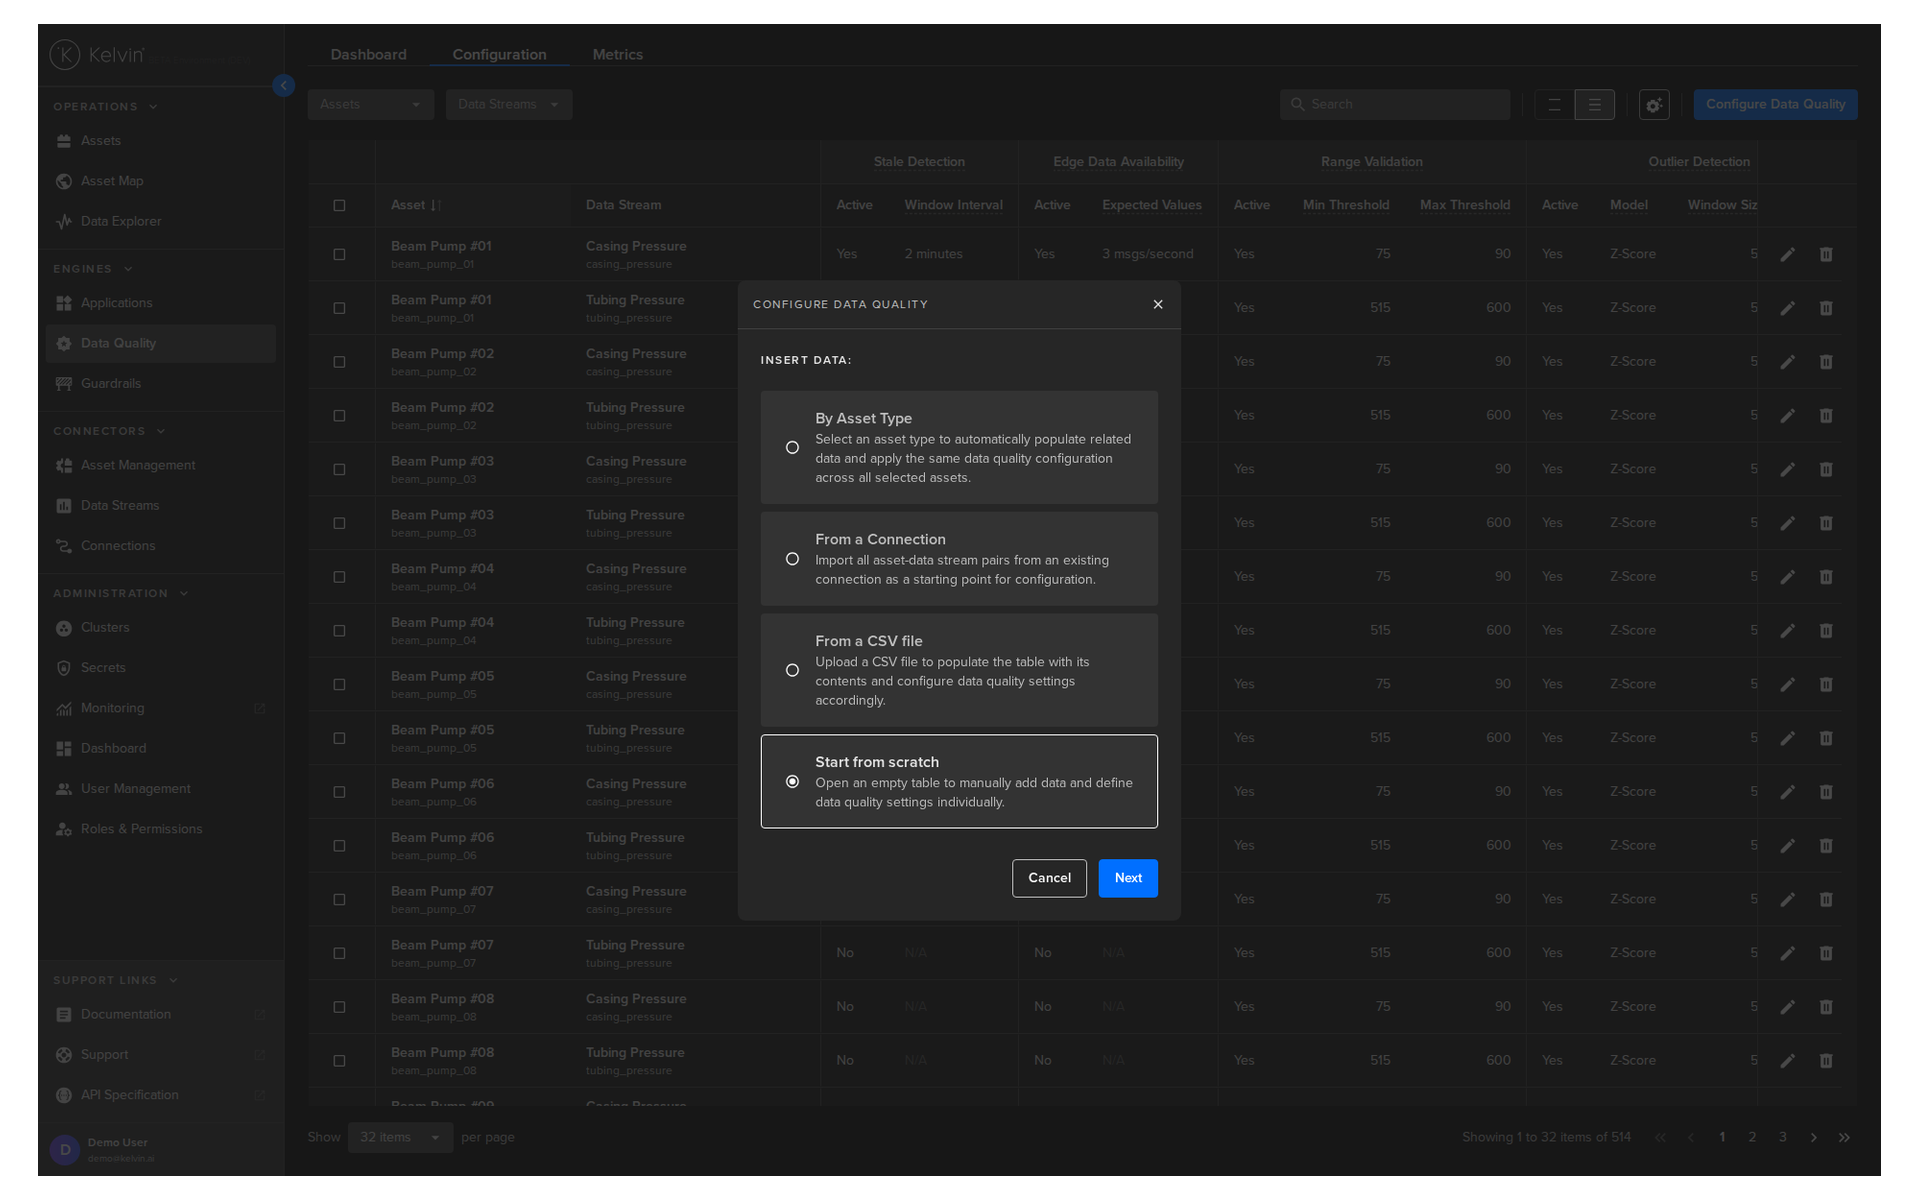
When ready click the Next button.
You will then see the Configure Data Quality screen where you can add Asset / Data Stream pairs and edit the metric settings.
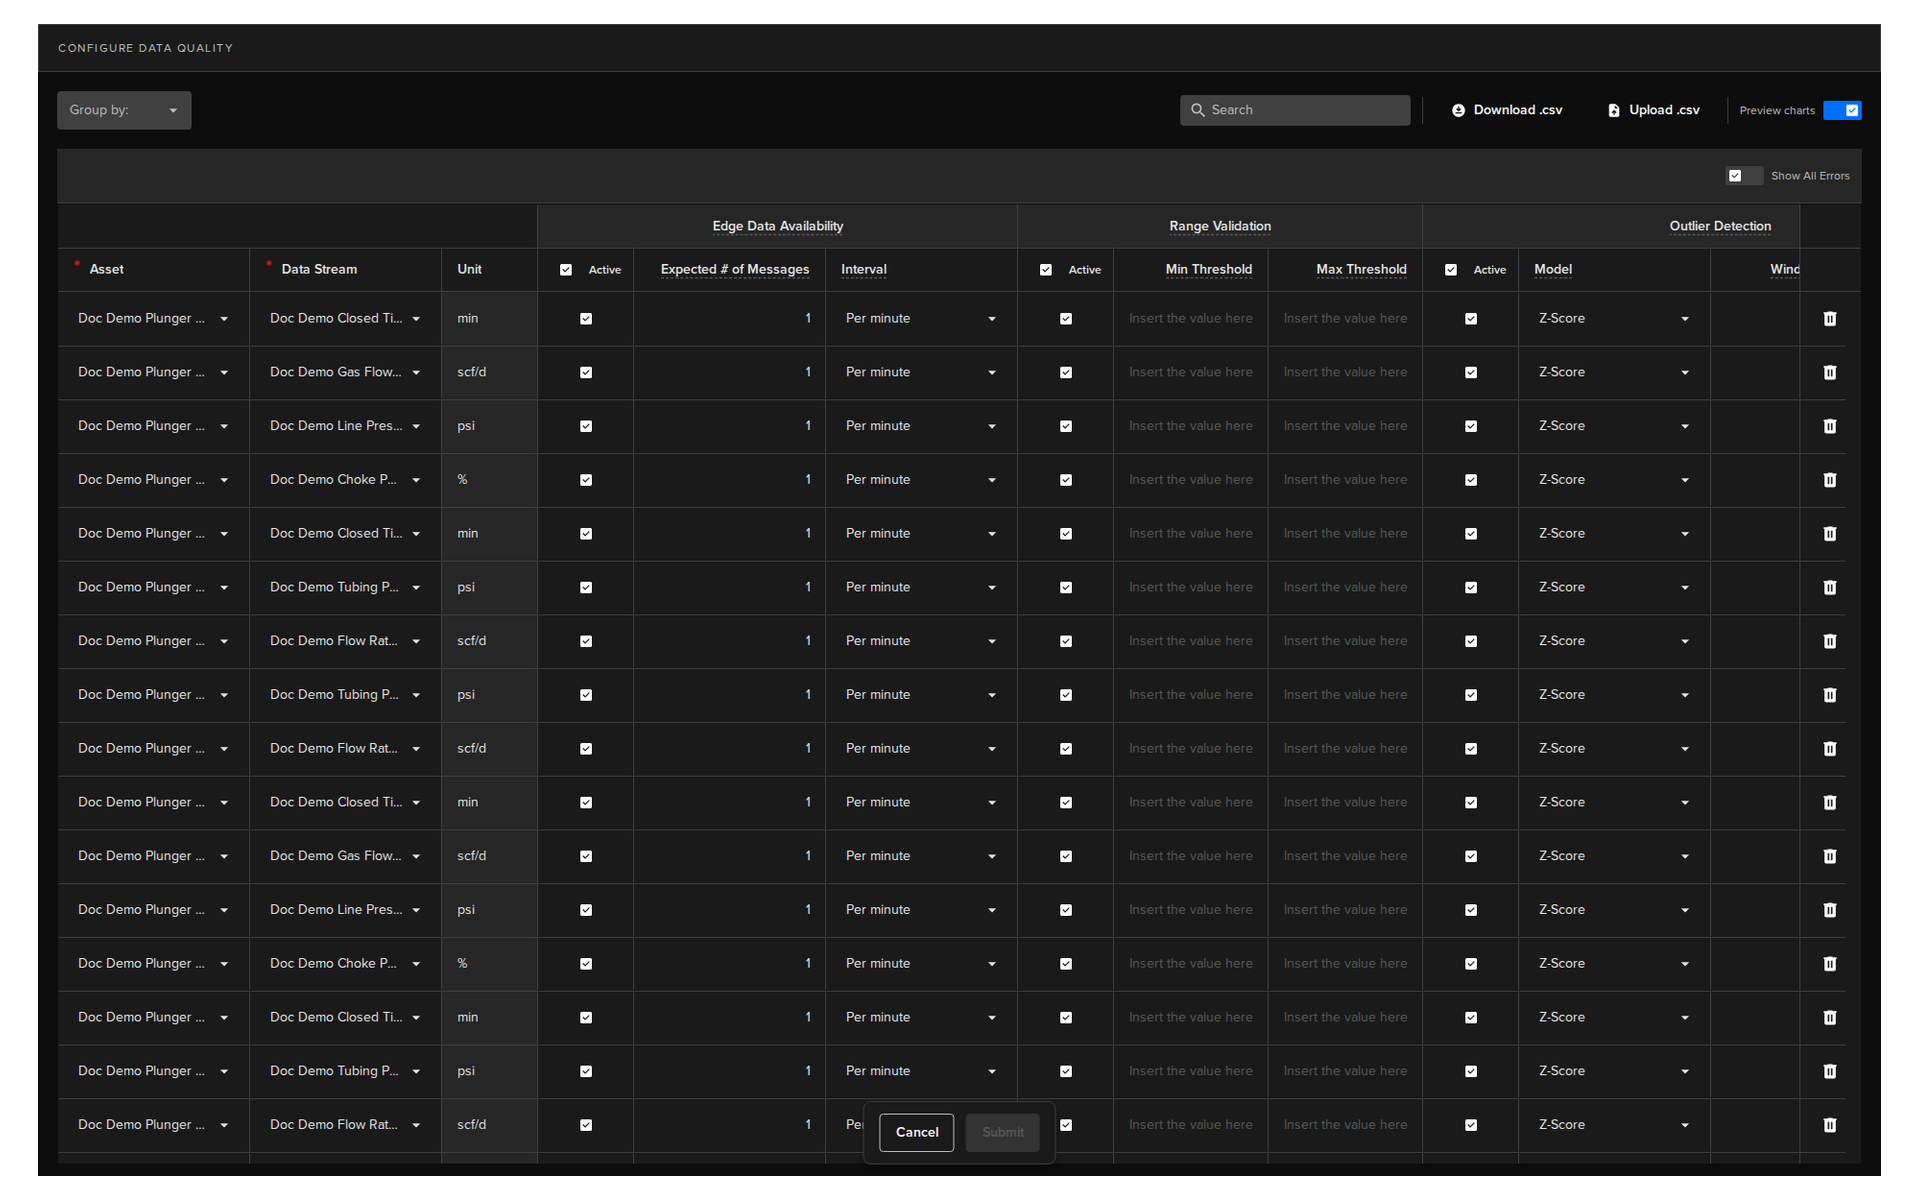
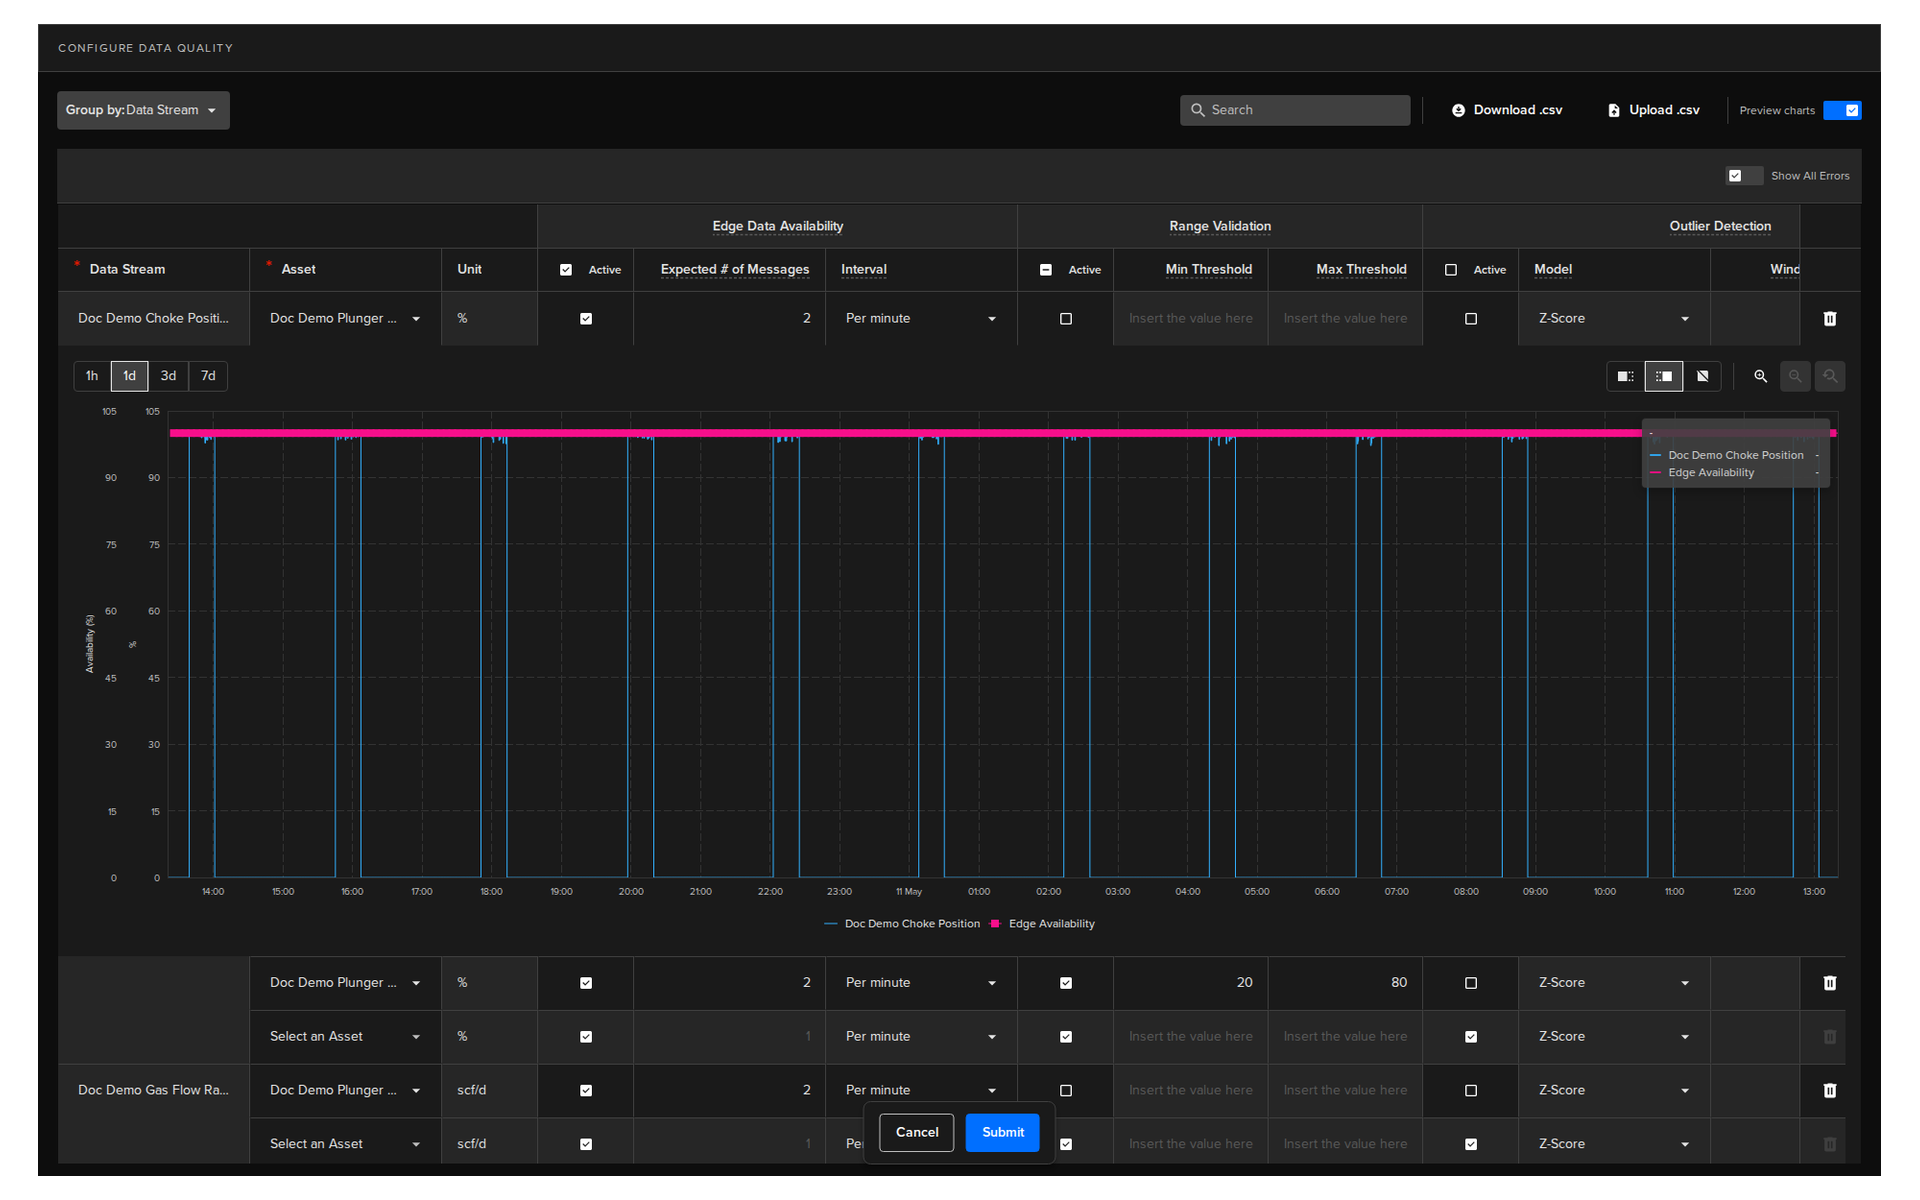
Group By
If you have either multiple Assets or multiple Data Streams that are the same, then a dropdown option will appear on the top.
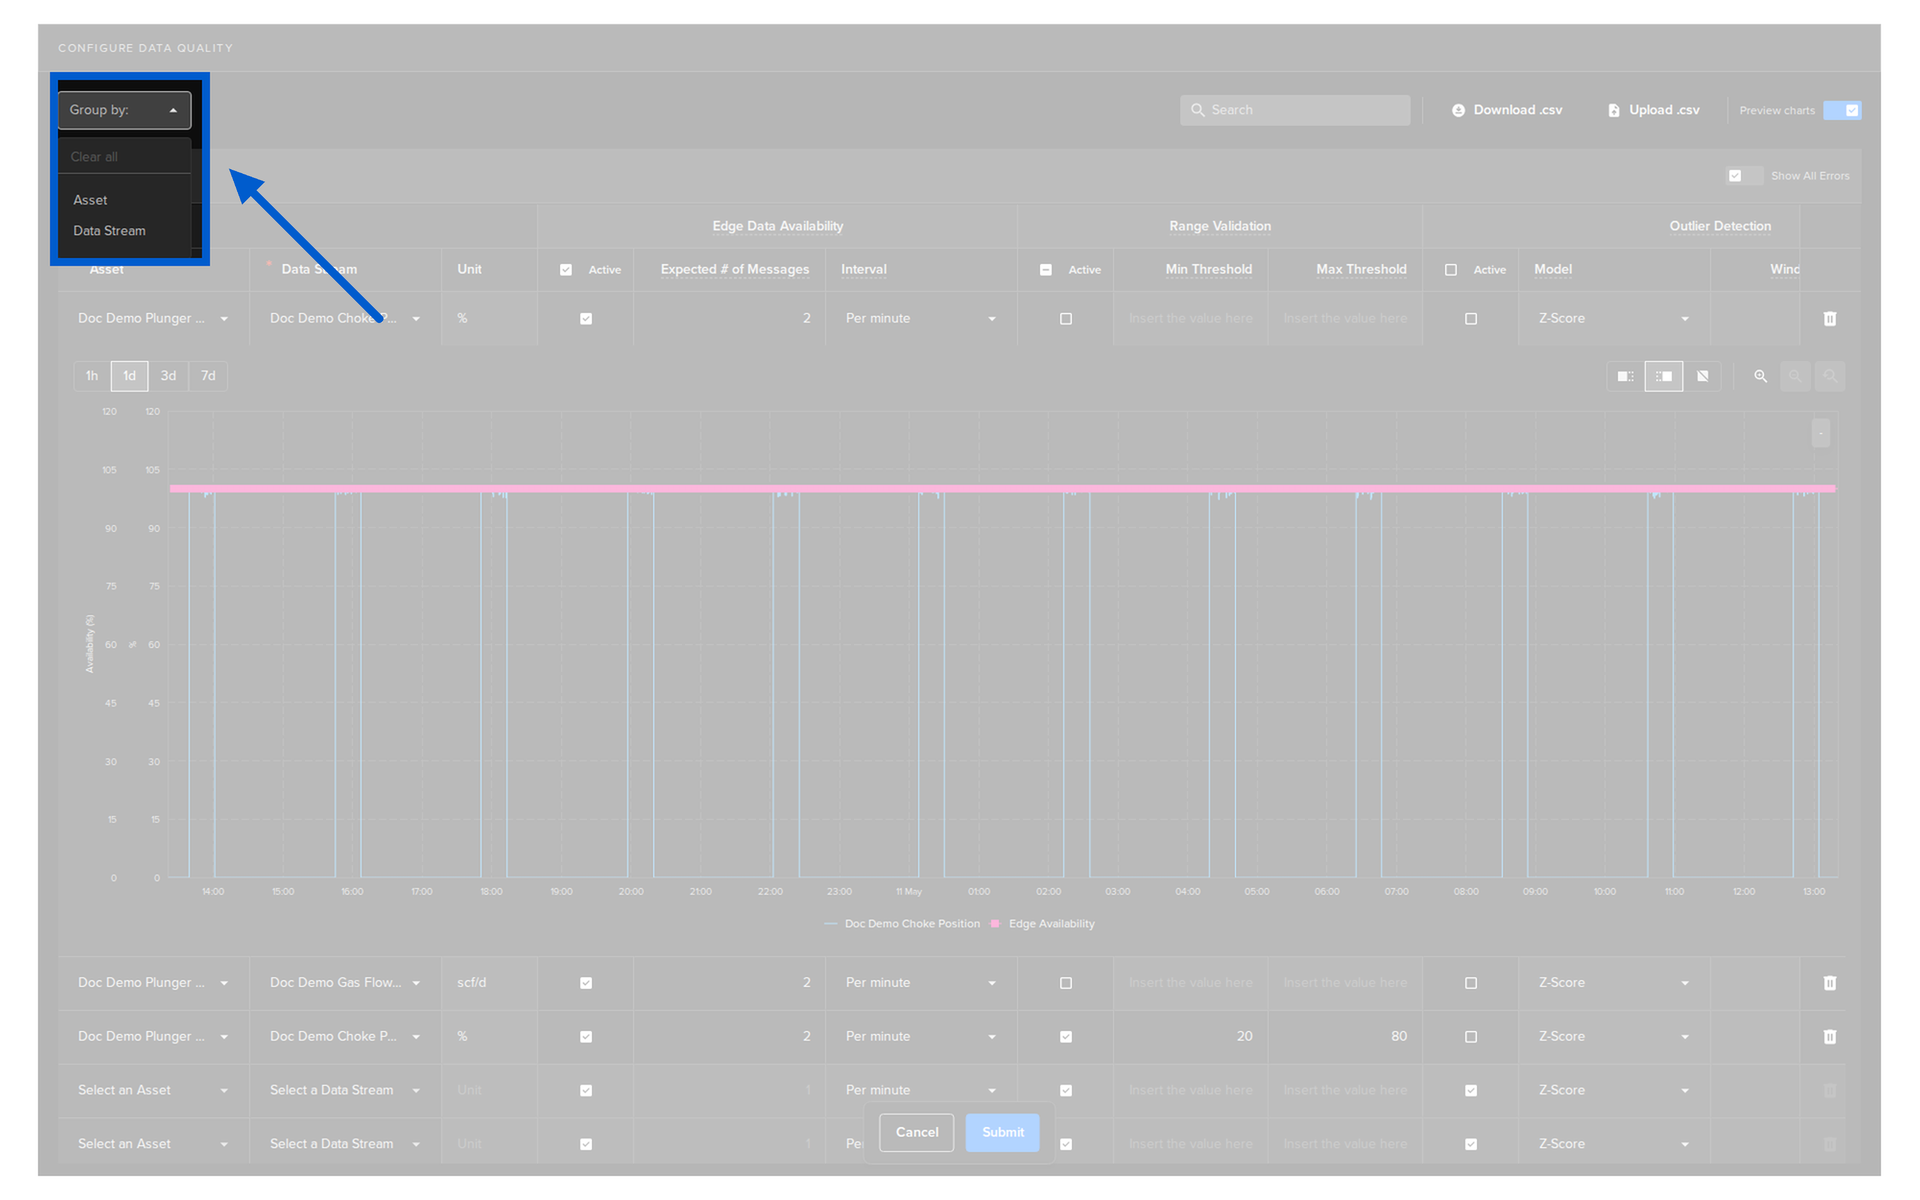
And select whether to group by Assets or Data Streams.
Success
This speeds up the process by only needing to select the wanted items on multiple rows in a group.
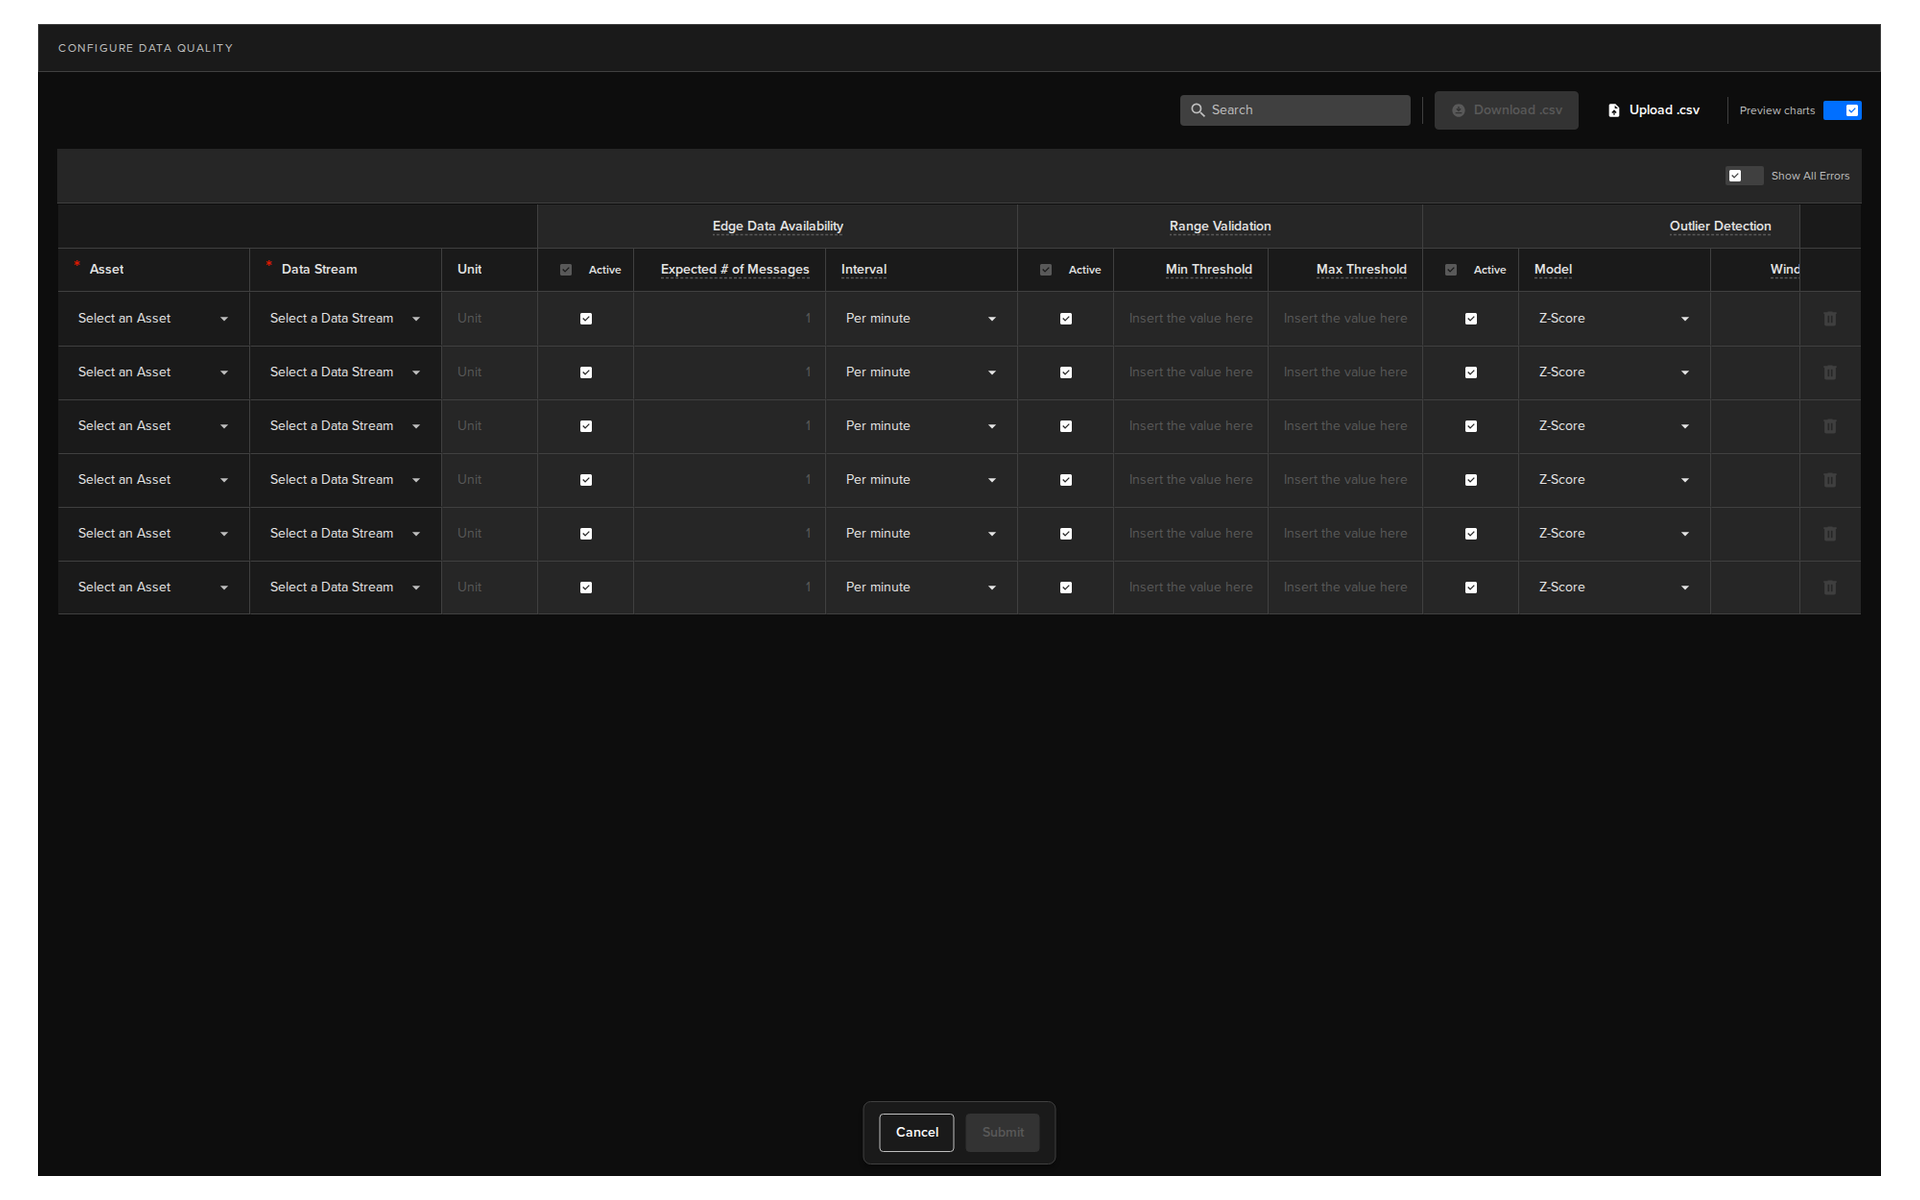
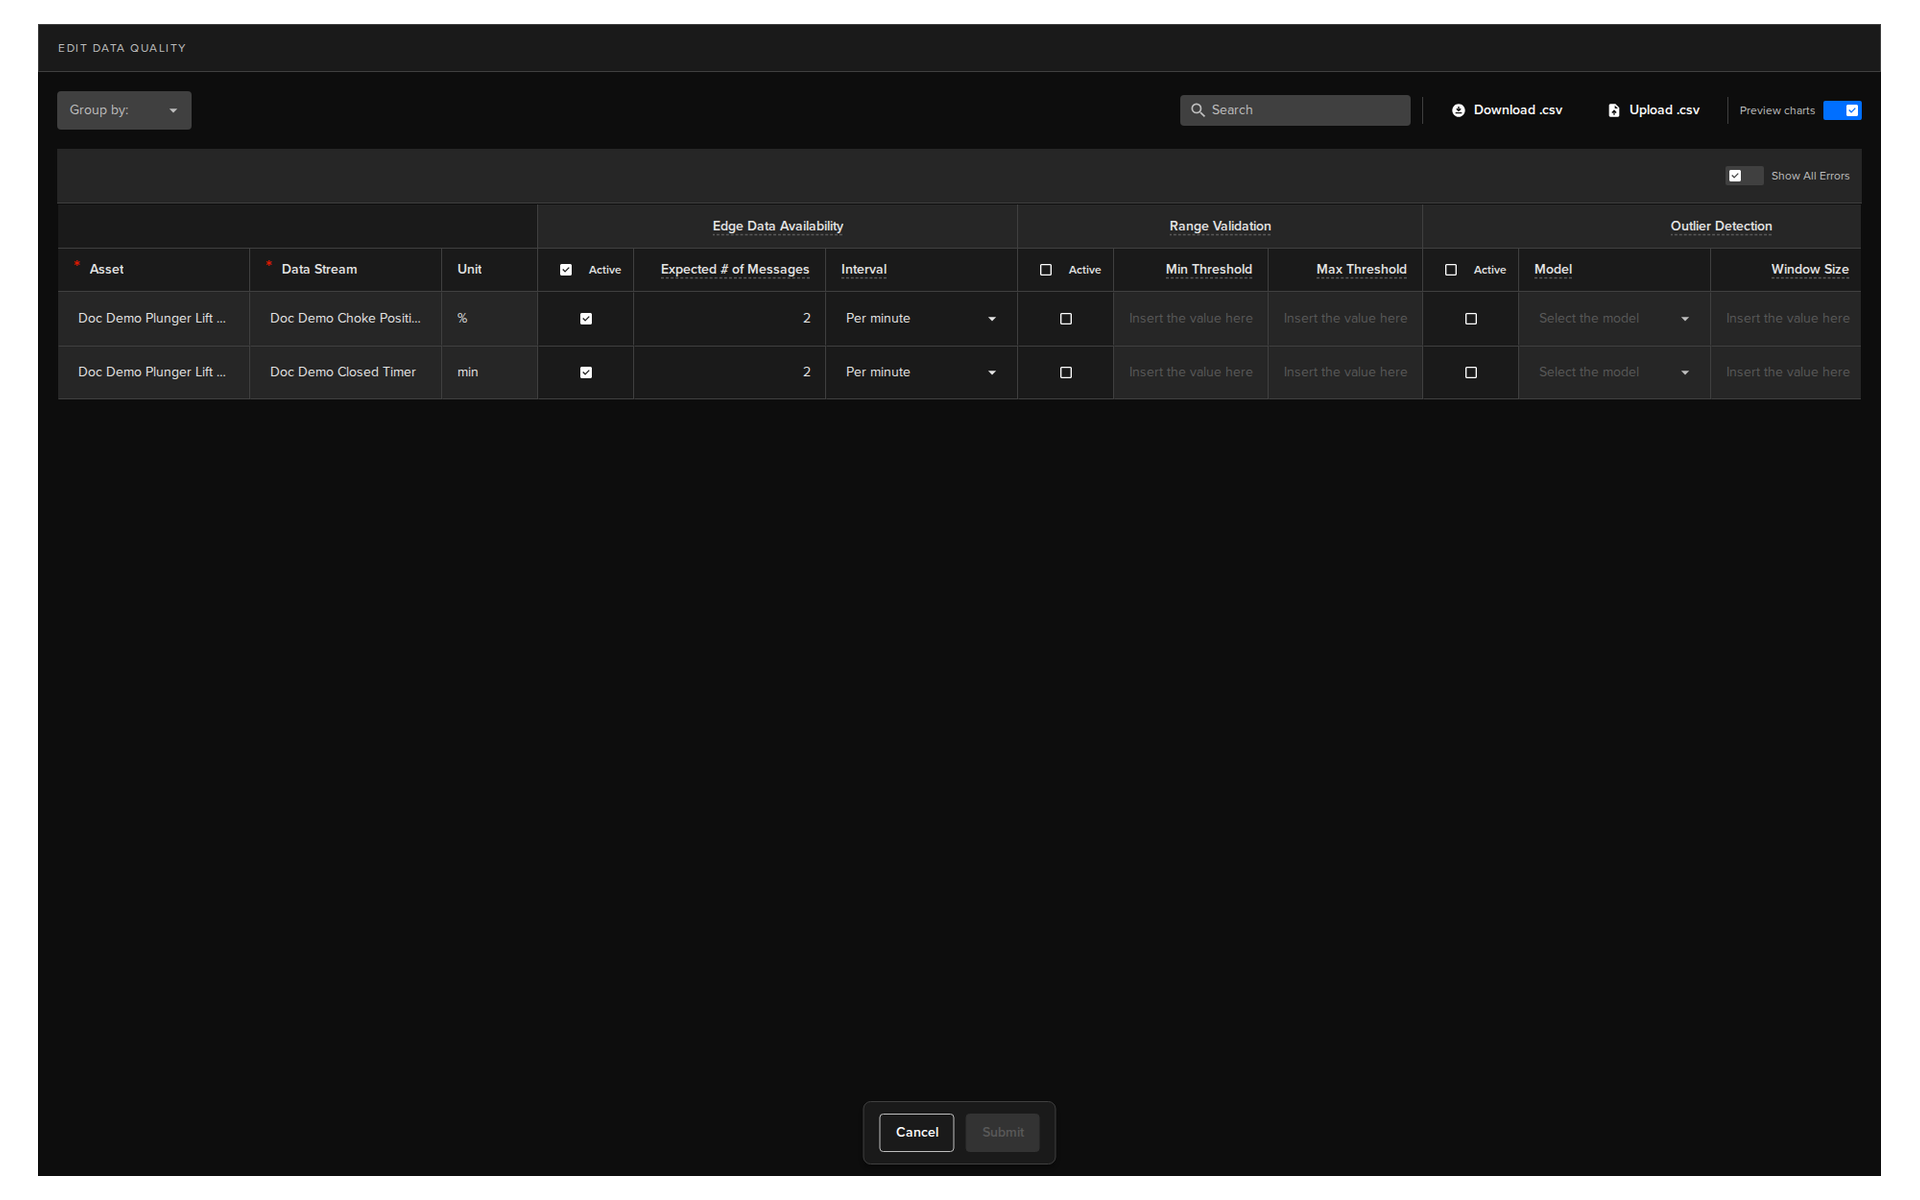
Configure Data Quality
This screen may look slightly different depending on how you selected your Assets.
Note
Details of how the Configure Data Quality screen will look is explained above in the Select Assets chapter.
Here we will show you the common features.
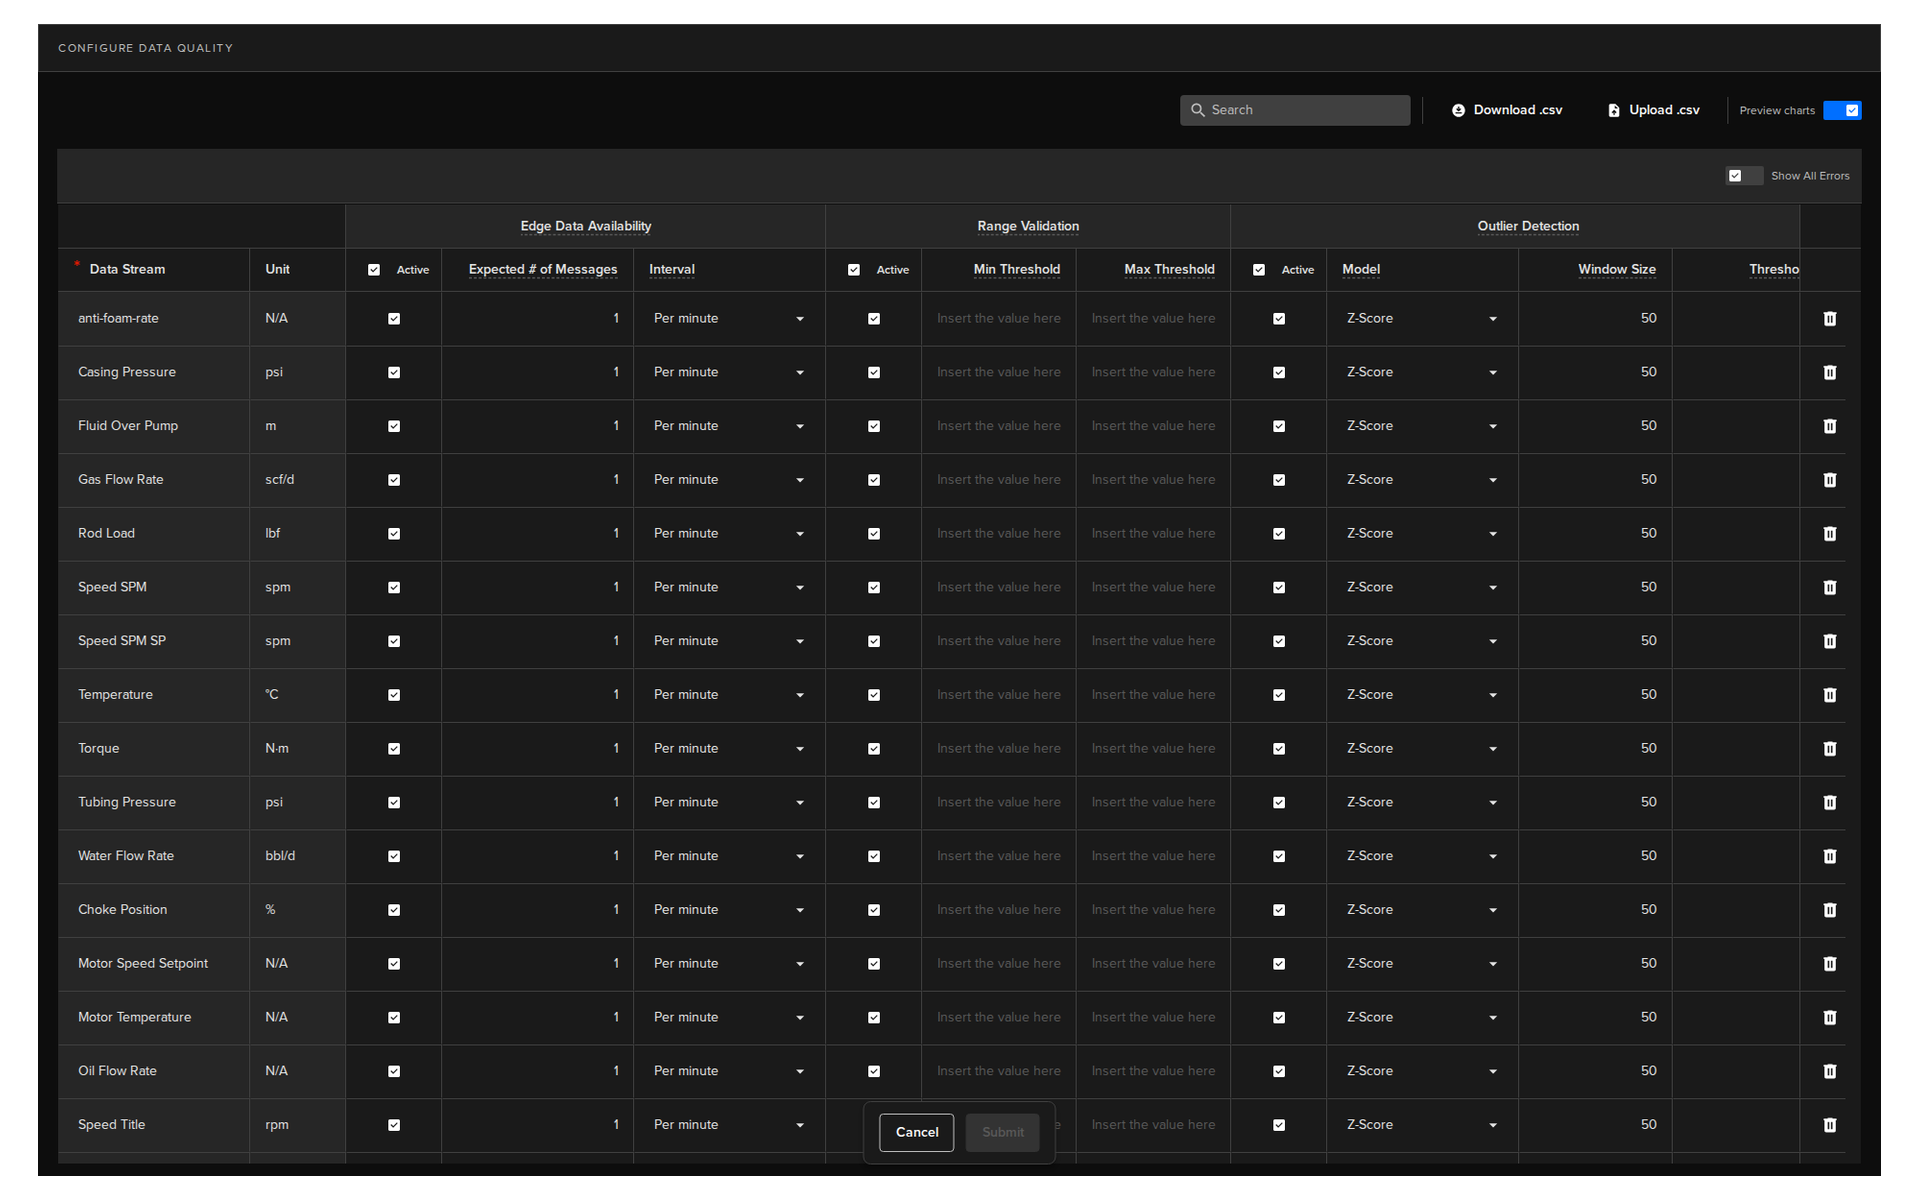
Metrics
For each row you can setup the settings for each Data Metric algorithm.
| Header | Sub Header | Description |
|---|---|---|
| Edge Data Availability | Active | Enable or disable this Data Quality metric algorithm. |
| Expected # of Messages | Number of data messages expected from the Asset. | |
| Interval | Time window used to count the messages. | |
| Range Validation | Active | Enable or disable this Data Quality metric algorithm. |
| Min Threshold | Minimum allowed value for incoming data. | |
| Max Threshold | Maximum allowed value for incoming data. | |
| Outlier Detection | Active | Enable or disable this Data Quality metric algorithm. |
| Model | The outlier detection model used. Currently supports only the Z-Score model. | |
| Window Size | Number of samples used to calculate the Z-Score. | |
| Threshold | Deviation limit used to flag outliers. | |
| Duplication Detection | Active | Enable or disable this Data Quality metric algorithm. |
| Window Size | Number of recent messages checked for duplicates. | |
| Timestamp Anomaly Detection | Active | Enable or disable this Data Quality metric algorithm. |
| Allowed Deviation | Maximum time deviation allowed between consecutive messages. |
Search
CSV Files
You can download the current table as a file in a CSV format.
Warning
The current values in the table will be overwritten.
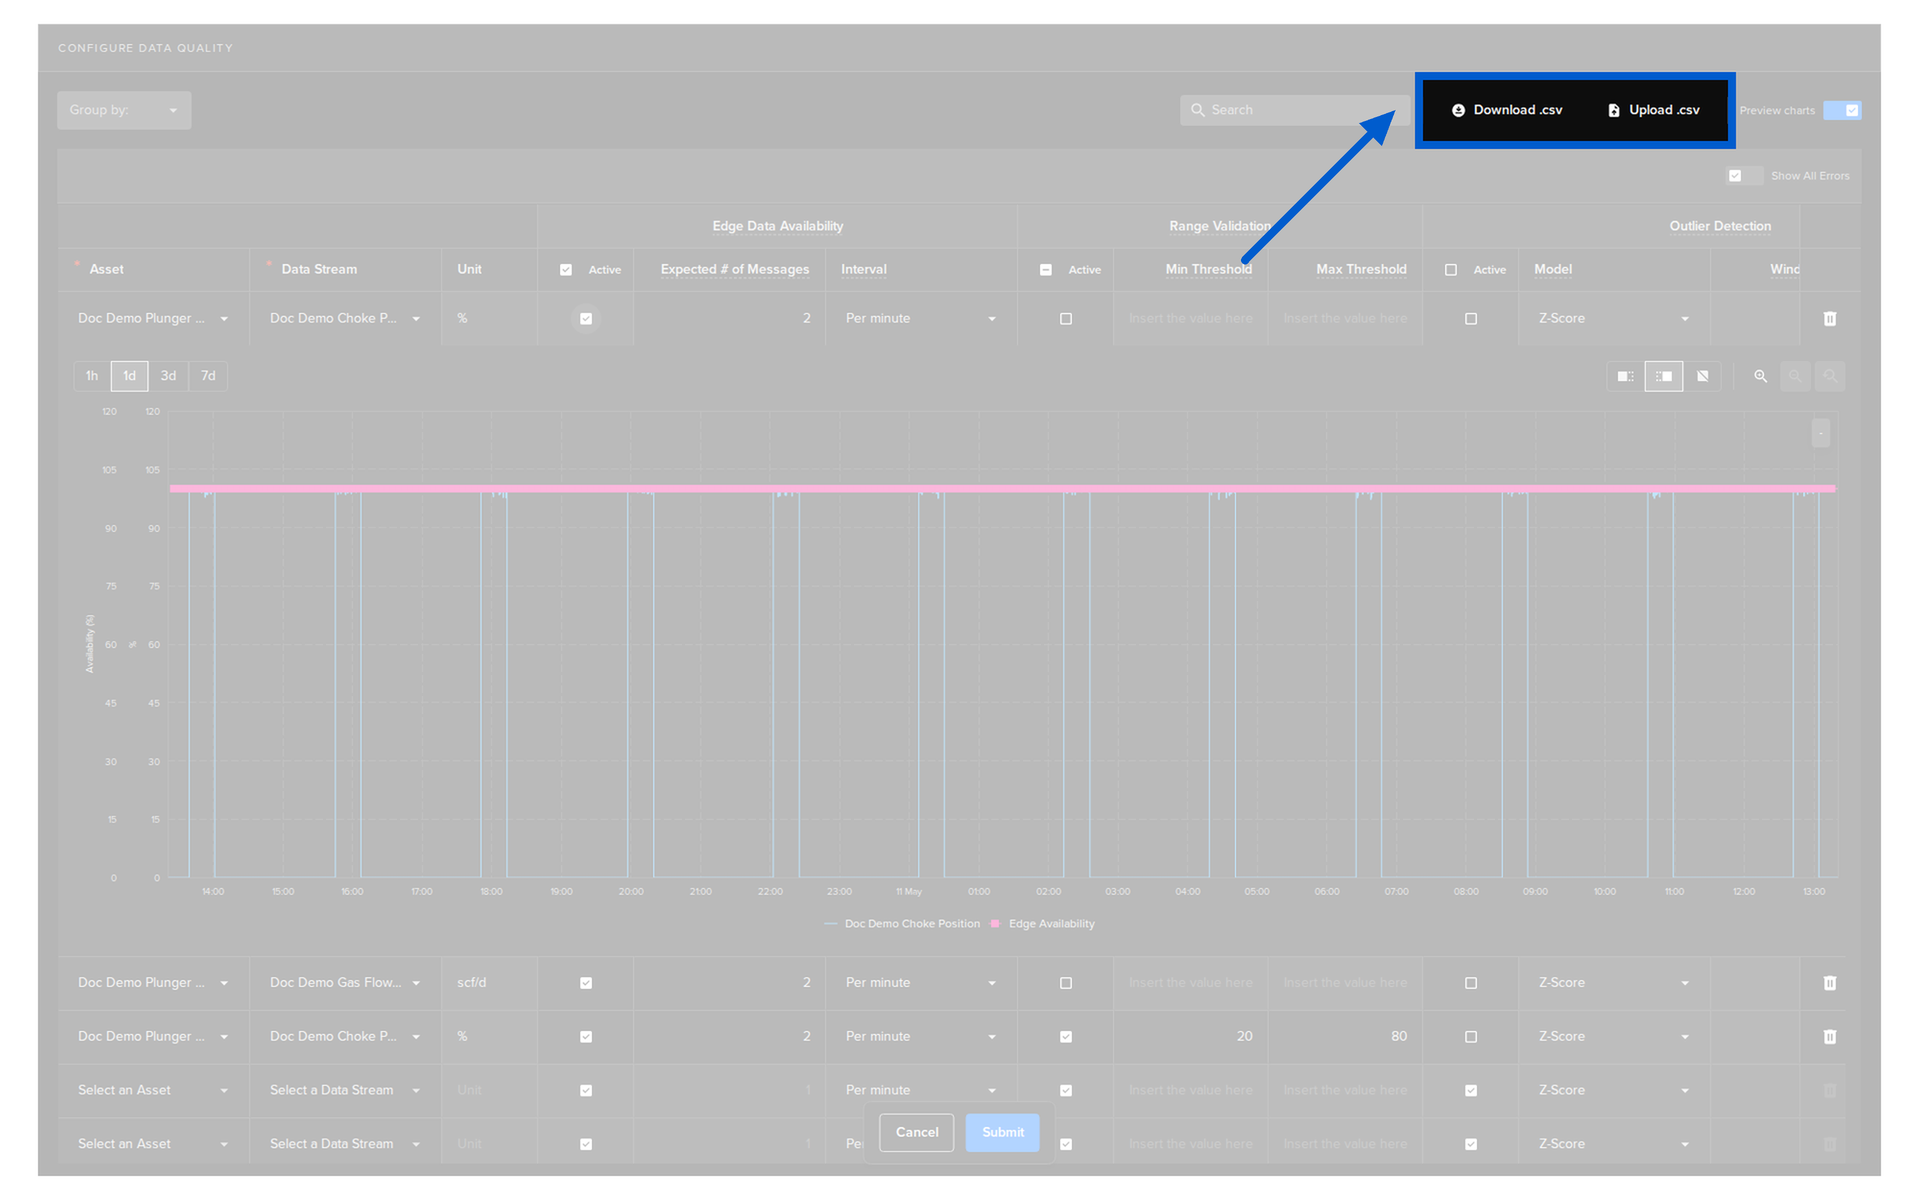
You can then edit all the Asset / Data Stream pairs and the associated Data Quality metric settings in your favorite spreadsheet editor such as Google Sheets or Microsoft Excel.
When finished you can upload it back into the table. While uploading, Kelvin will validate the file for errors in the CSV file format before processing.
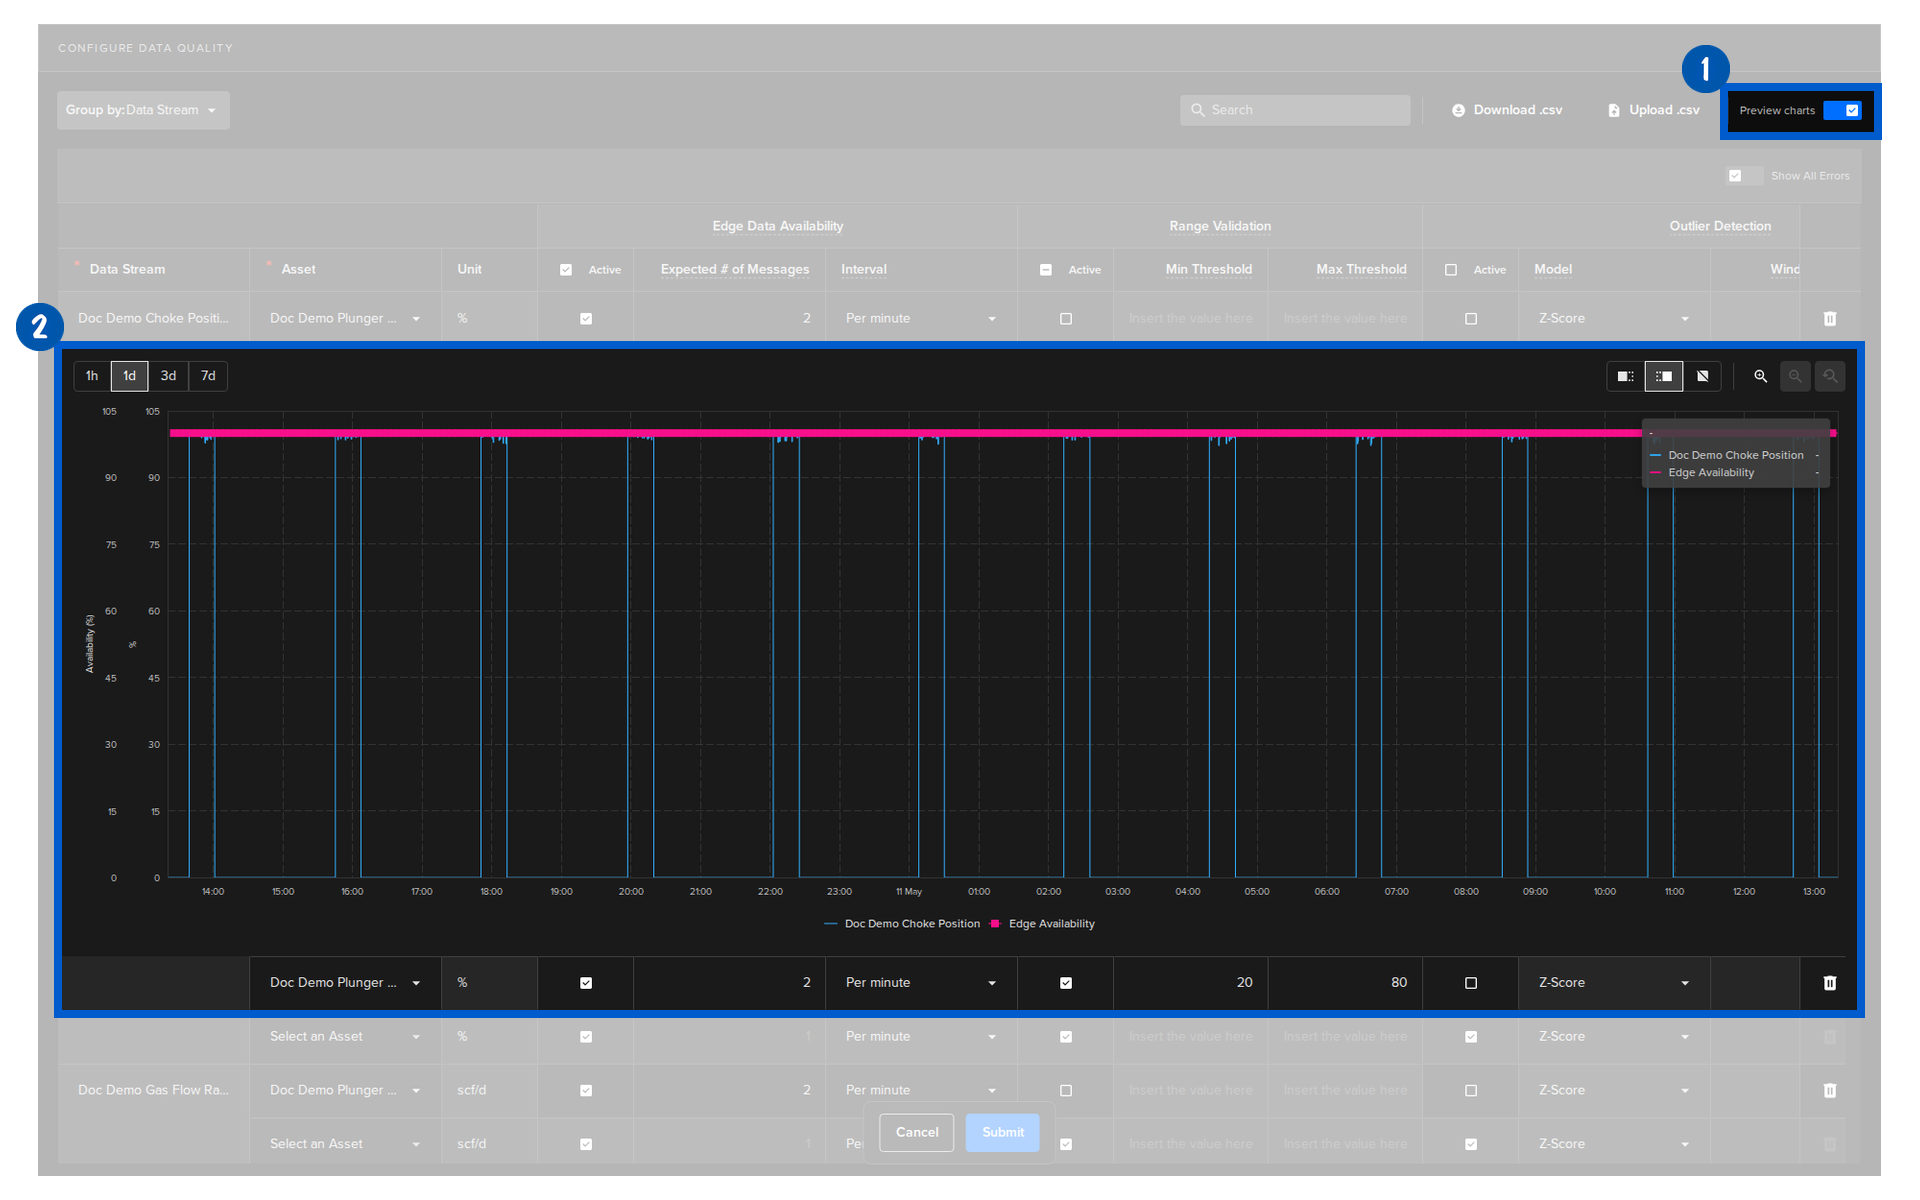
Preview Charts
When Preview Charts toggle is on then when you click on a setting the preview will appear below the relevant Asset / Data Stream row.
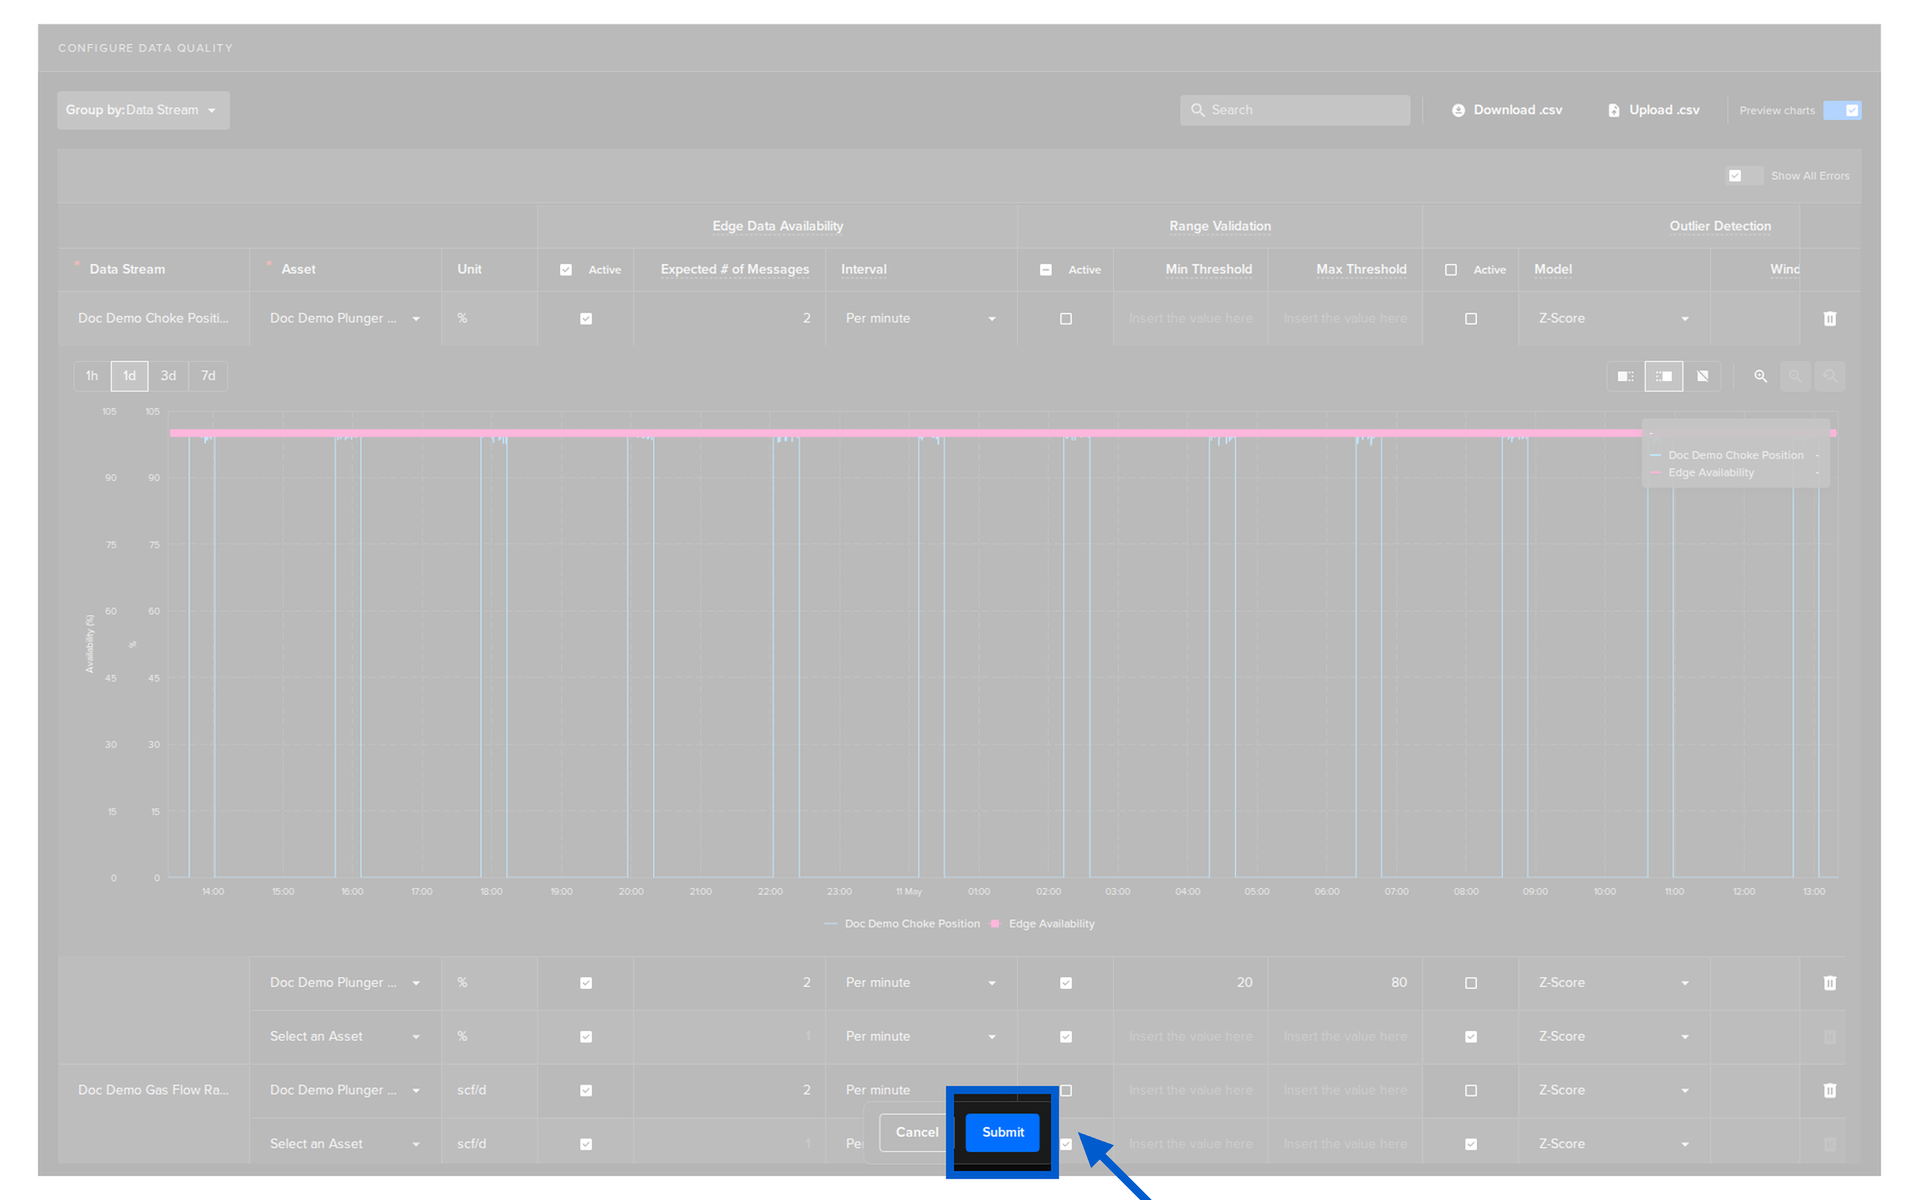
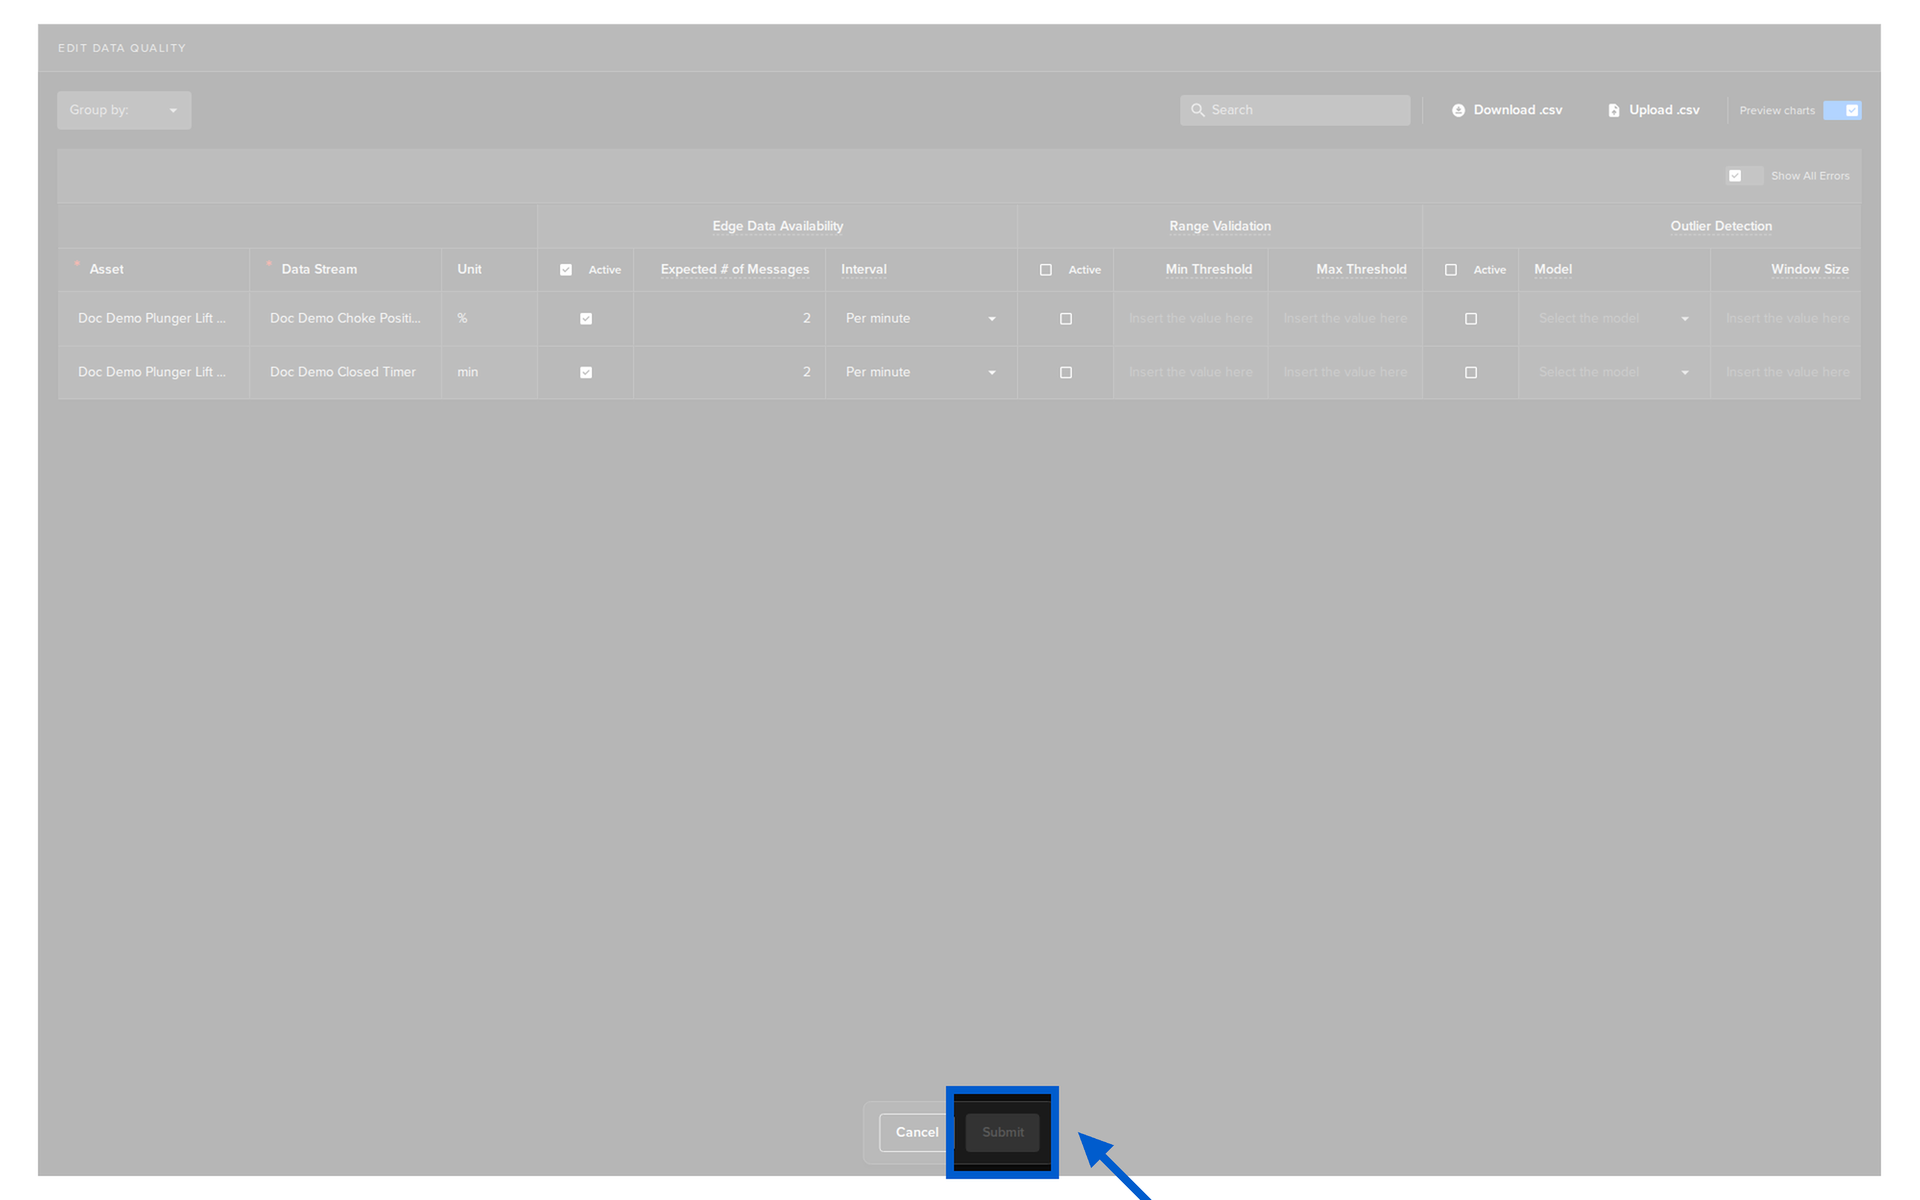
Submit
When ready, click on the Submit button.
Data Quality will immediately start monitoring the new Asset / Data stream pairs and they will be added to the Data Quality Dashboard.
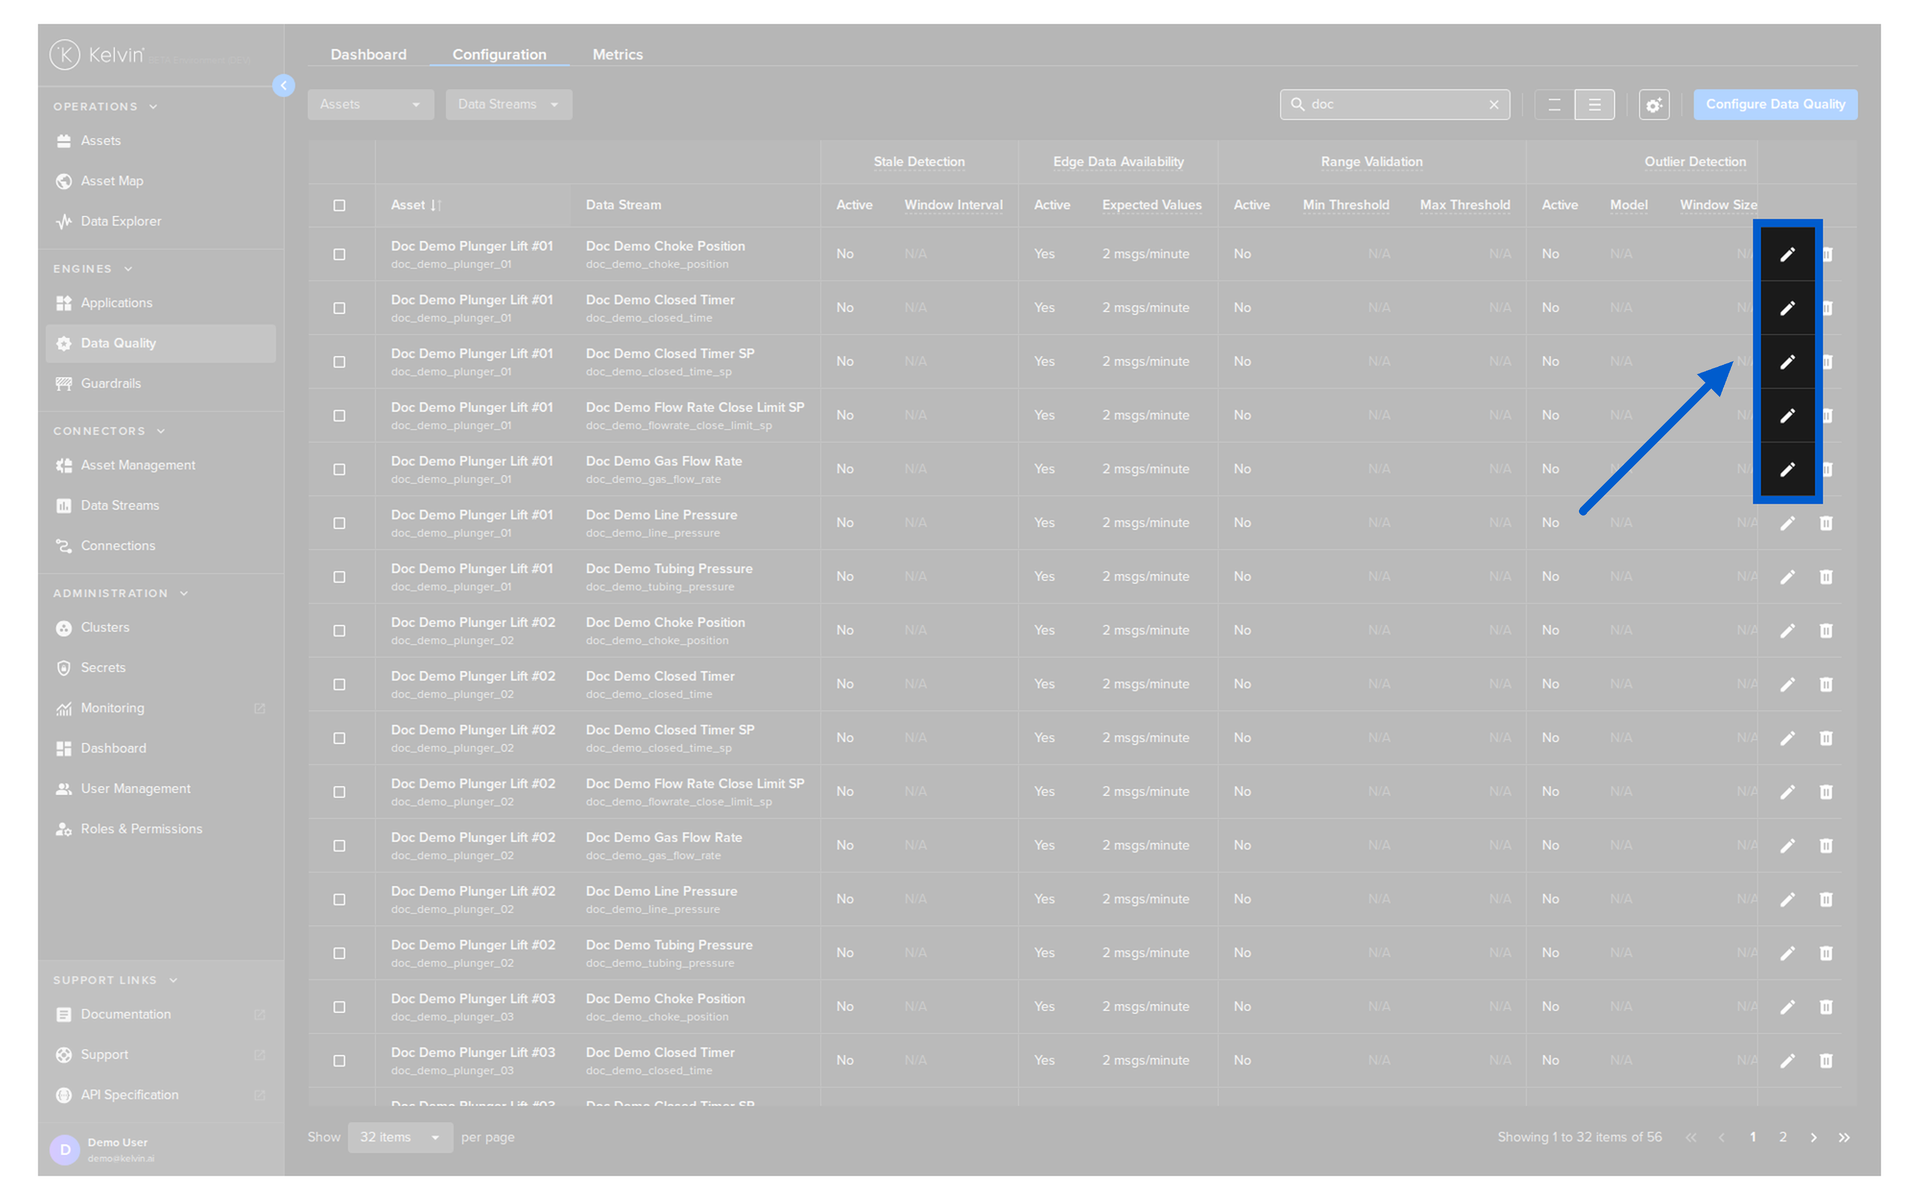
Edit Configurations
You can edit individual metric settings for Asset / Data Stream Pairs.
To start either click on the edit icon ![]() .
.
Or if you want to edit multiple rows together select a number of Asset / Data Stream rows and click the Edit button.
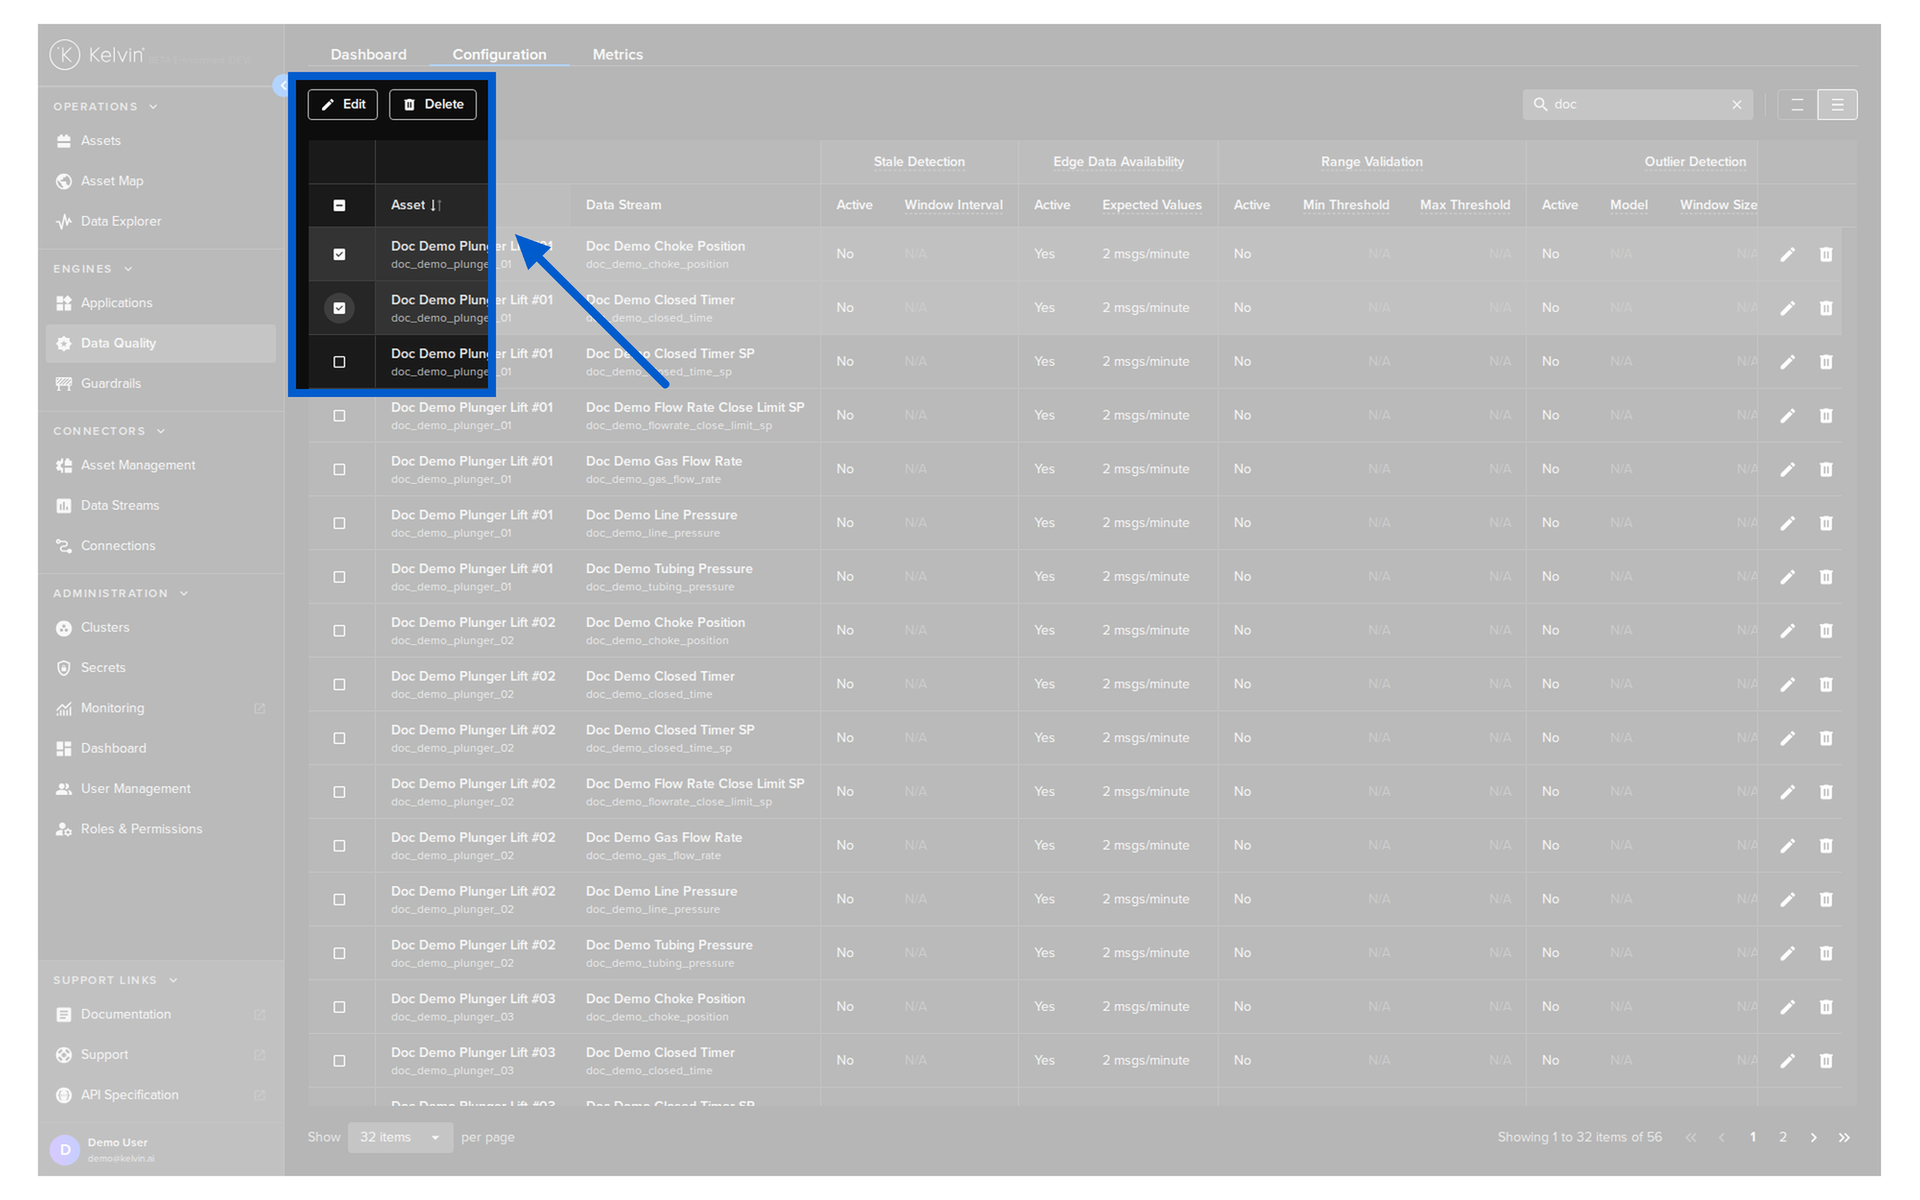
You will then see the configuration page where you can update the metric settings.
When ready, click the Submit button to save your changes.
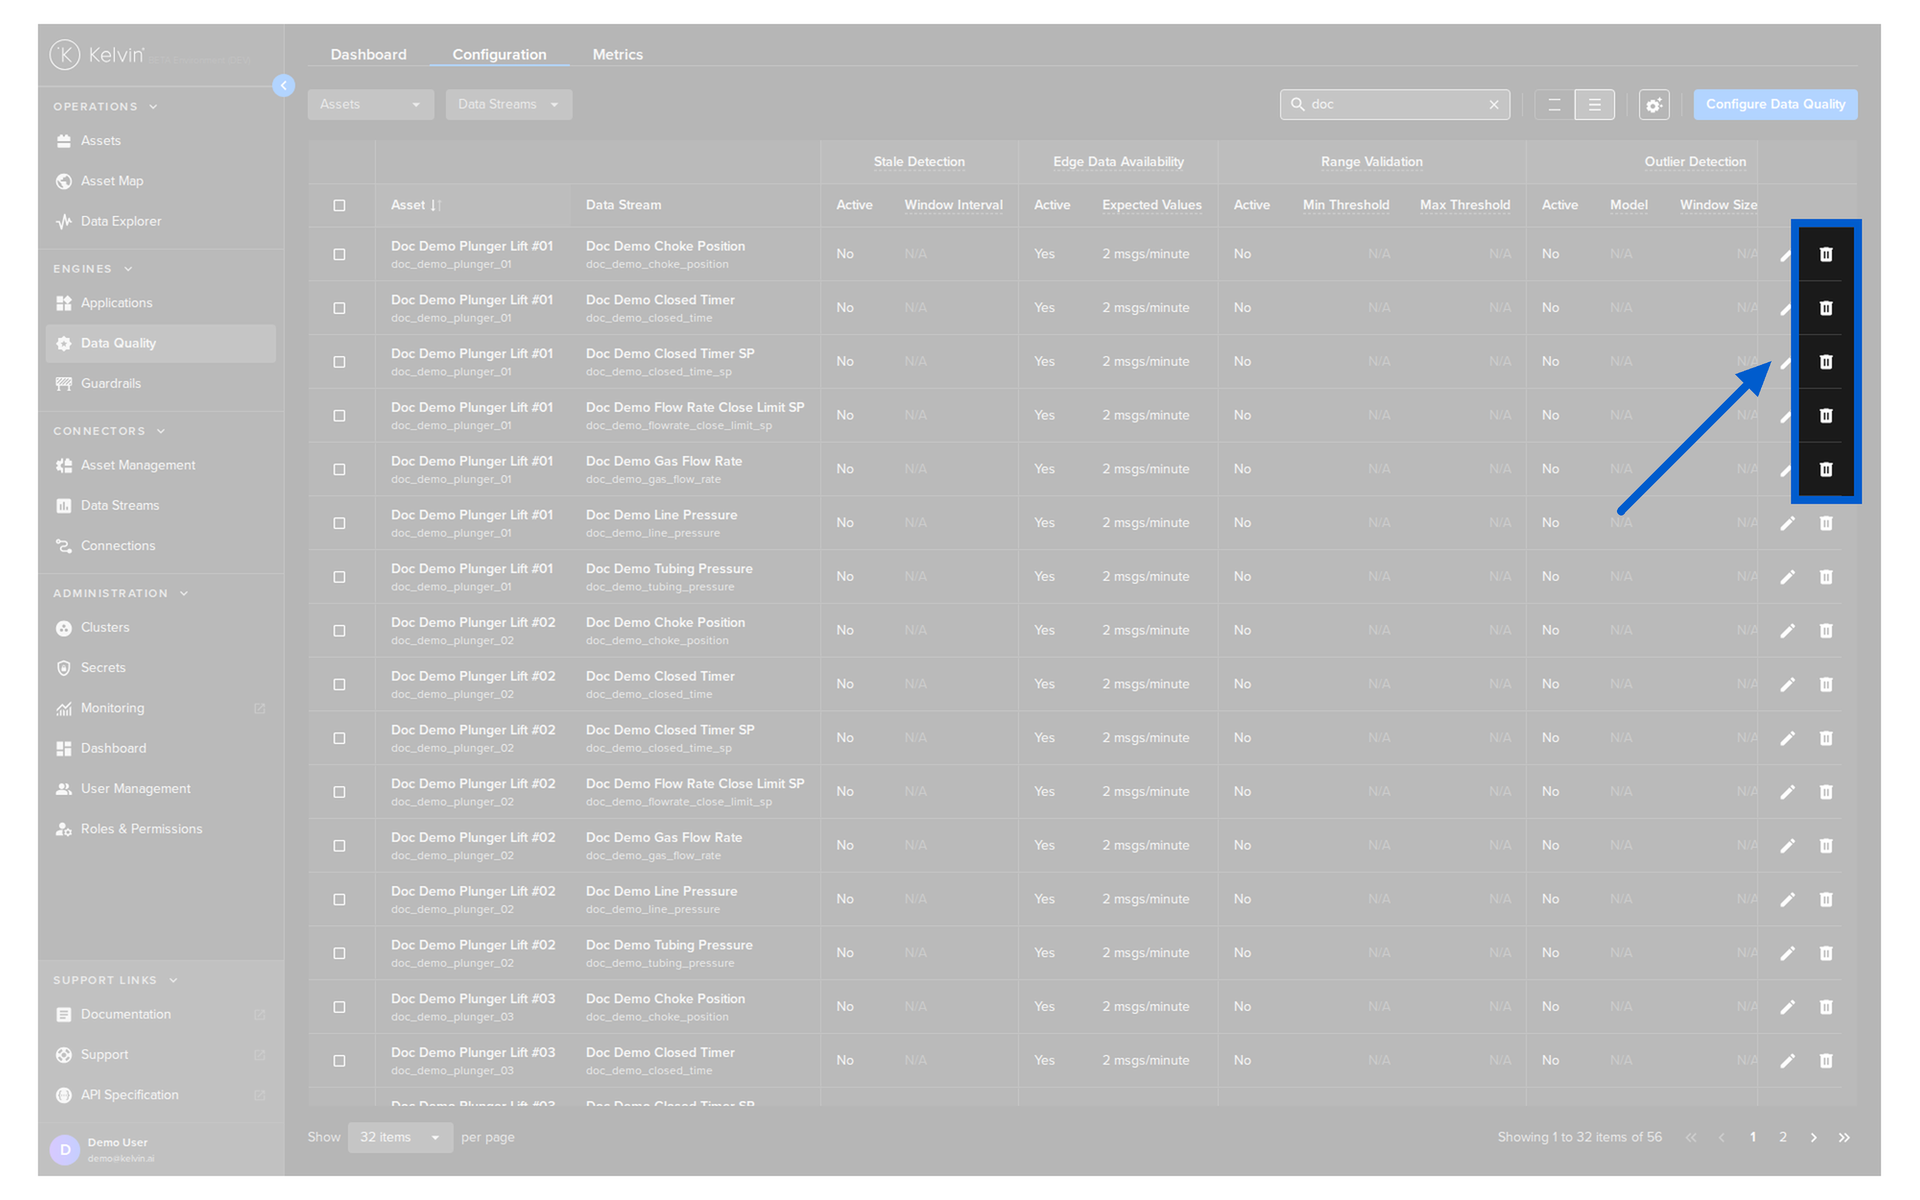
Delete Configurations
You can delete individual Data Quality checks for Asset / Data Stream Pairs.
Note
You can not delete any Data Quality monitors if they are being used in a Kelvin SmartApp™.
The delete icon will be gray and unselectable.
To start either click on the delete icon ![]() .
.
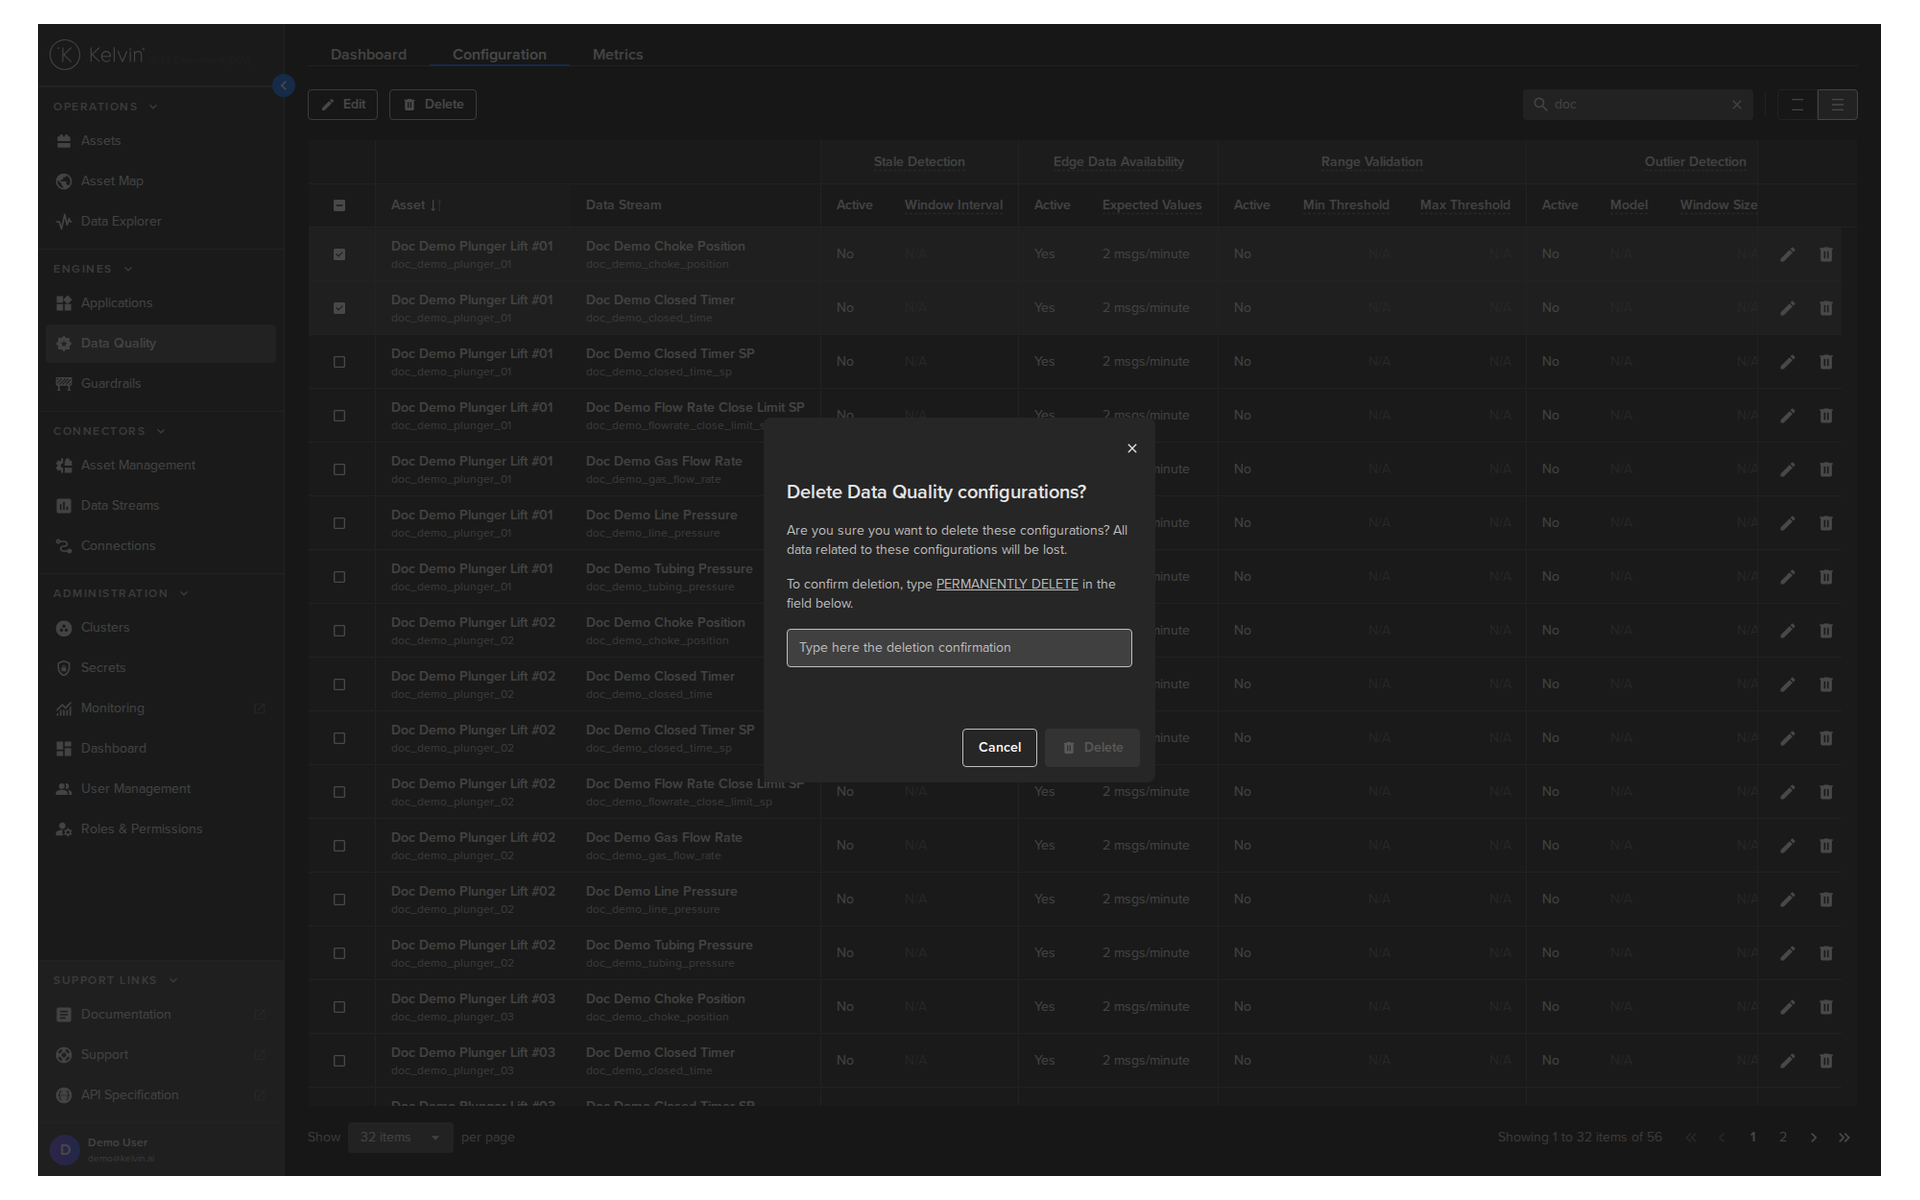
Or if you want to delete multiple rows together select a number of Asset / Data Stream rows and click the Delete button.
You will then see the delete confirmation popup. Type the word PERMANENTLY DELETE to confirm and then click the Delete button.