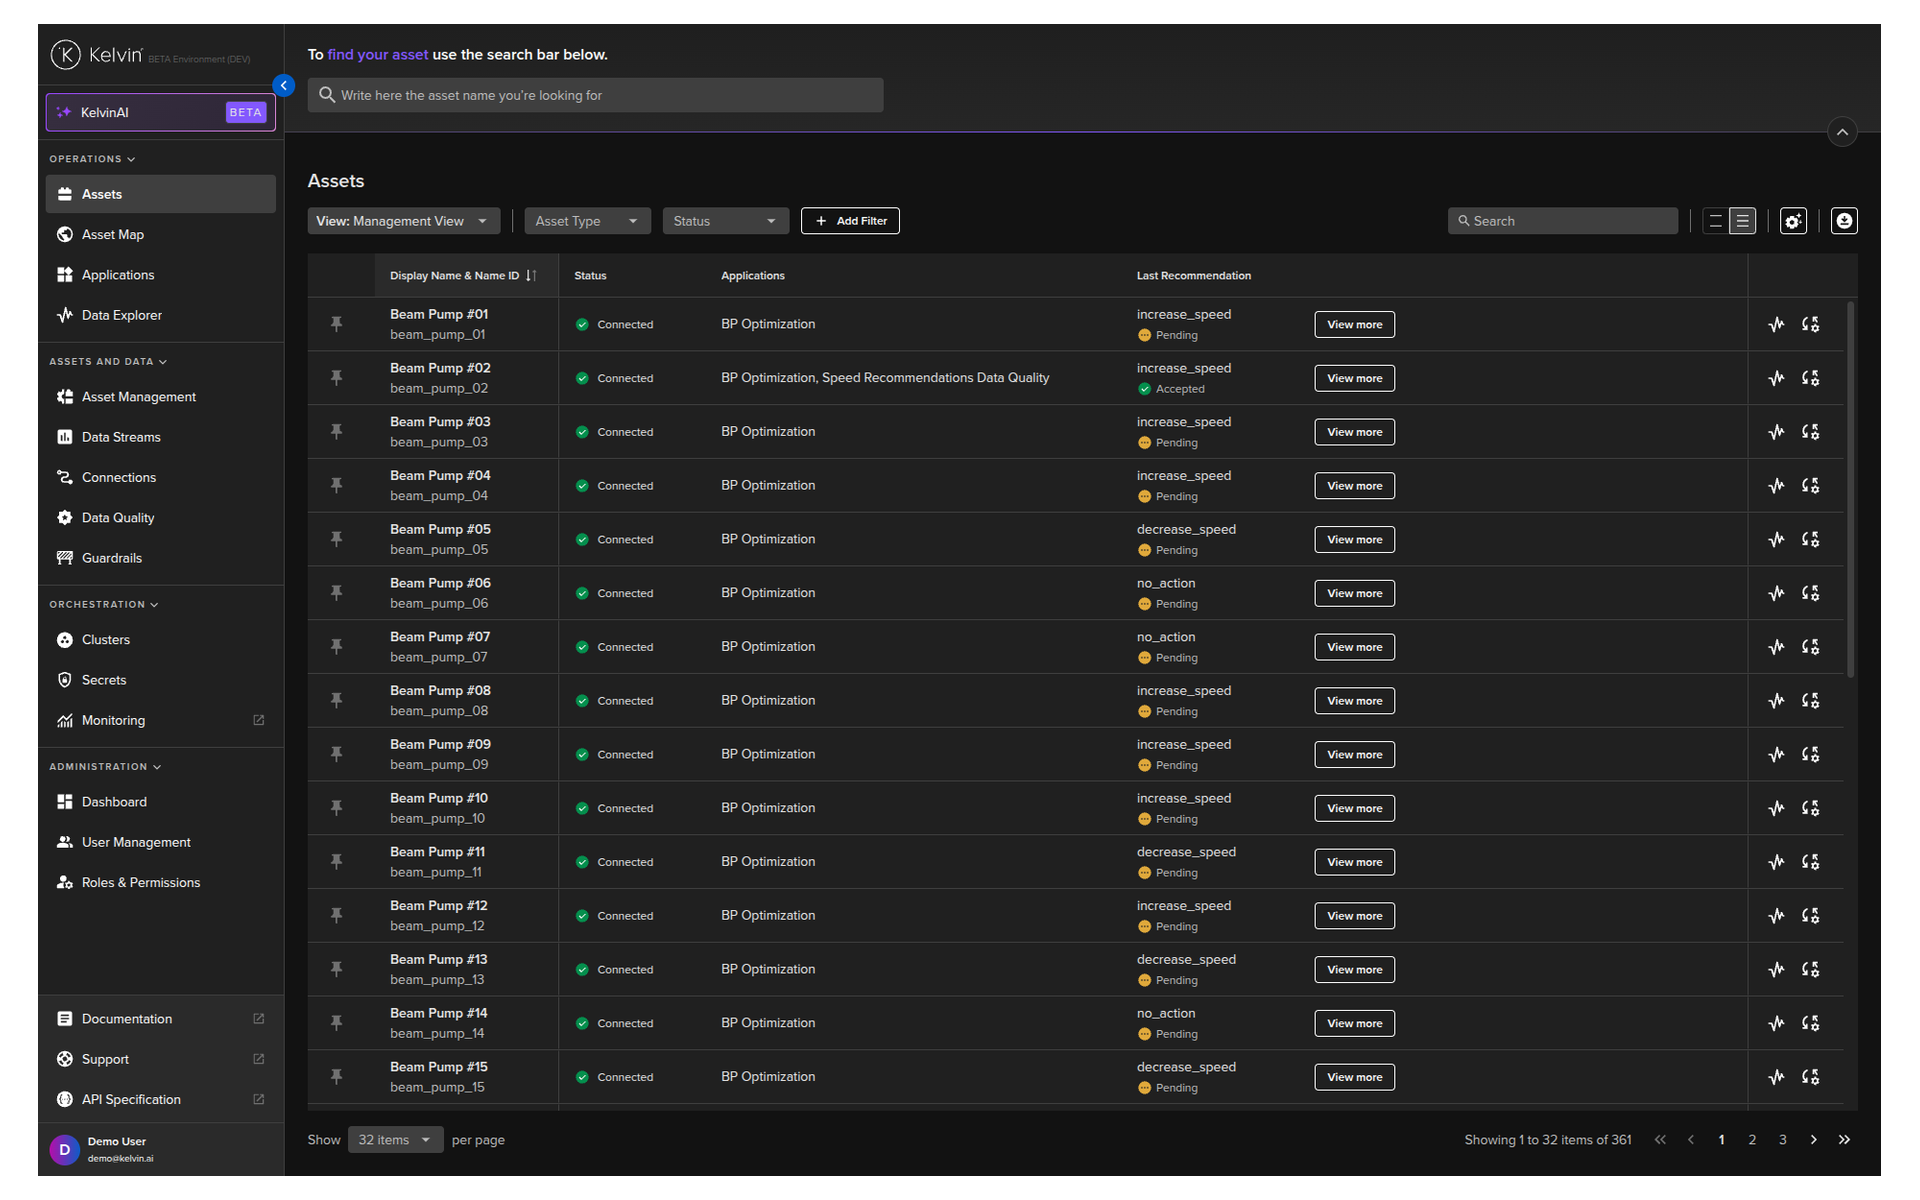
242: Asset Table View
This course is for Operations Engineers.
By the end, you will know how to customize the Assets page to show exactly the information you need, how to filter and find assets fast, and how to save views for different workflows.
Your Home Base
The Assets page is the first thing you see when you log into Kelvin. It is also the page you will spend the most time on.
By default, it shows the basics — asset name, status, applications and a link to the Data Explorer and manual controls. But the real power is in making this table yours. Every column, filter, and layout setting is customizable and persistent between sessions — set it up once and it is there every time you come back.
Success
You can also setup multiple layouts, called views, which you can quickly switched between as required.
Inline Features
Before we get into customization, it is worth knowing what you can do directly from the asset table without opening any asset detail pages.
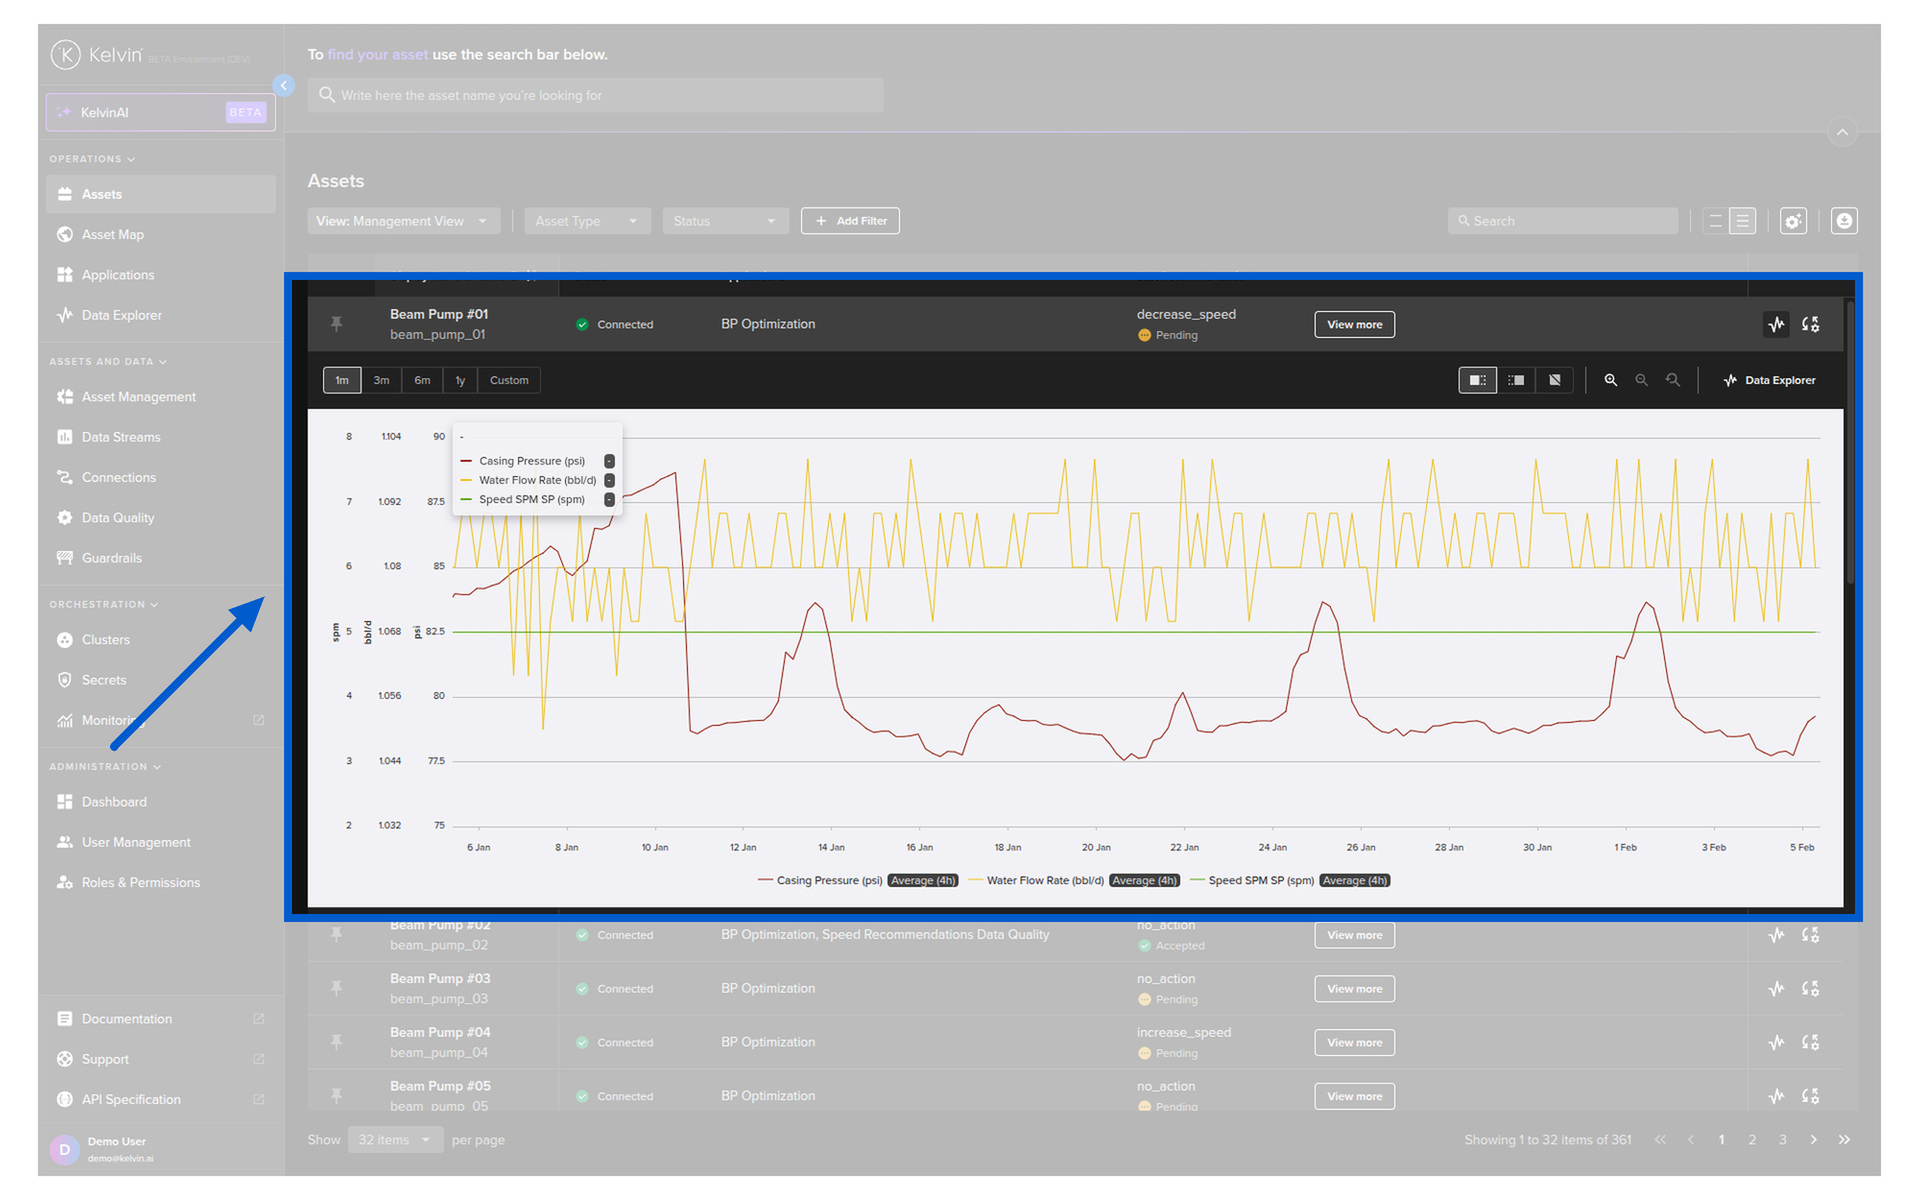
Data Explorer Link
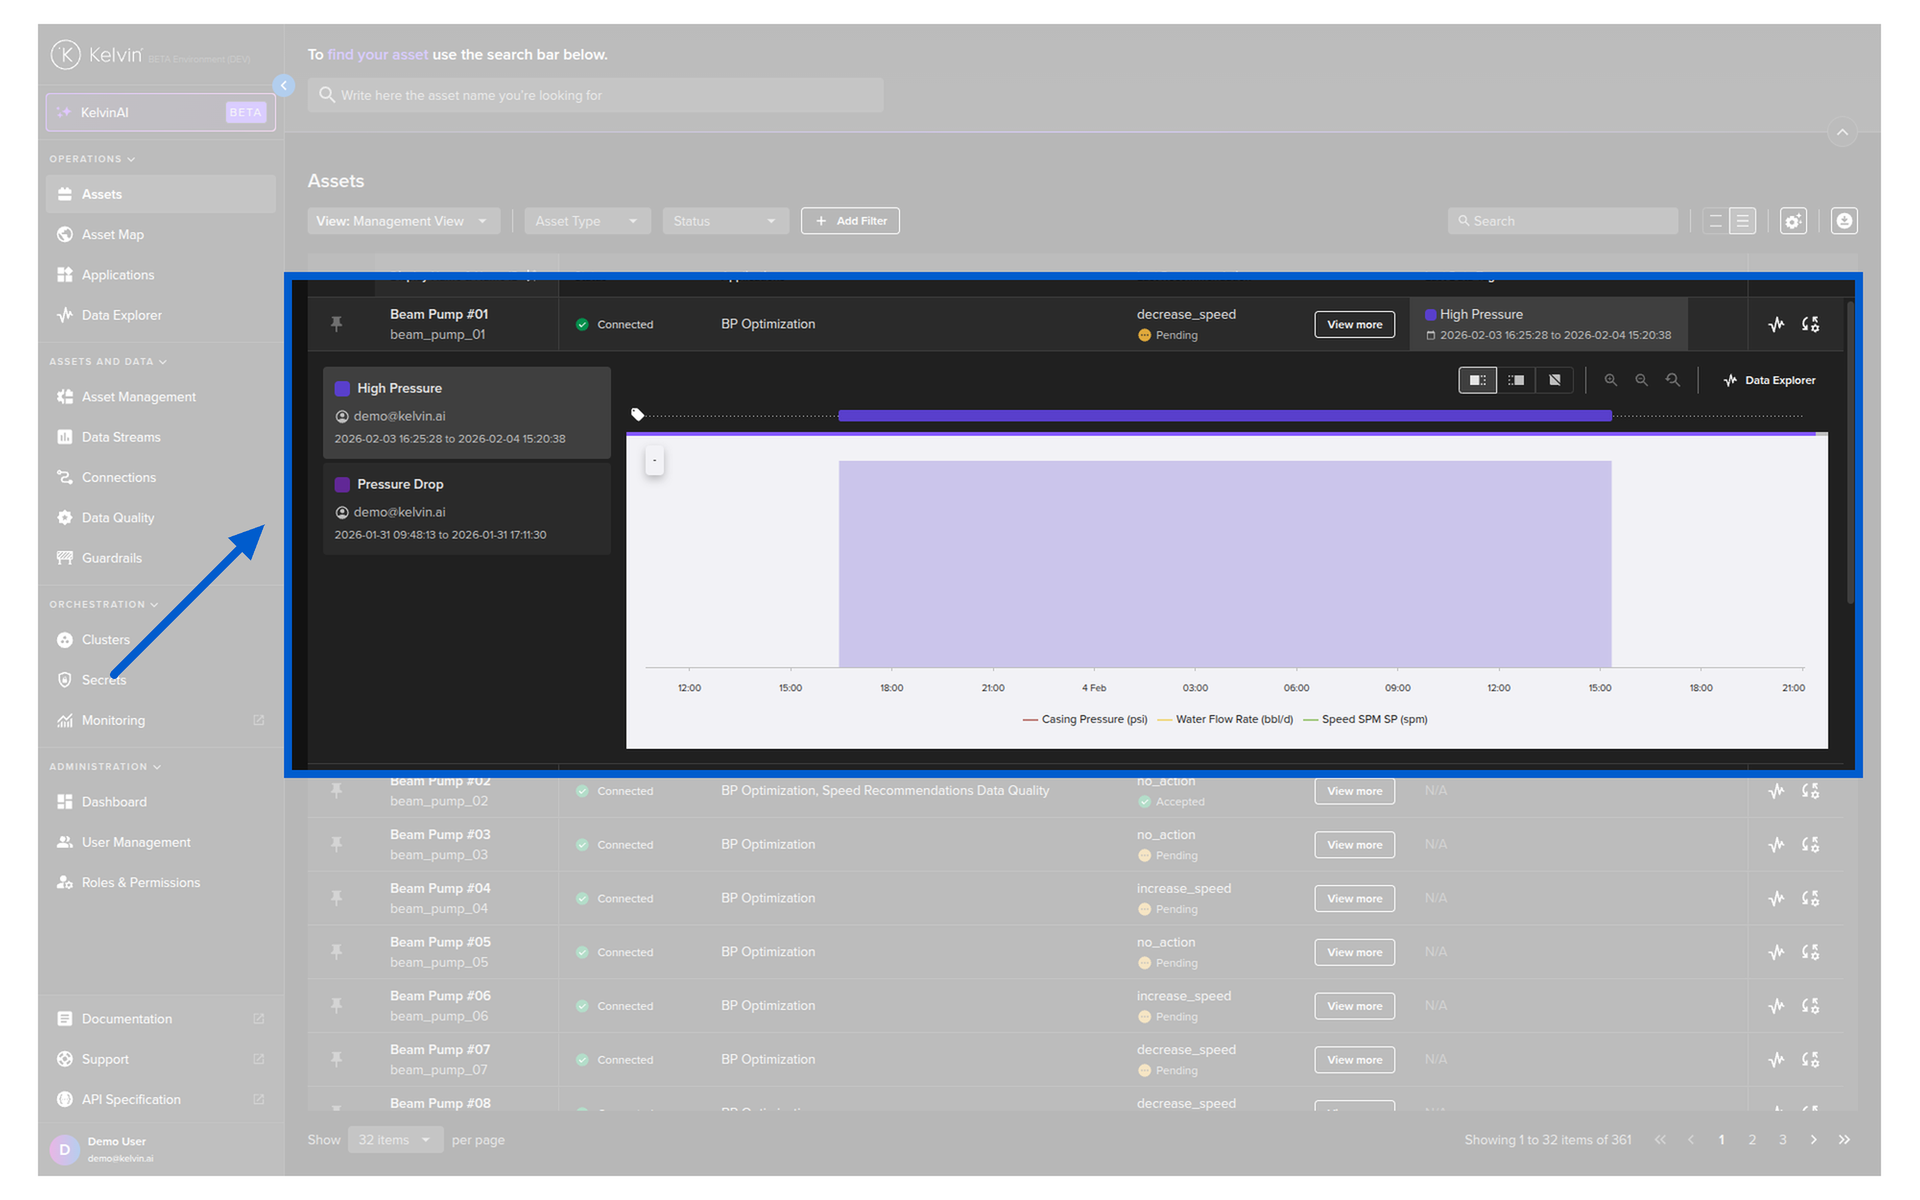
Every asset row has a direct link to the Data Explorer. Click it and you jump straight into the historical data charts for that asset. No need to navigate through menus.
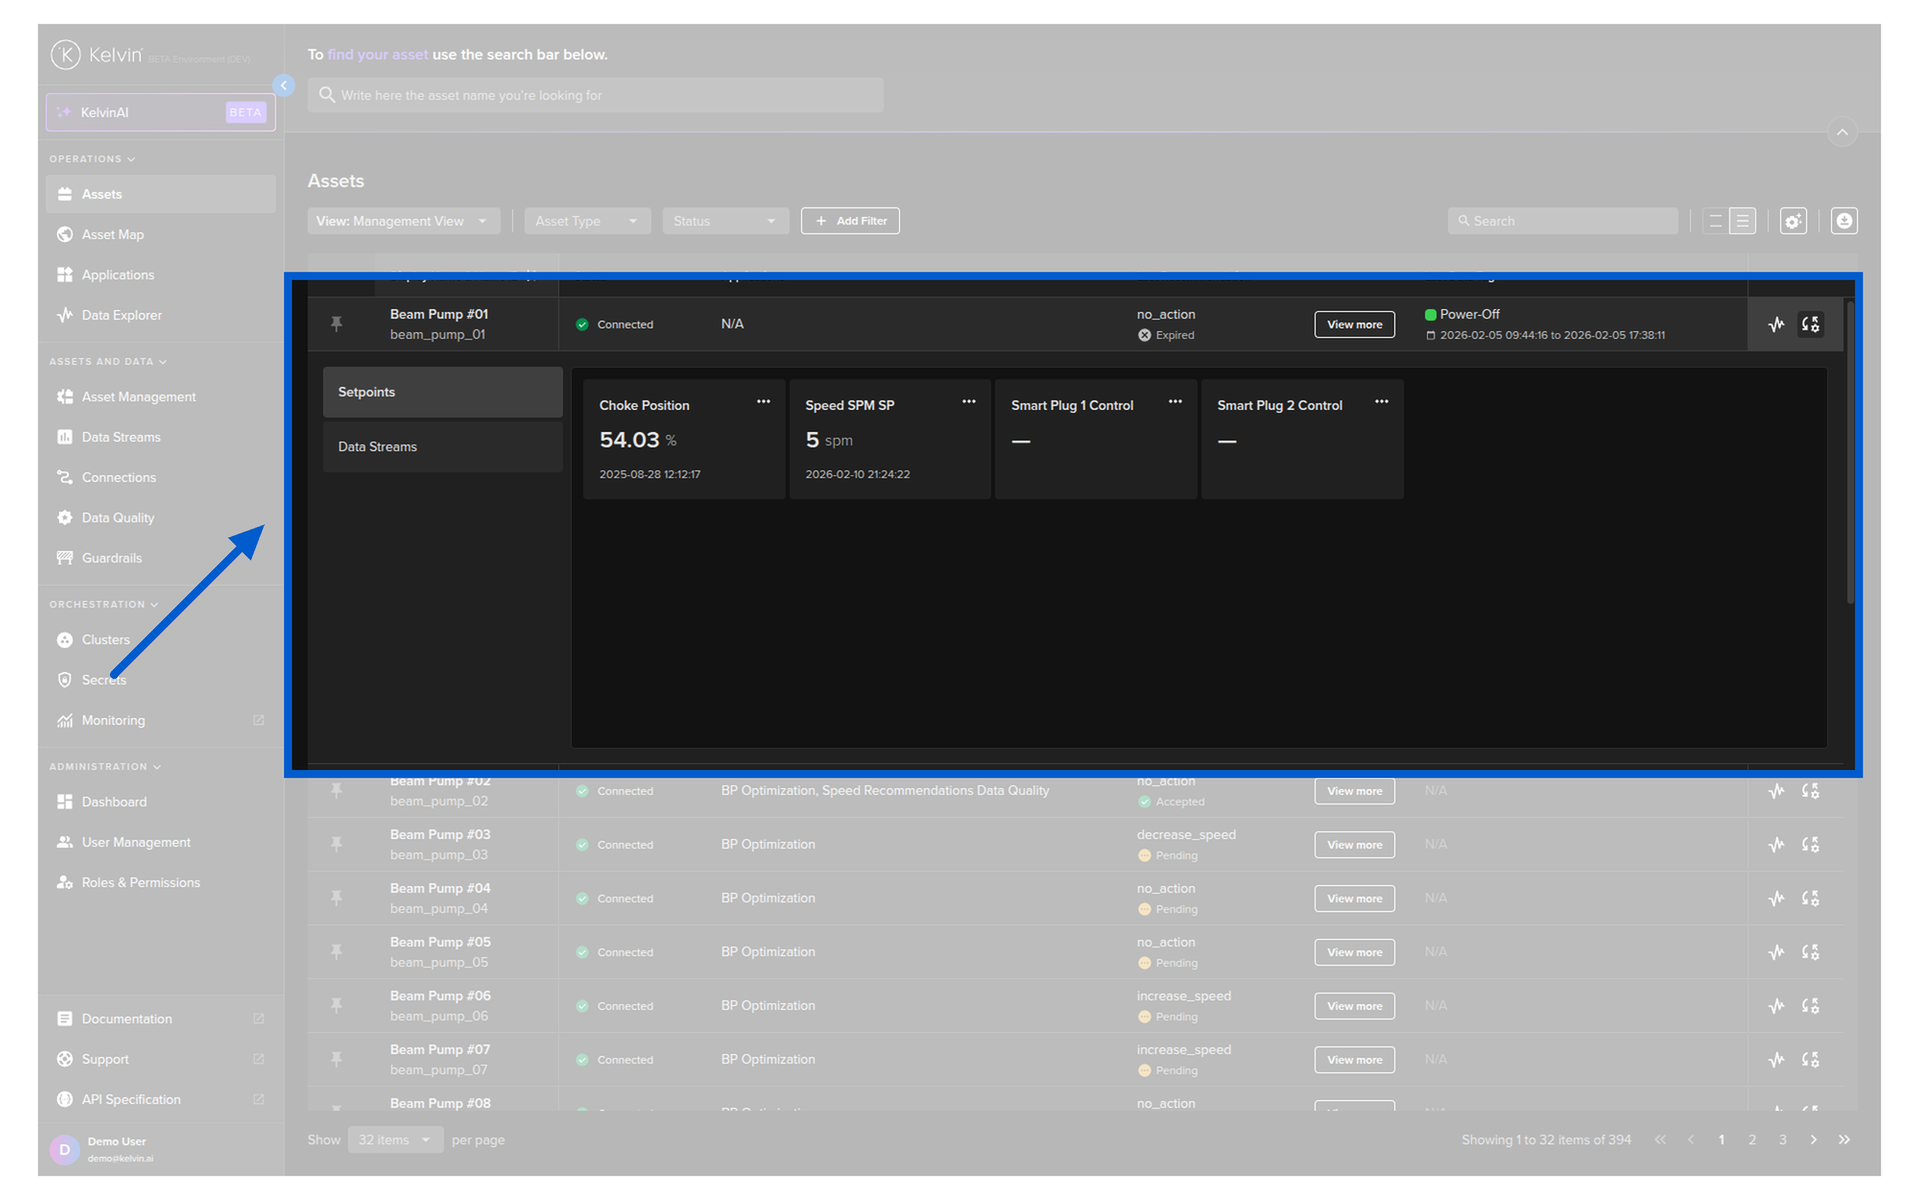
Manual Controls
Every asset row also includes a direct Manual Controls icon. Open it to view Data Streams and adjust setpoints quickly, without leaving the Assets table.
Recommendations Inline
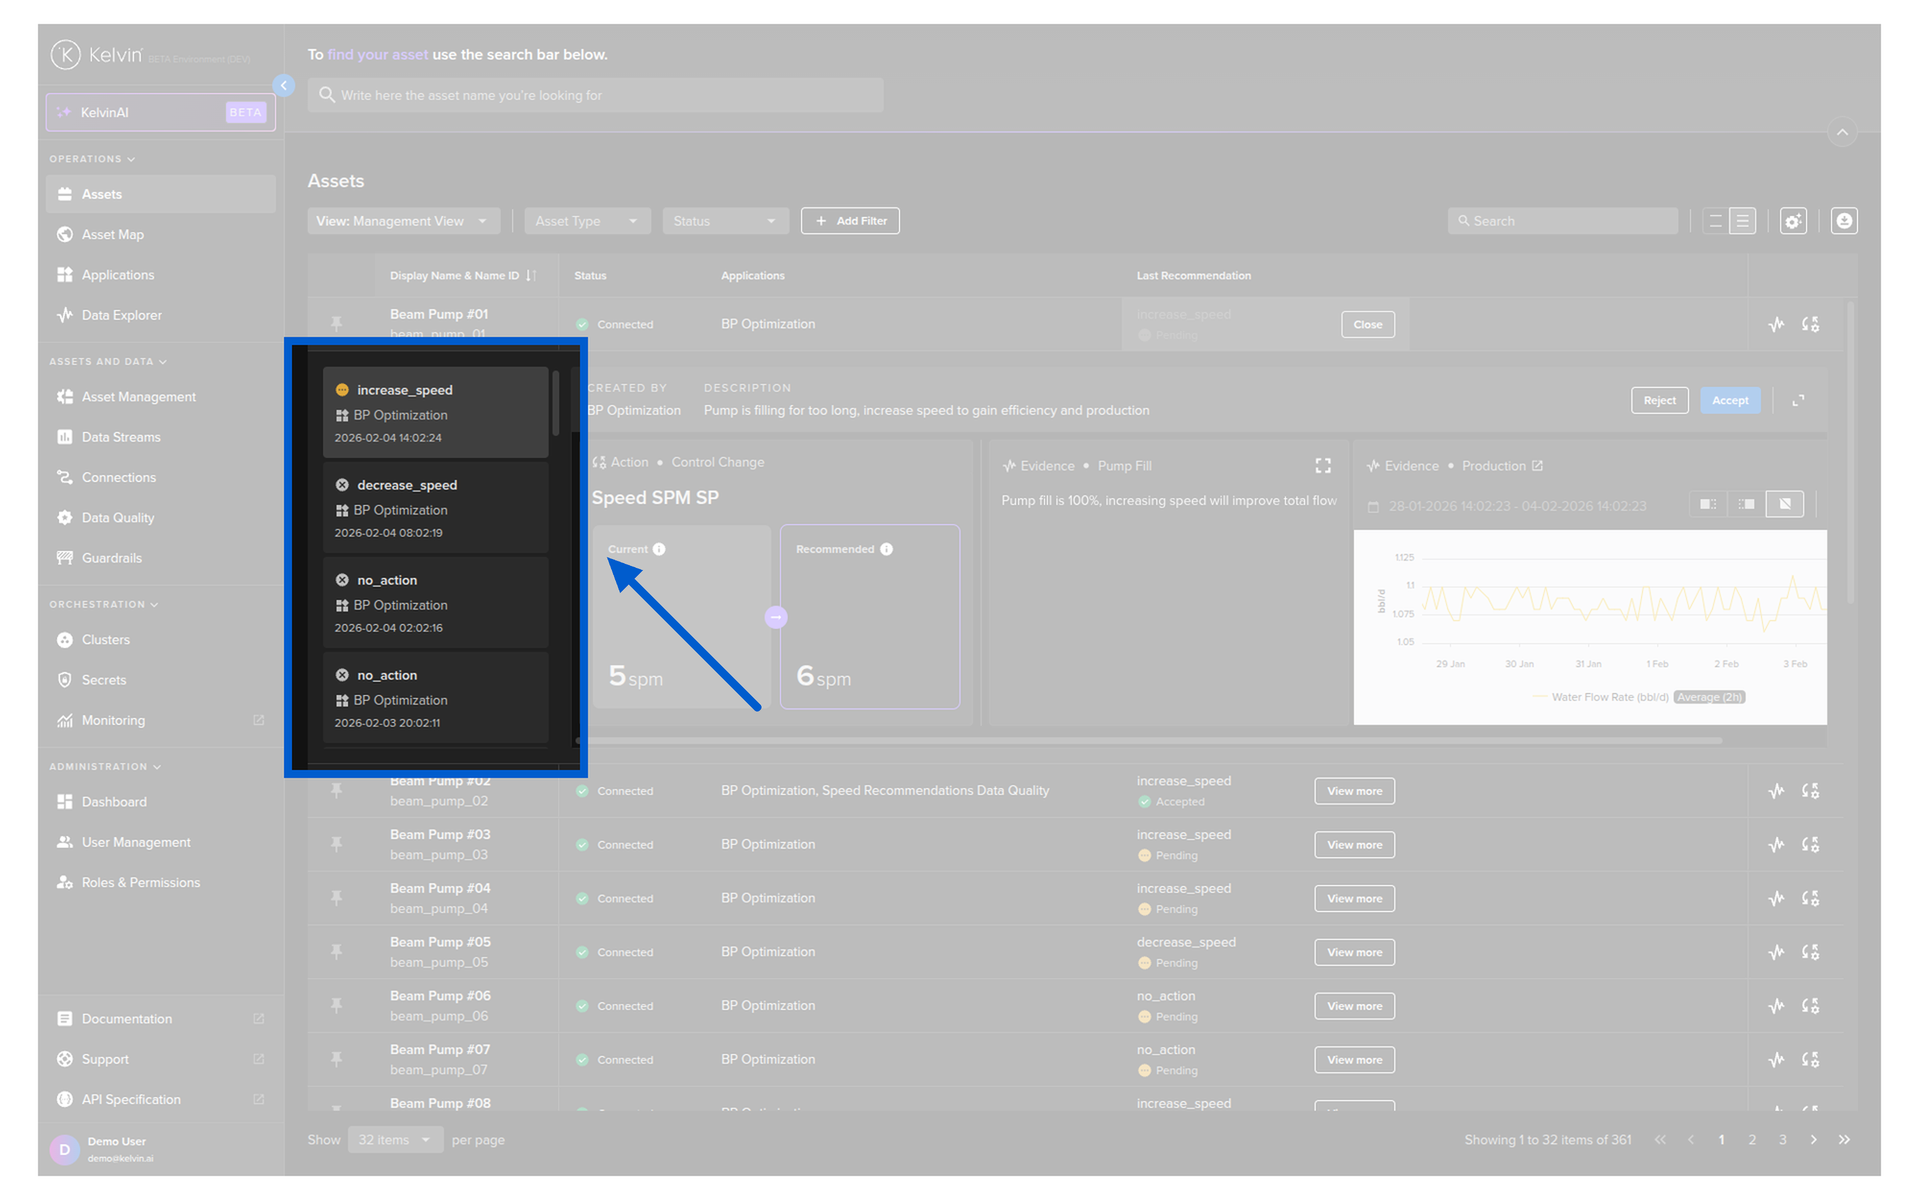
When you add the Recommendation column, pending recommendations show a View More button directly in the table. Click it and the recommendation popup opens — you can review evidence, accept, reject, or comment without leaving the Assets page.
If you see a Details link instead, it means there are no pending recommendations — only historical ones.
Insights
Insights are labels attached to data by SmartApps to flag conditions or events. When you add an Insight column, you can see the latest insight for each asset inline — giving you an instant visual indicator of what the SmartApp has flagged.
Basic Table Features
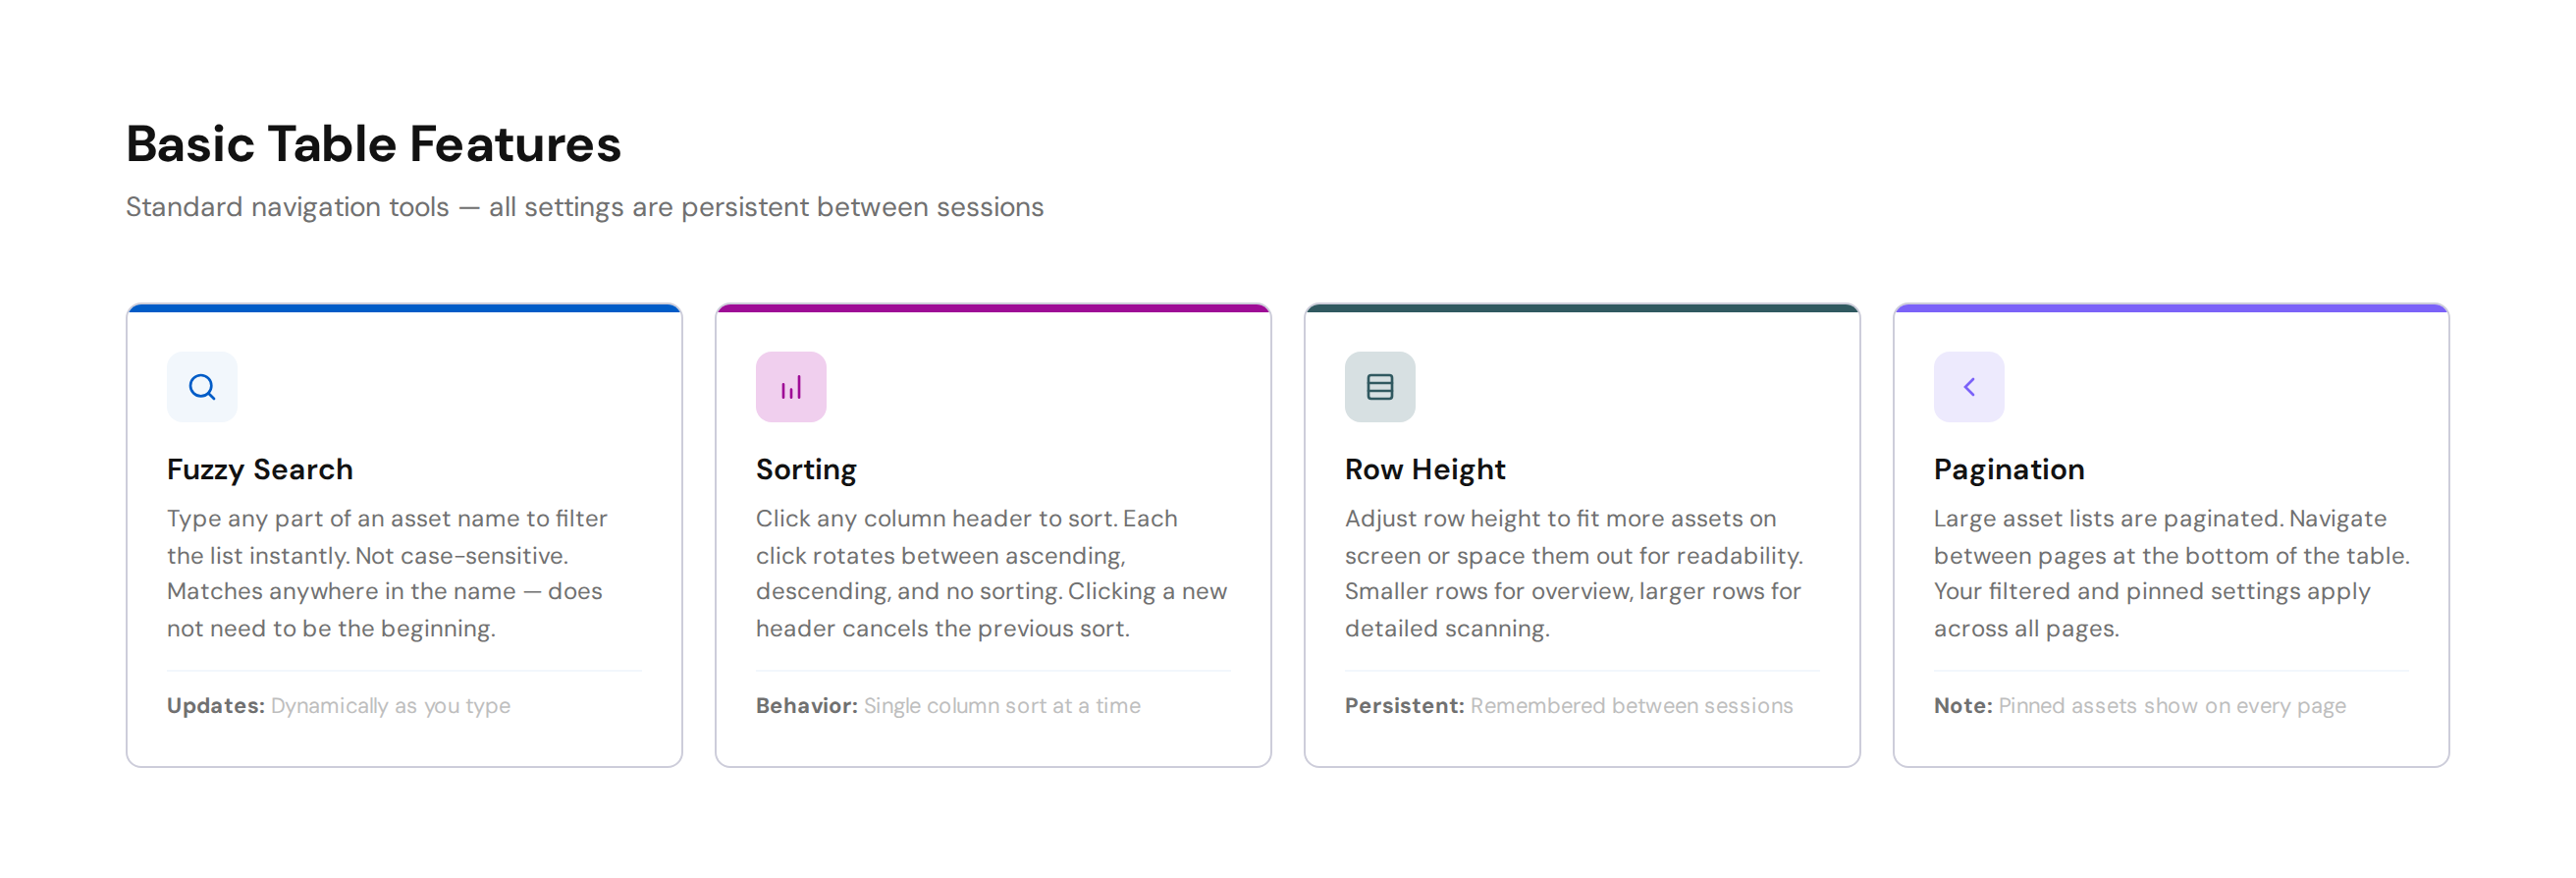
The asset table comes with standard features that make navigating large datasets straightforward.
Sorting
Click any column header to sort the table. Each click rotates between ascending, descending, and no sorting. Clicking a new header cancels the previous sort.
Row Height
Adjust row height to fit more assets on screen or space them out for readability. Smaller rows let you see more assets at a glance; larger rows are easier to read when scanning values.
Pages
When you have many assets, the table is paginated. Navigate between pages at the bottom of the table.
Persistence
All your settings — search, sort, row height, page — are remembered between sessions. Close the browser, come back tomorrow, and everything is exactly as you left it.
Custom Columns
This is where the asset table becomes truly powerful. You can add columns that show live Kelvin data directly in the table — turning it into a real-time dashboard for your specific workflow.
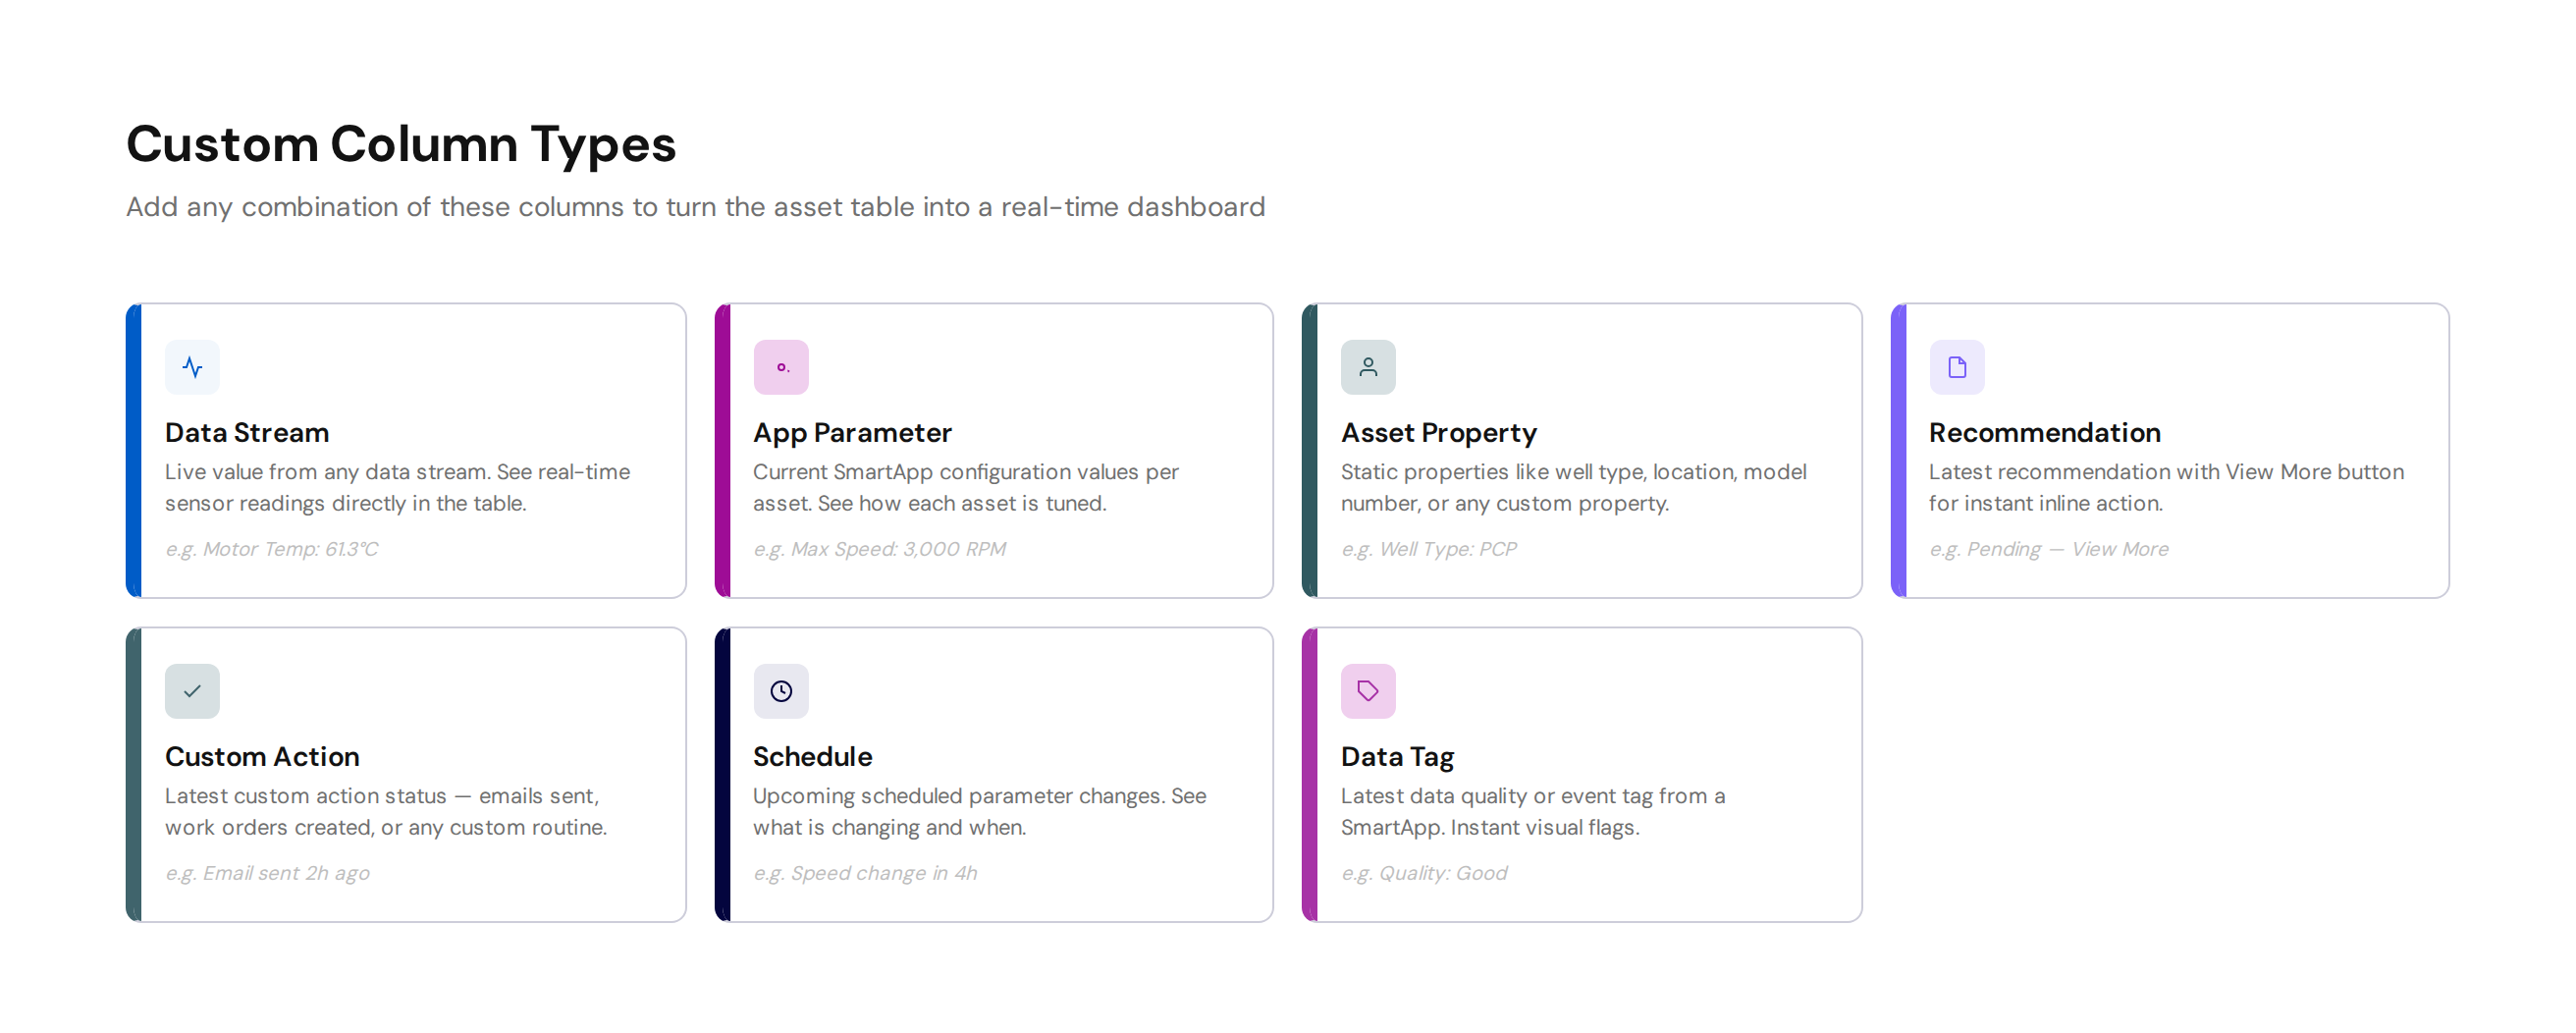
Available Column Types
| Column Type | What It Shows | Example |
|---|---|---|
| App Parameter | Current SmartApp configuration value for the asset | Maximum speed setting, target threshold |
| Asset Property | Static property defined for the asset | Well type, location, model number |
| Last Action | Latest action status (control changes and custom actions) | Last email sent, last work order created |
| Data Stream | Live value from any data stream on the asset | Current motor temperature, pressure reading |
| Insight | Latest insight from a SmartApp | Quality flag, operating mode label |
| Recommendation | Latest recommendation status and View More action | Pending recommendation with one-click access |
| Schedule | Upcoming scheduled parameter changes | Next scheduled setpoint change |
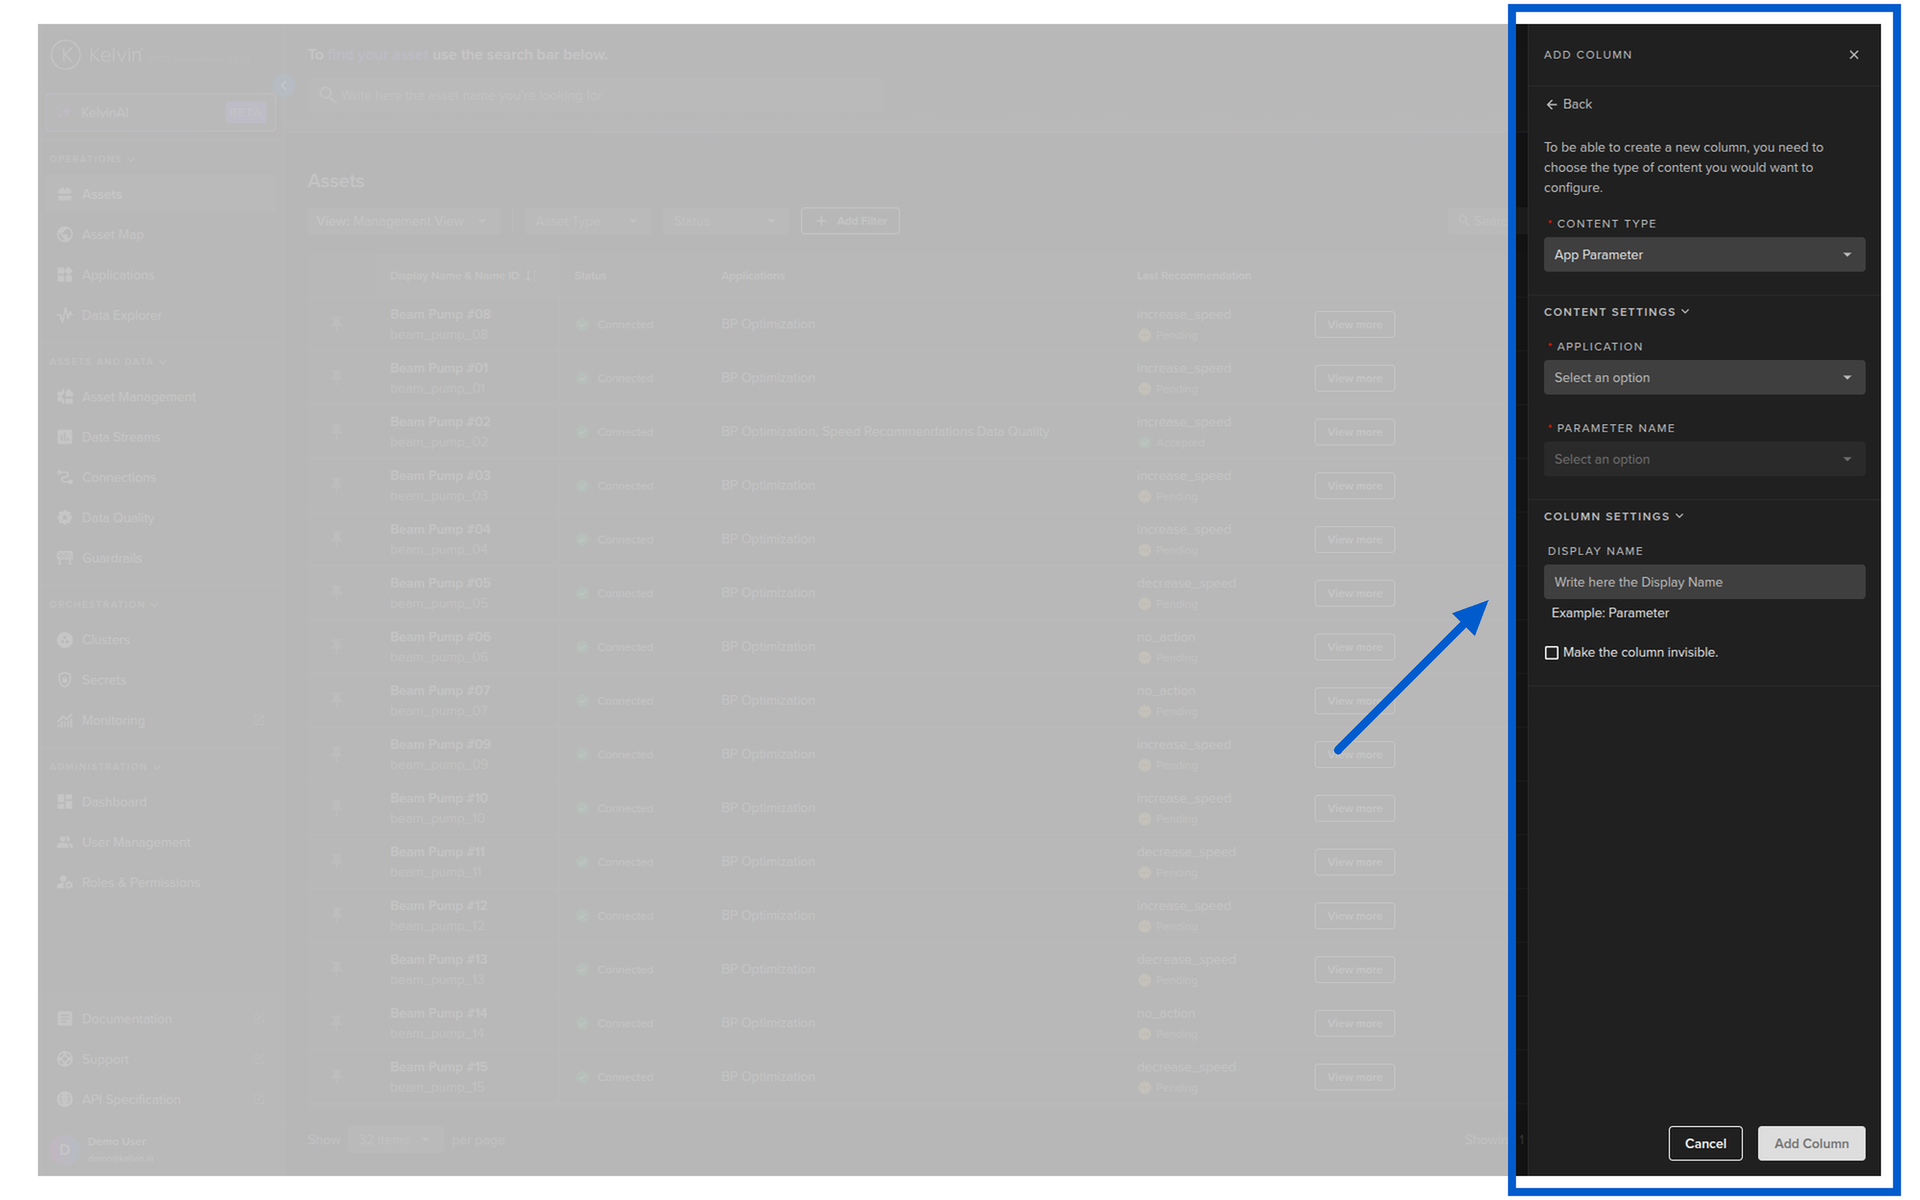
How to Add Columns
- Click the column settings icon in the table header
- Browse the available column types
- Select the specific data stream, parameter, property, or feature you want
- The column appears immediately in the table
You can add as many custom columns as you need.
Column Management
Once you have added columns, you have further controls:
- Freeze columns — lock columns to the left or right so they always stay visible when you scroll horizontally
- Hide columns — temporarily hide columns without removing them
- Reorder columns — drag columns to arrange them in the order you prefer
- Column statistics — see an overview of how many columns are available and showing
- Reset — return all column settings to factory defaults if you want to start fresh
For full details, see the Customize Columns documentation.
Pin Assets
When you have hundreds or thousands of assets, a few will always be more important than the rest. Pinning lets you keep those critical assets at the top of the table, visible on every page.
Click the pin icon on any asset row to pin it. Pinned assets appear at the top of the table regardless of sorting or filtering. Click again to unpin.
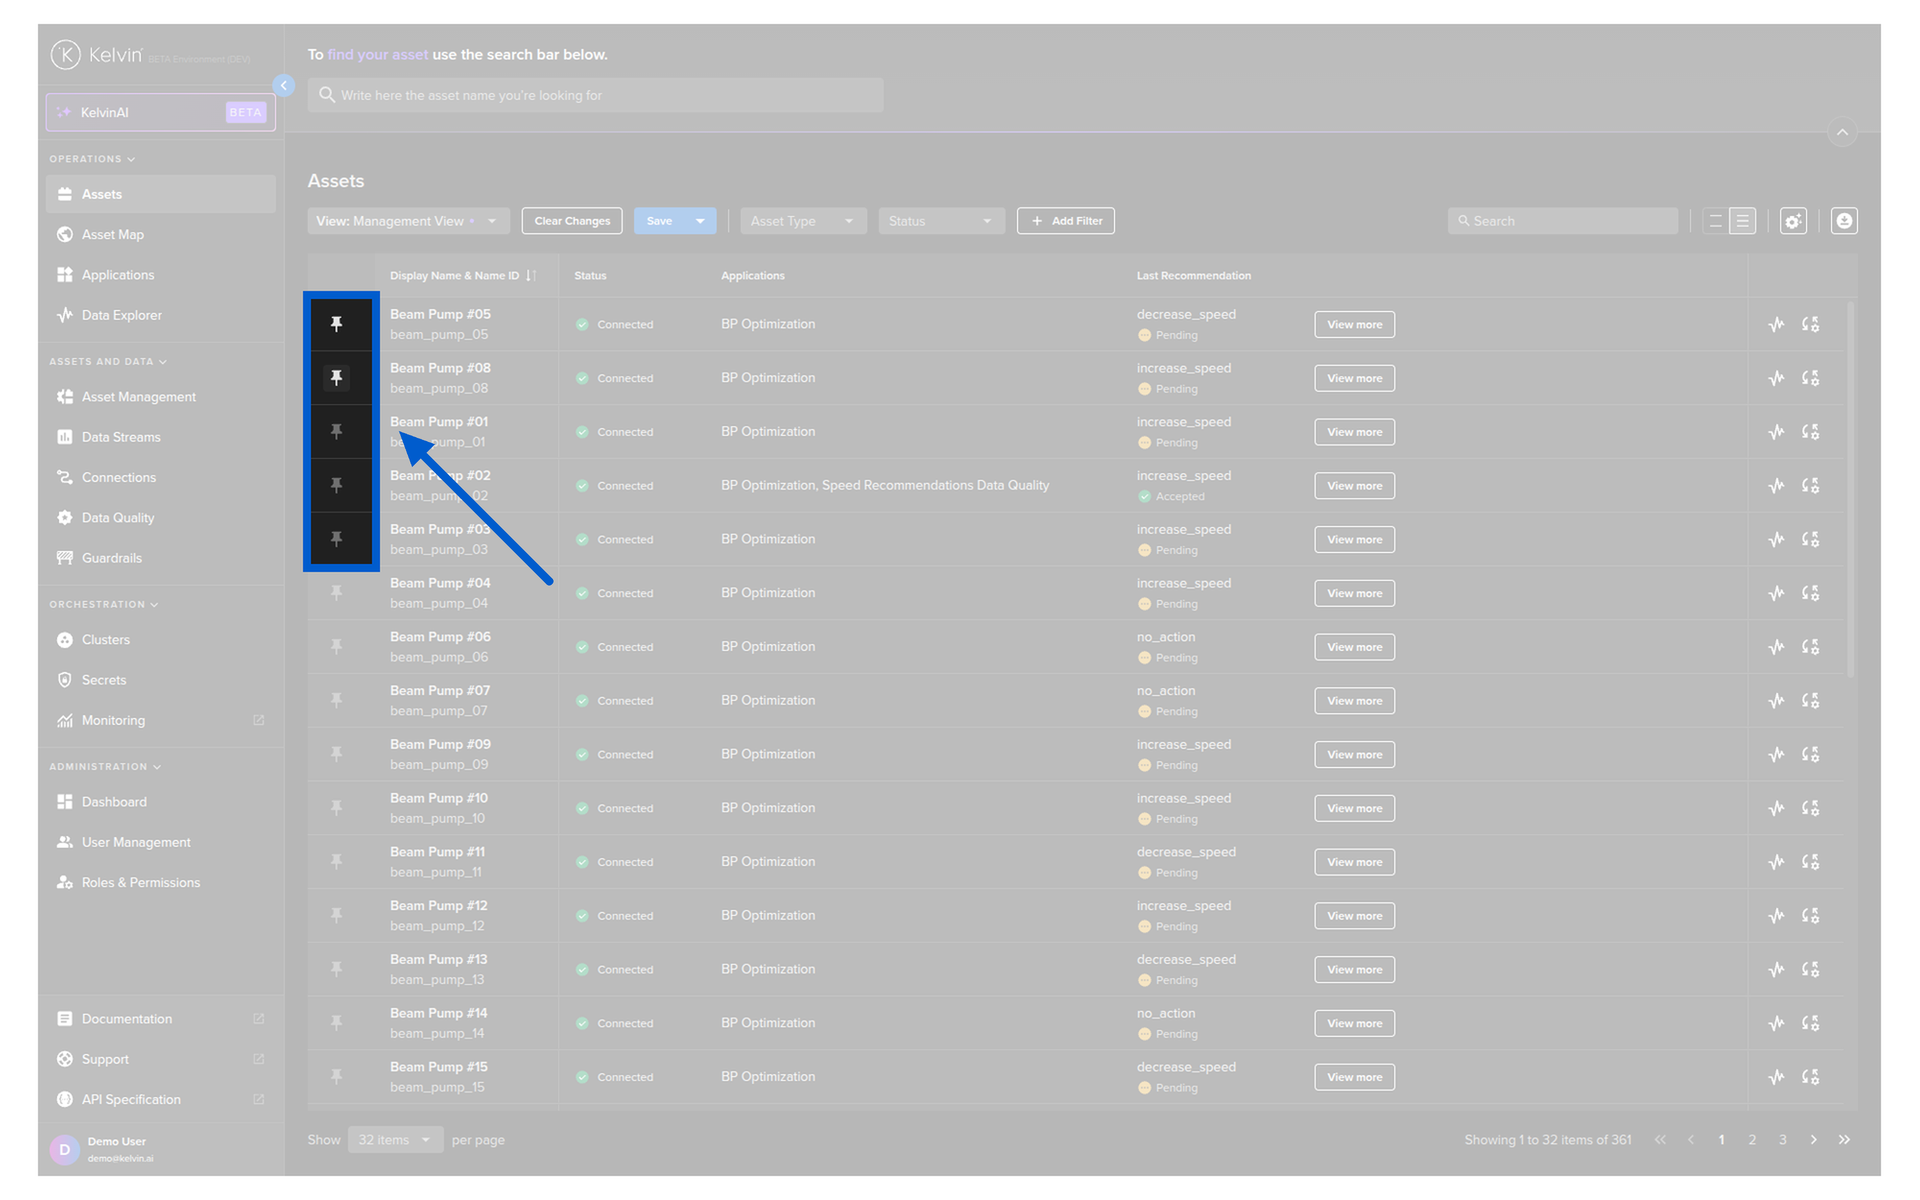
When to Pin
Pin assets that are in a critical state, undergoing testing, or need close monitoring. This way they are always the first thing you see when you open the page.
Advanced Filters
The filter system is one of the most powerful features in the Assets page. It lets you create complex, multi-criteria conditions to narrow down exactly which assets are shown.
What You Can Filter On
Filters work across multiple data types:
- Application — filter by which SmartApp is running on the asset
- Asset Properties — filter by any property like well type, location, or operational mode
- Asset status — Disconnected, Connected, Unknown
- Control Changes — filter by recent control change activity
- Data Stream values — filter by live data stream conditions
- Insights — filter by insight name or source
- Recommendations — filter by recommendation status
How Filters Work
- Click the Add Filter button
- Select the filter type (Application, Asset Property, Status, etc.)
- Configure the condition
- The table updates automatically as you add each filter
Multiple filters stack — they all apply together. For example, you can filter to show only assets that are:
- Running the "Motor Speed Control" SmartApp AND
- In "Open Loop" mode AND
- Located in "Field A"
Performance Note
Complex filters on large asset lists can take over 10 seconds for the initial load. Adding additional conditions after the first filter is much faster as they only apply to the already-filtered list.
Status Quick Filter
At the top of the table you have quick status buttons — Disconnected, Connected, and Unknown. These are one-click filters that immediately narrow the view to assets in that status.
Views
Views are saved configurations of your entire table layout — columns, filters, sorting, and everything else. They let you switch between completely different workflows with a single click.
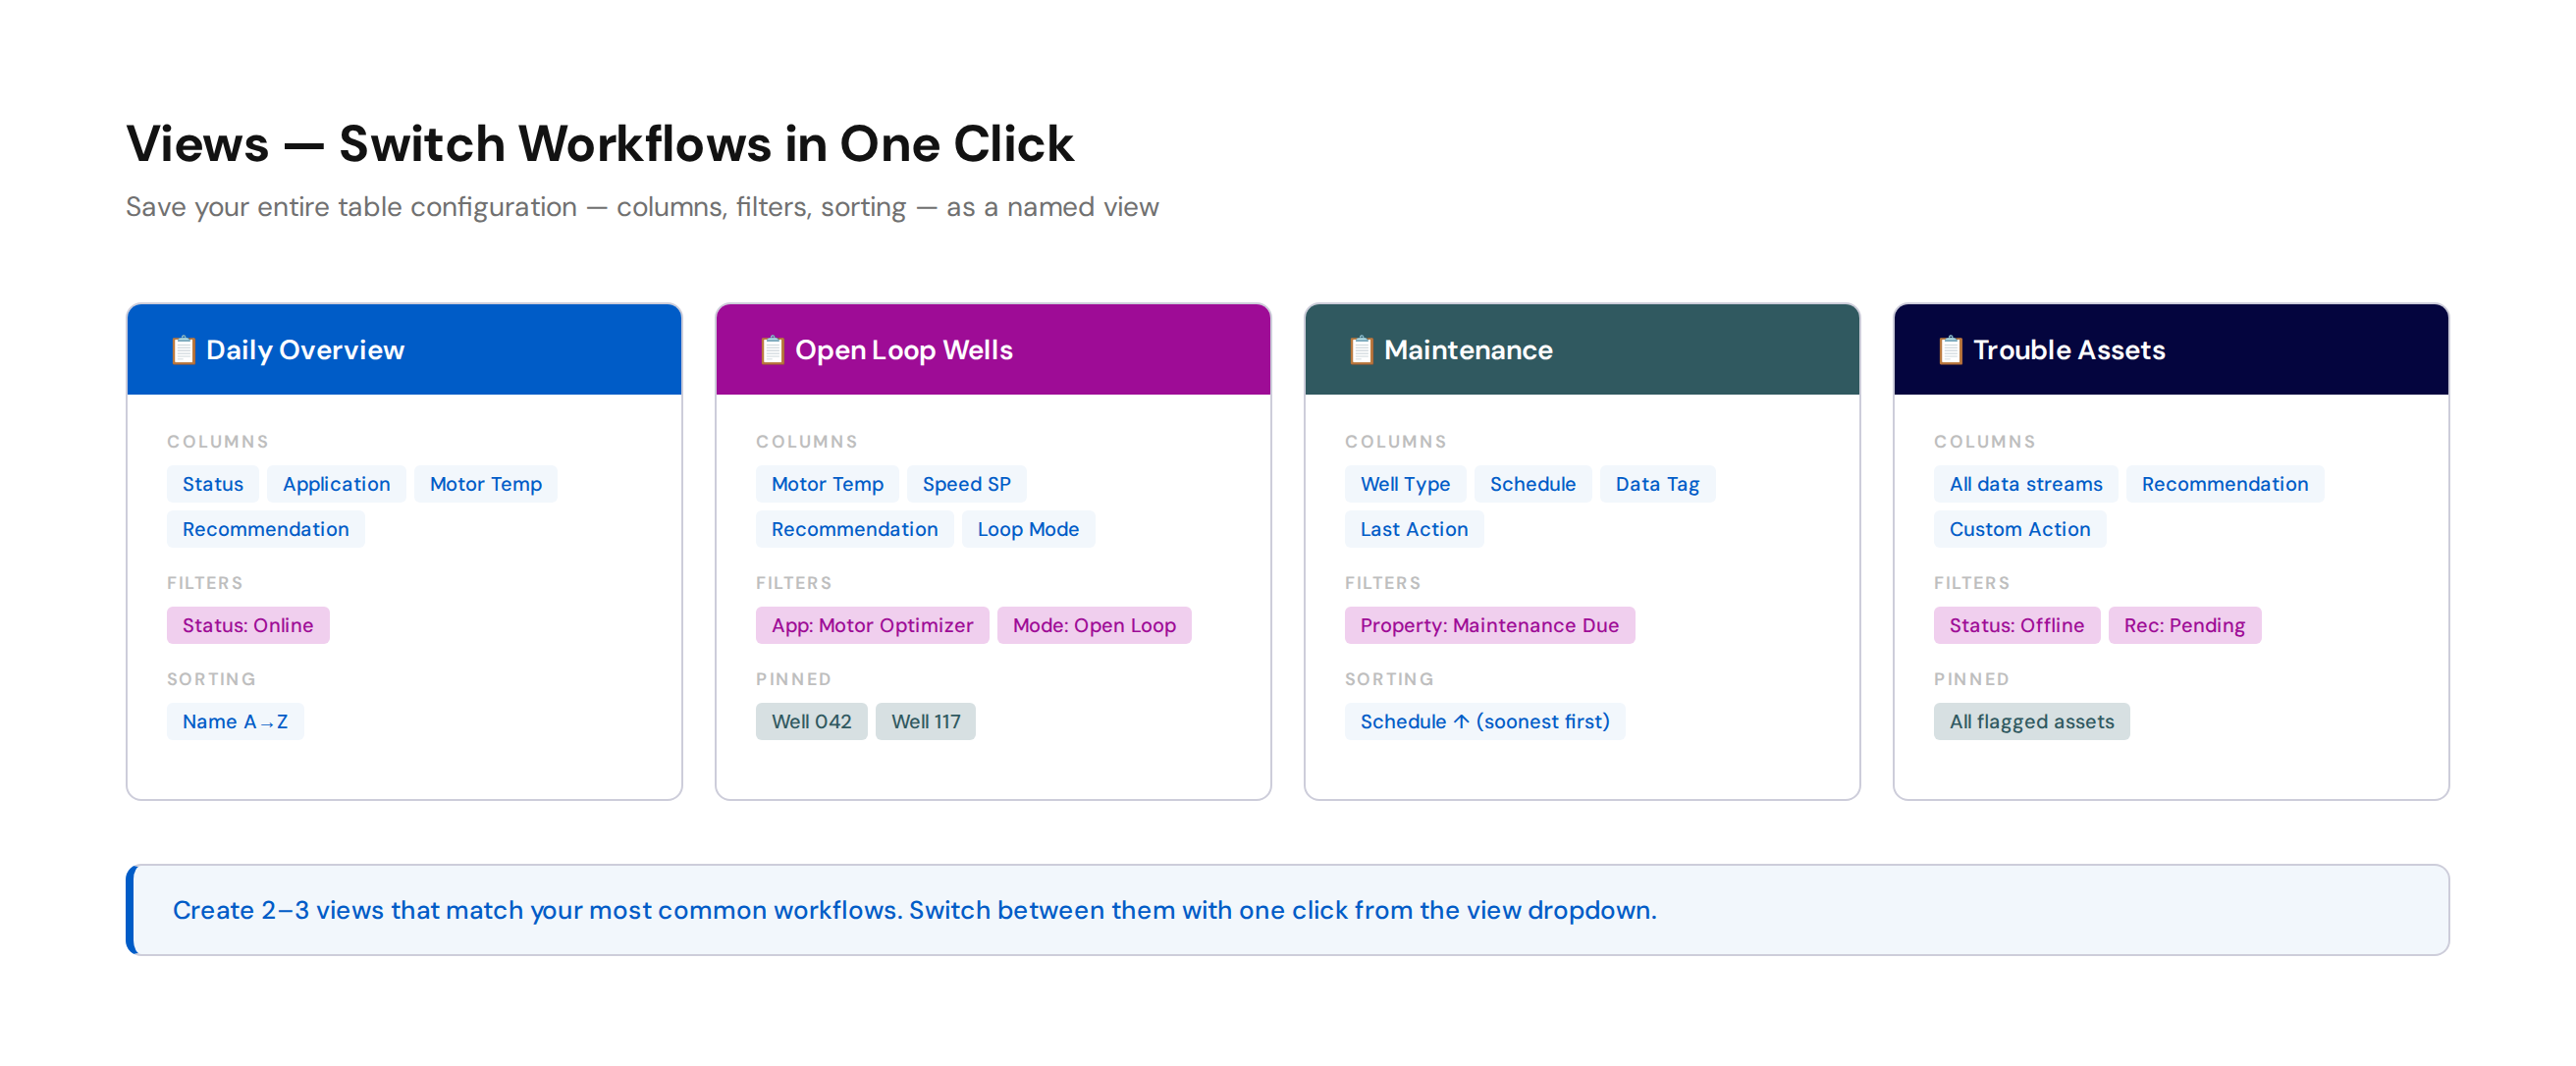
Why Views Matter
Different situations require different information. For example:
- Morning check — all assets, sorted by status, with recommendation and data stream columns
- Open Loop monitoring — filtered to only open loop assets, with parameter and recommendation columns
- Maintenance planning — filtered by asset type, with schedule and insight columns
- Trouble assets — pinned critical assets with full data stream columns for investigation
Instead of reconfiguring the table each time, save each setup as a named view and switch between them instantly.
How to Use Views
- Save a view — configure your table exactly as you want it, then save it with a descriptive name
- Switch views — click the view dropdown and select the view you need
- Overwrite a view — make changes and save over the existing view
- Save as new — make changes and save as a different view to keep the original
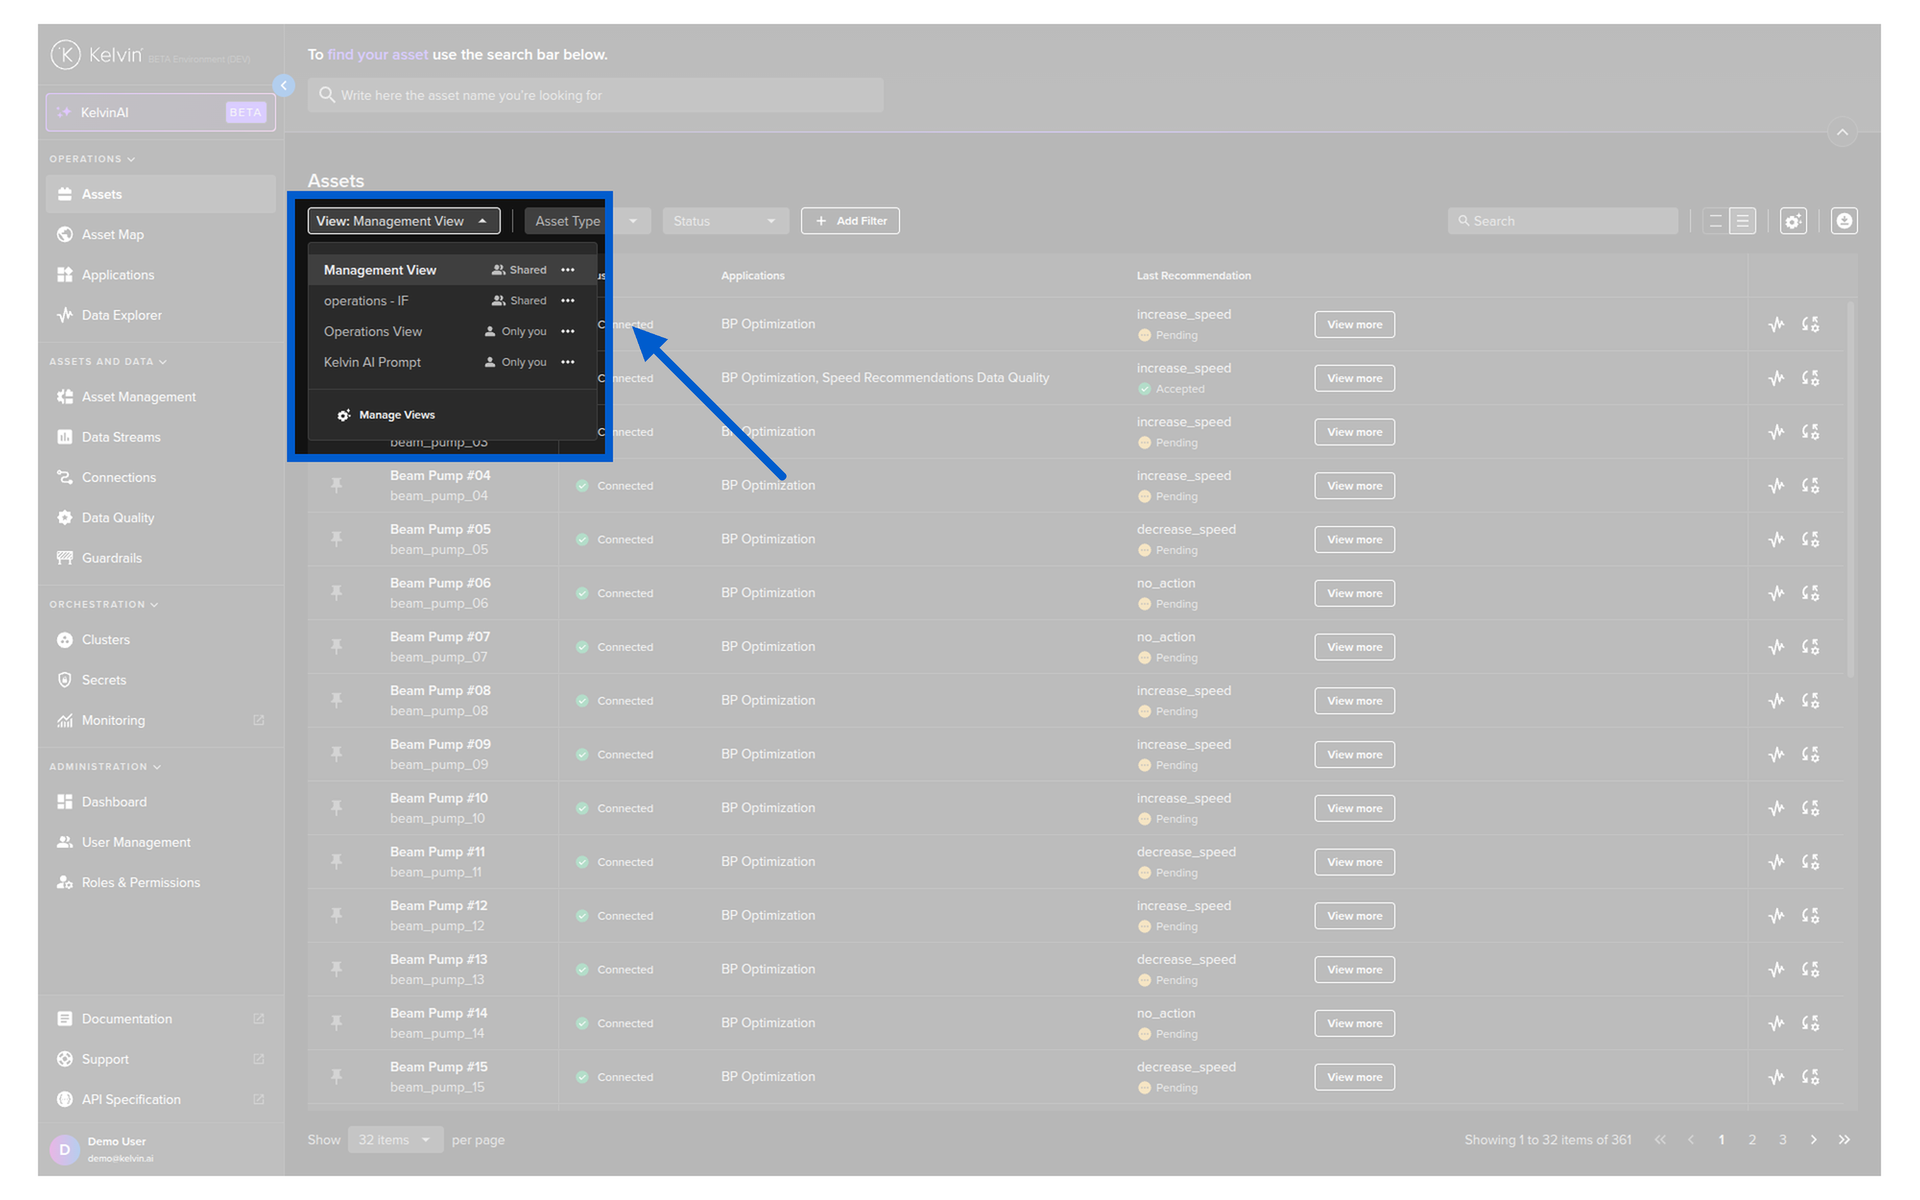
The Default View
The first time you use Kelvin, you start with the default view showing basic columns. Once you save a custom view, it becomes your starting view for future sessions.
View Strategy
Create 2-3 views that match your most common workflows. Name them clearly — "Daily Overview", "Wells in Open Loop", "Critical Assets". Switching should be instant and effortless.
Putting It All Together
Here is a practical example of setting up an efficient asset table view for a real workflow.
Scenario: You manage 300 wells running a Motor Speed Optimization SmartApp. Most are in closed loop. You need to monitor the 20 wells still in open loop and quickly act on any pending recommendations.
Setup:
- Add columns: Motor Temperature (Data Stream), Motor Speed Setpoint (Data Stream), Recommendation (inline action), Open/Closed Loop status (App Parameter)
- Add filter: Application = "Motor Speed Optimization" AND Loop Mode = "Open Loop"
- Pin the 3 wells that have been most problematic this week
- Save this as a view called "Open Loop Wells"
Now every time you log in and select this view, you immediately see your 20 open loop wells with live temperature and speed data, pending recommendations ready for action, and your 3 problem wells pinned at the top.
Quick Reference
| I want to... | How |
|---|---|
| Find an asset by name | Type in the search bar — matches anywhere, not case-sensitive |
| See live data stream values in the table | Add a Data Stream column via column settings |
| See pending recommendations inline | Add a Recommendation column |
| Keep critical assets at the top | Click the pin icon on the asset row |
| Show only Open Loop assets | Add filter → App Parameter → loop mode = open |
| Show only connected assets | Click the Connected status quick filter |
| Save my current layout for later | Save it as a named view |
| Switch between different workflows | Use the views dropdown |
| Start fresh with default columns | Click Reset in column settings |
Quick Quiz
Quiz 1: What is the first page you see when you log into Kelvin?
Answer: The Assets page. It is your home base and the most visited page in the Kelvin UI.
Quiz 2: Are your table settings remembered between sessions?
Answer: Yes. All settings — columns, filters, sorting, row height, pinned assets, and views — are persistent between sessions. Set it up once and it stays.
Quiz 3: How do you add a live data stream value as a column in the asset table?
Answer: Click the column settings icon → select Data Stream → choose the specific data stream. The live value will appear as a column for every asset that has that data stream.
Quiz 4: What is the difference between a filter and a view?
Answer: A filter is a single condition that narrows which assets are shown (e.g., only Connected assets, only those running a specific app). A view is a complete saved configuration — columns, filters, sorting, and all other settings bundled together. Views let you switch entire workflows with one click.
Quiz 5: Can you act on a recommendation directly from the asset table?
Answer: Yes. Add the Recommendation column and you will see a View More button for any asset with a pending recommendation. Click it to open the recommendation popup where you can review evidence, accept, reject, or comment — all without leaving the Assets page.
Quiz 6: What happens if you have a complex filter on a large number of assets?
Answer: The initial filter load can take over 10 seconds. But adding additional filter conditions after that is much faster because they only apply to the already-filtered list. The platform only recalculates the difference.
Quiz 7: How many custom columns can you add?
Answer: There is no practical limit. You can add as many Data Stream, App Parameter, Asset Property, Recommendation, Last Action, Schedule, and Insight columns as you need. Use freeze and hide to manage the view when you have many columns.
Summary
The Assets page is your operational command center. The key things to remember:
- Customize columns to show live data streams, app parameters, recommendations, schedules, and more directly in the table
- Inline actions let you act on recommendations and jump to the Data Explorer without navigating away
- Pin critical assets to keep them at the top of every page
- Advanced filters let you build complex conditions to show exactly the assets that matter right now
- Views let you save and switch between entire table configurations for different workflows
- Everything persists between sessions — set it up once and it is there when you come back
For full documentation:
Good luck and Happy Learning !