Nodes dashboard
Overview
The Nodes dashboard gives you information about the local Node and the Workloads that are running on it.
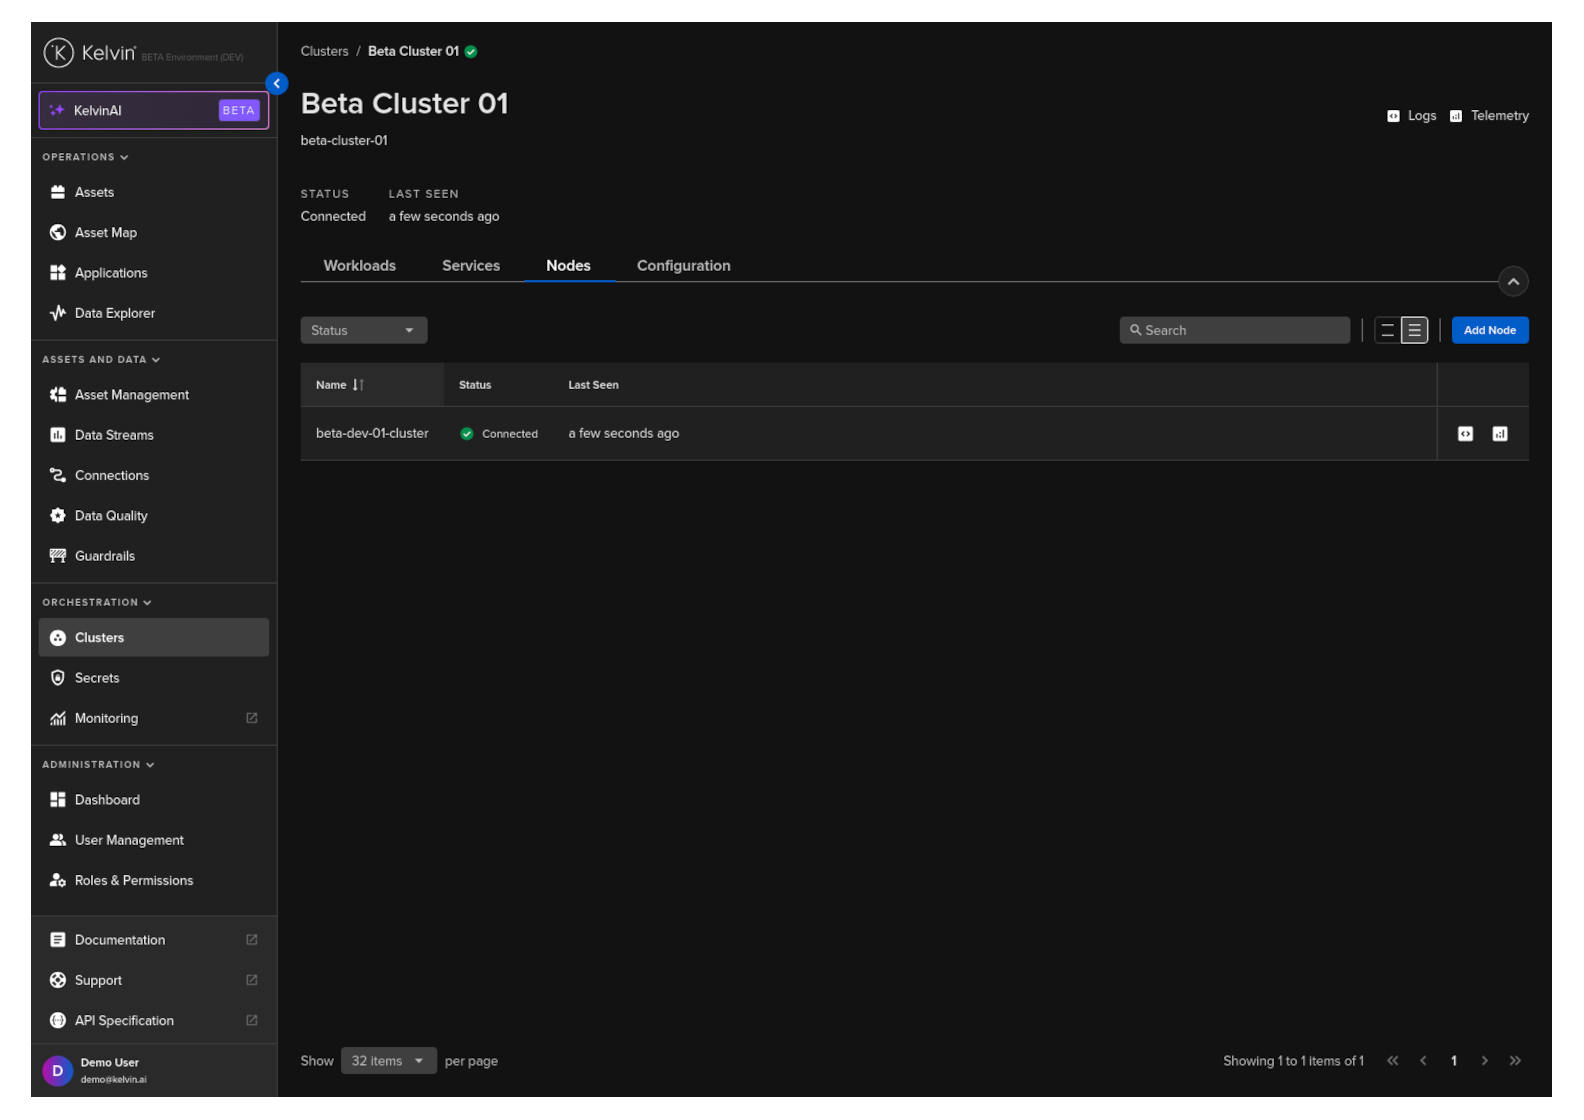
Nodes Status
In a Cluster you can have many Nodes available. In this section you can see all the Nodes in the Cluster and the current status of each Node.
If communications to one or more nodes has been lost, then the status of the affected Nodes will be updated to read "Not Ready".
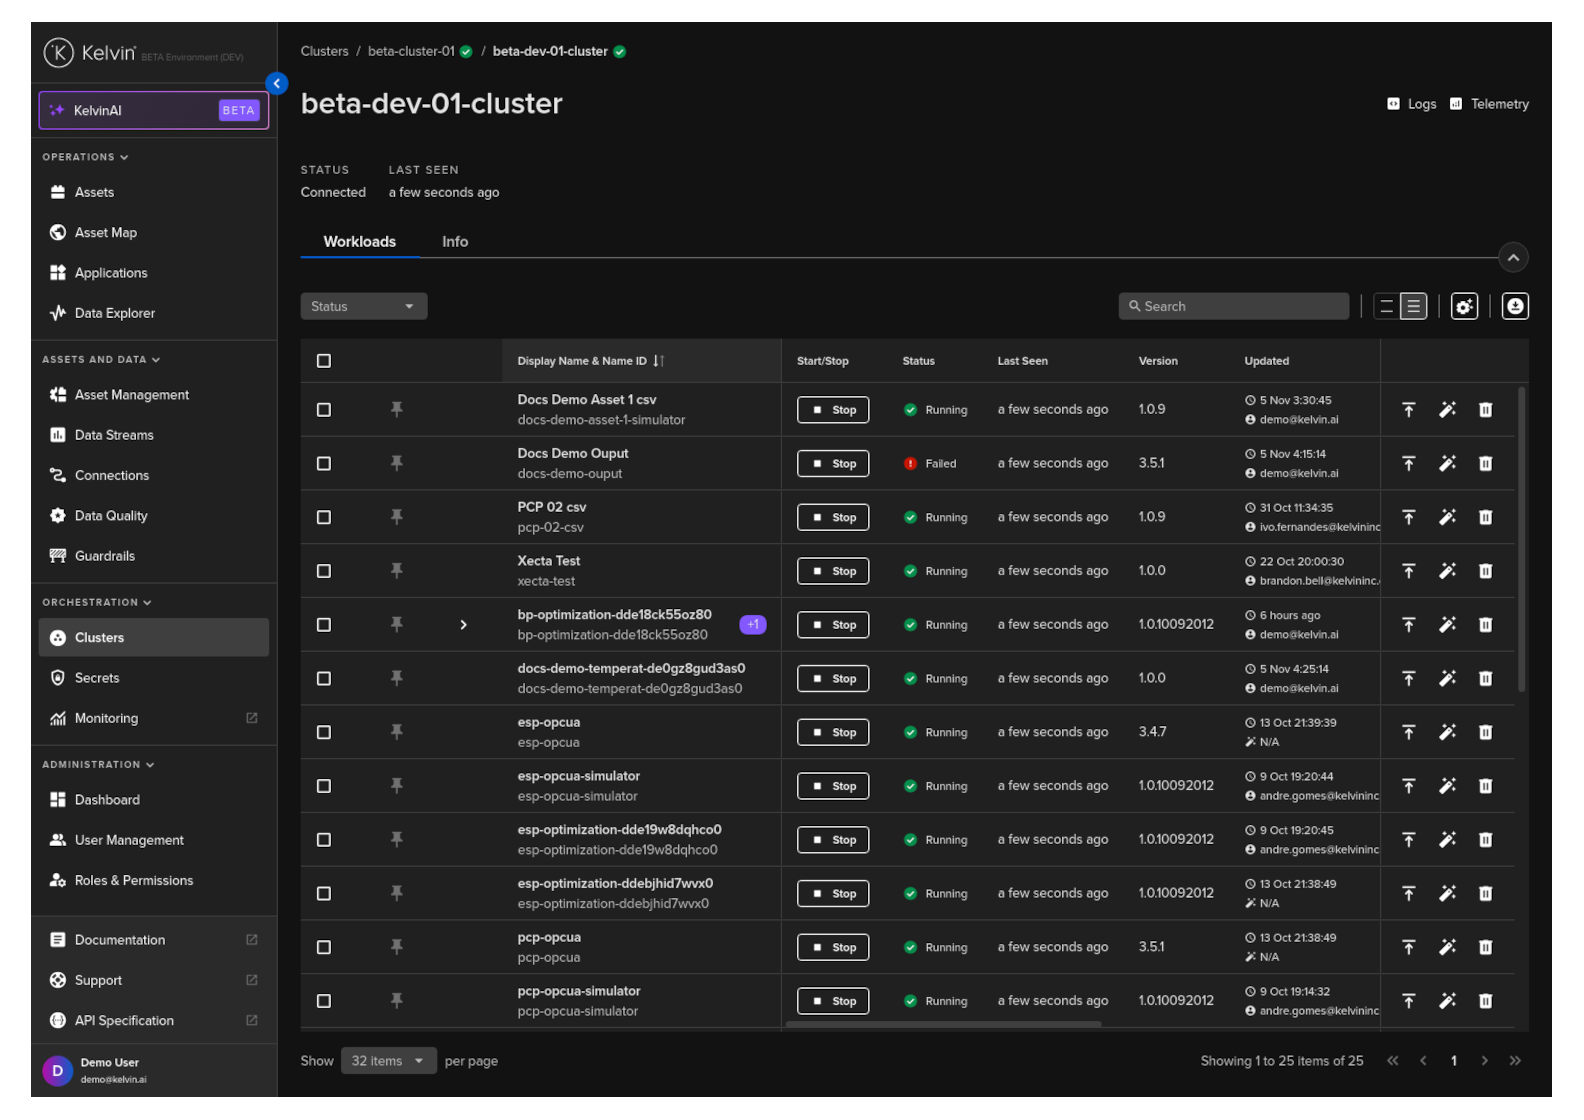
Workloads on Node
If you click on a Node, then you can see more details about the individual Node and the workloads running on the Node.
Details on the workloads screen is the same as the workloads screen for the Cluster.
Node Info
If you click on a Node, then click the info tab you can see more details about the individual Node.
General Information
The top card has the general information about the Node, its operating system and Kubernetes versions.
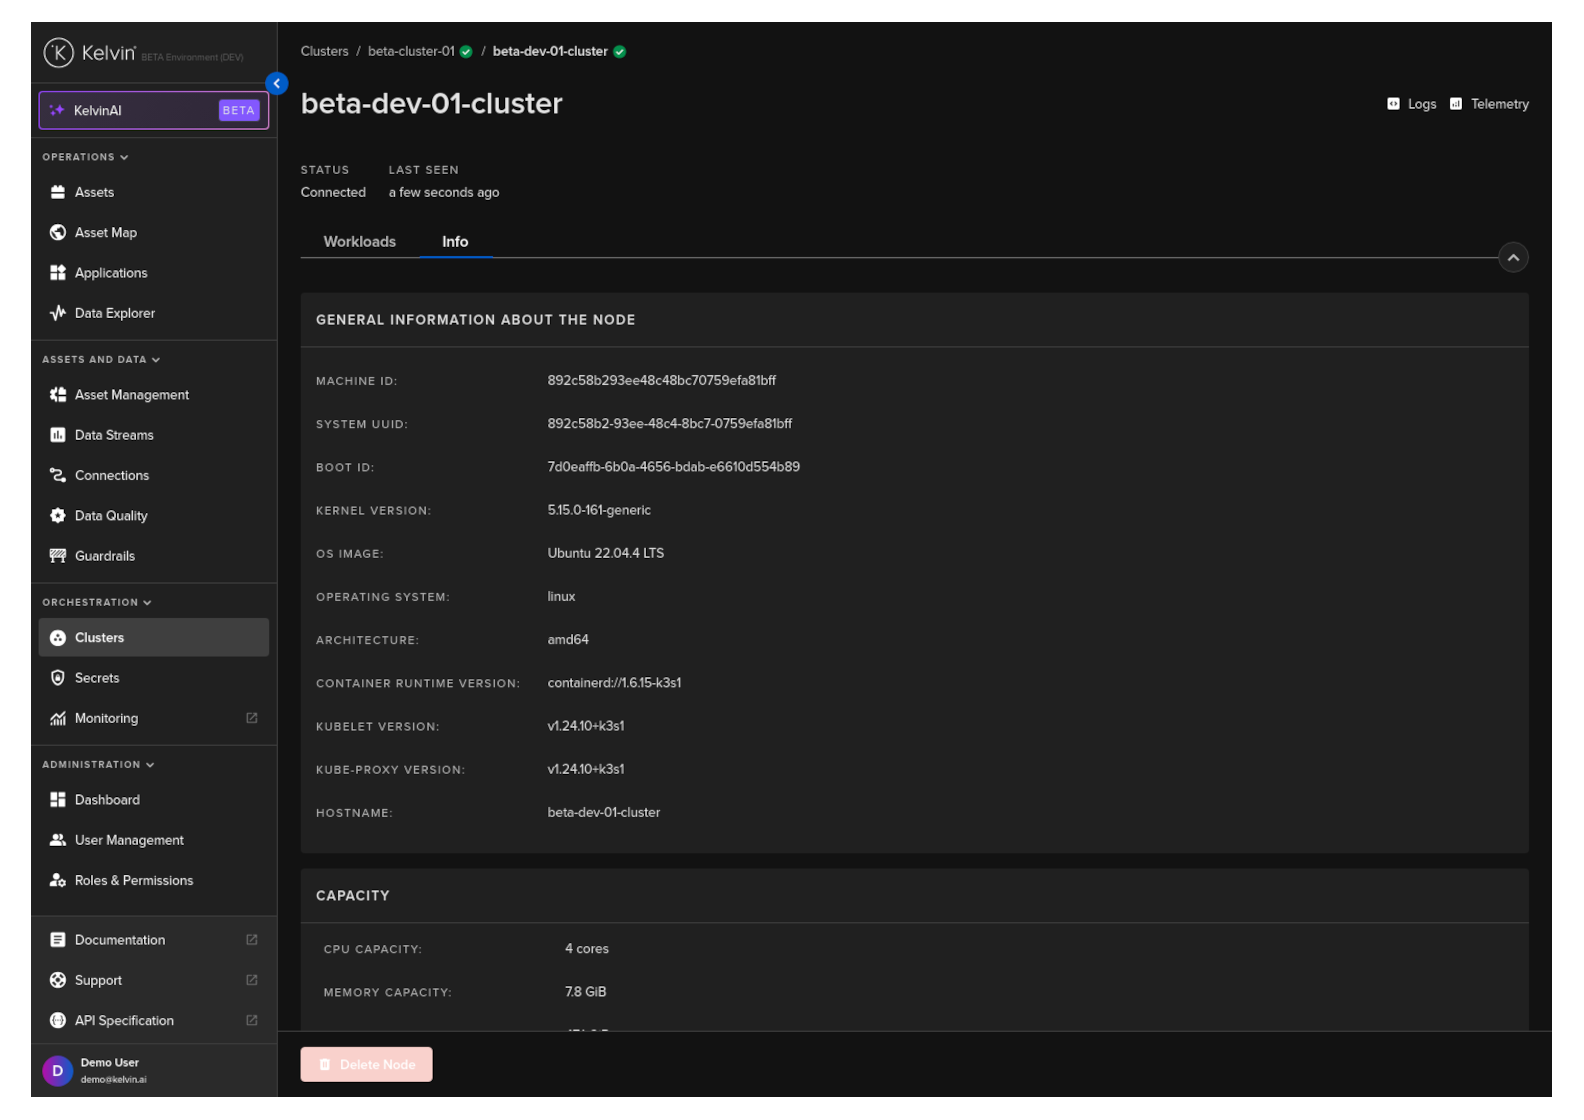
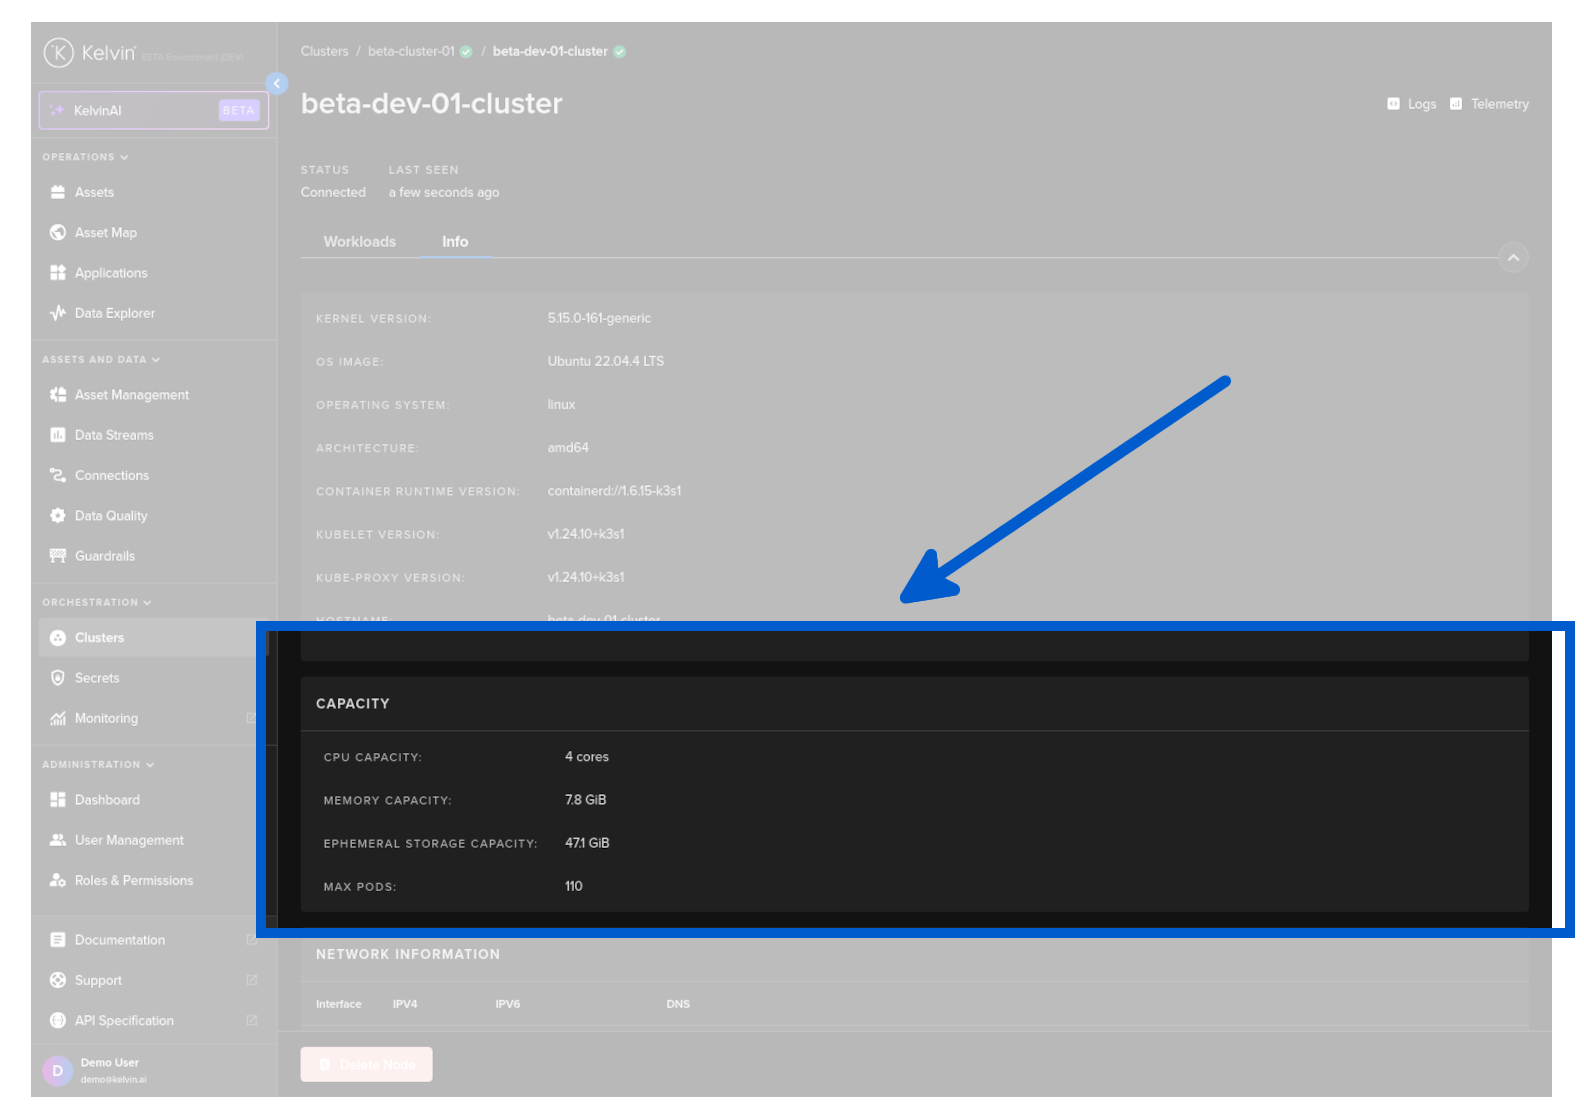
Node Capacity
Below the General Information you can see the current hardware specifications available to the Node.
Scroll down to the bottom and you will see the Capacity card.
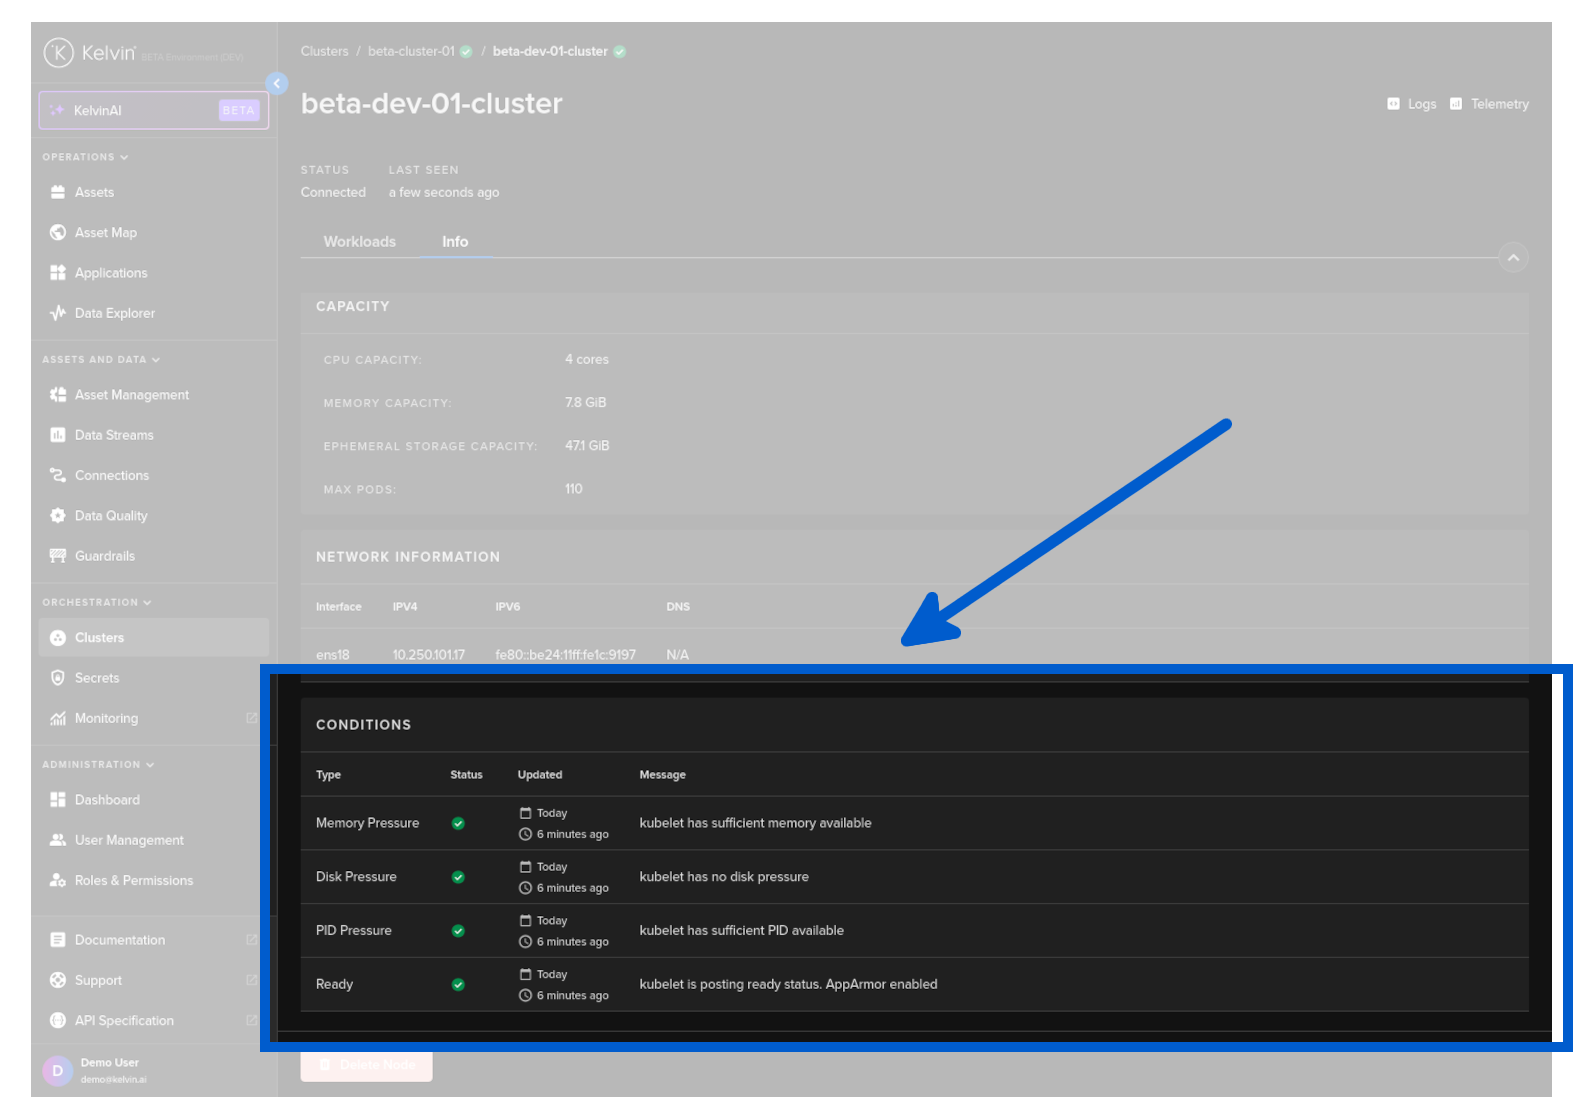
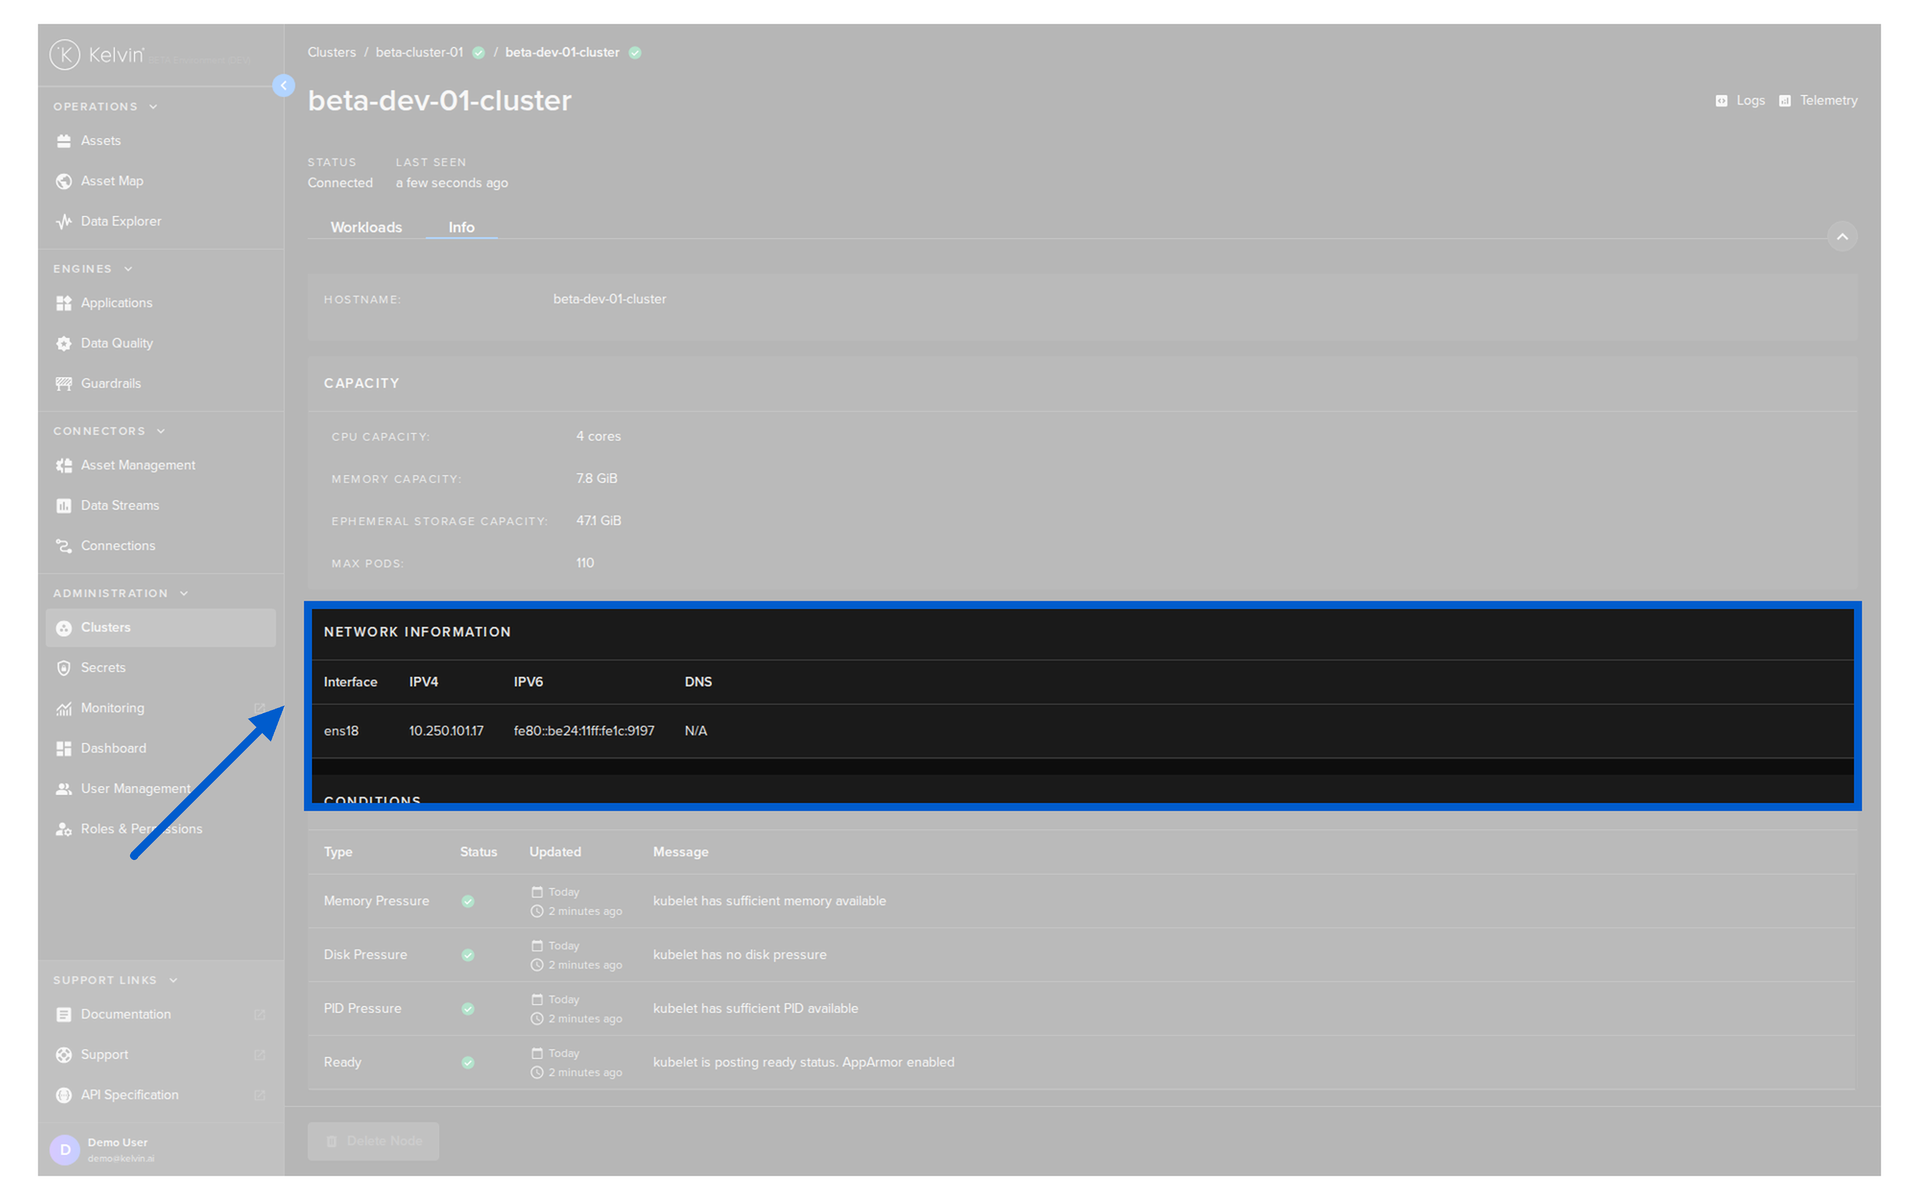
Network Information
Below the Capacity you can see the physical network interface information.
Node Conditions
And finally at the bottom it is possible to monitor the condition of the resources used by the Node in real time and to see any problems.
Scroll down to the bottom and you will see the Conditions card.